Air Pollution in Lujiachong: Real-time Air Quality Index and smog alert.
Pollution and air quality forecast for Lujiachong. Today is Tuesday, June 16, 2026. The following air pollution values have been recorded for Lujiachong:- particulate matter (PM10) suspended dust - 179 (Very bad Hazardous)
- particulate matter (PM2.5) dust - 35 (Unhealthy for Sensitive Groups)
- ozone (O3) - 0 (Good)
- nitrogen dioxide (NO2) - 0 (Good)
- sulfur dioxide (SO2) - 0 (Good)

What is the air quality in Lujiachong today? Is the air polluted in Lujiachong?. Is there smog?
What is the level of PM10 today in Lujiachong? (particulate matter (PM10) suspended dust)
The current level of particulate matter PM10 in Lujiachong is:
179 (Very bad Hazardous)
The highest PM10 values usually occur in month: 77 (January 2019).
The lowest value of particulate matter PM10 pollution in Lujiachong is usually recorded in: February (30).
What is the current level of PM2.5 in Lujiachong? (particulate matter (PM2.5) dust)
Today's PM2.5 level is:
35 (Unhealthy for Sensitive Groups)
For comparison, the highest level of PM2.5 in Lujiachong in the last 7 days was: 56 (Friday, May 27, 2022) and the lowest: 56 (Friday, May 27, 2022).
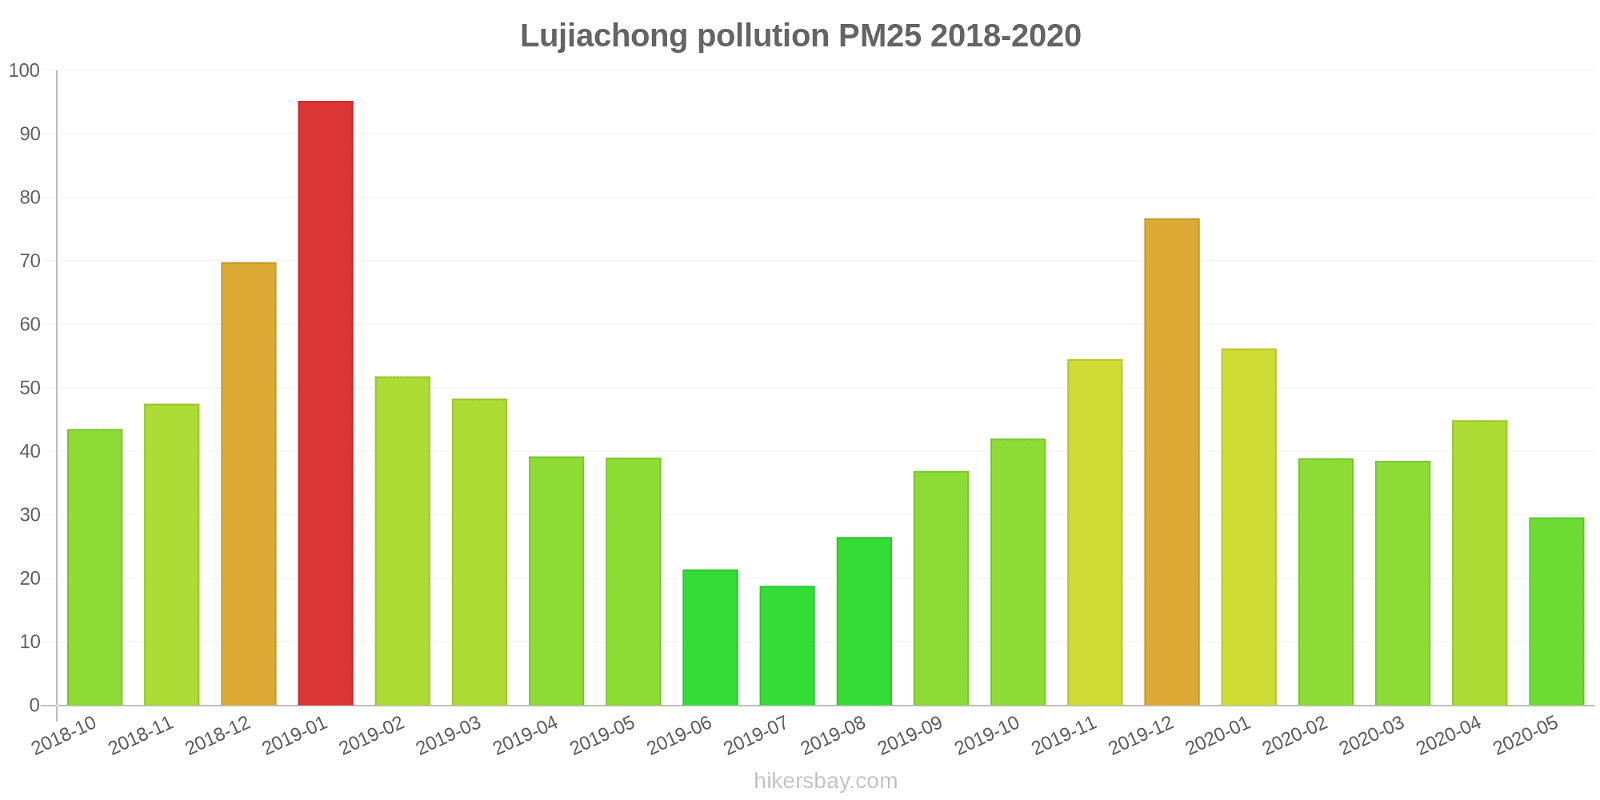
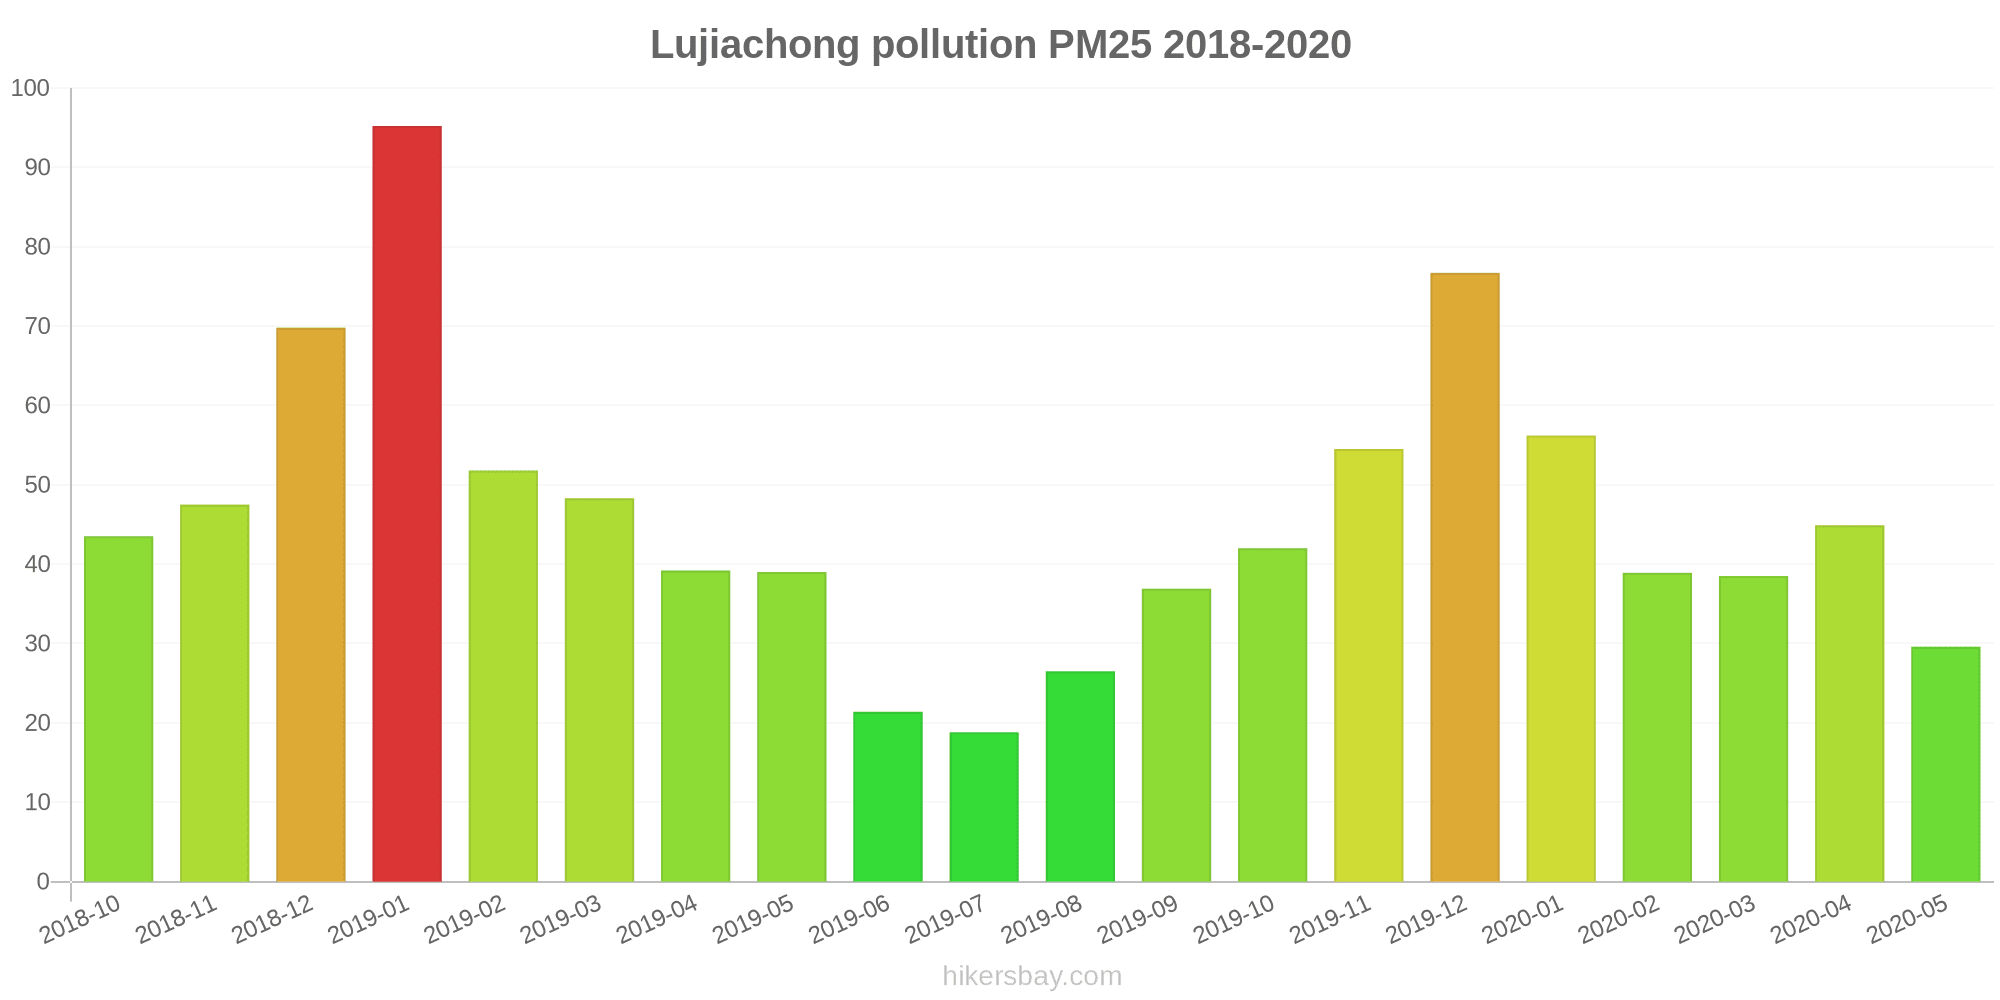
The highest PM2.5 values were recorded: 95 (January 2019).
The lowest level of particulate matter PM2.5 pollution occurs in month: July (19).
How is the O3 level today in Lujiachong? (ozone (O3))
0 (Good)
How high is the level of NO2? (nitrogen dioxide (NO2))
0 (Good)
What is the level of SO2 pollution? (sulfur dioxide (SO2))
0 (Good)
Current data Friday, May 27, 2022, 12:00 PM
PM10 179 (Very bad Hazardous)
PM2,5 35 (Unhealthy for Sensitive Groups)
O3 0 (Good)
NO2 0 (Good)
SO2 0 (Good)
Data on air pollution from recent days in Lujiachong
index
2022-05-27
pm10
56
Unhealthy for Sensitive Groups
pm25
56
Unhealthy
o3
0
Good
no2
0
Good
so2
0
Good
data source »
Air pollution in Lujiachong from October 2018 to May 2020
index
2020-05
2020-04
2020-03
2020-02
2020-01
2019-12
2019-11
2019-10
2019-09
2019-08
2019-07
2019-06
2019-05
2019-04
2019-03
2019-02
2019-01
2018-12
2018-11
2018-10
pm25
30 (Moderate)
45 (Unhealthy for Sensitive Groups)
39 (Unhealthy for Sensitive Groups)
39 (Unhealthy for Sensitive Groups)
56 (Unhealthy)
77 (Very Unhealthy)
55 (Unhealthy for Sensitive Groups)
42 (Unhealthy for Sensitive Groups)
37 (Unhealthy for Sensitive Groups)
27 (Moderate)
19 (Moderate)
21 (Moderate)
39 (Unhealthy for Sensitive Groups)
39 (Unhealthy for Sensitive Groups)
48 (Unhealthy for Sensitive Groups)
52 (Unhealthy for Sensitive Groups)
95 (Very Unhealthy)
70 (Unhealthy)
48 (Unhealthy for Sensitive Groups)
44 (Unhealthy for Sensitive Groups)
co
717 (Good)
793 (Good)
899 (Good)
854 (Good)
1 (Good)
1 (Good)
877 (Good)
763 (Good)
815 (Good)
775 (Good)
783 (Good)
780 (Good)
737 (Good)
876 (Good)
909 (Good)
1 (Good)
1 (Good)
929 (Good)
791 (Good)
781 (Good)
no2
17 (Good)
32 (Good)
26 (Good)
14 (Good)
26 (Good)
49 (Moderate)
39 (Good)
33 (Good)
32 (Good)
27 (Good)
16 (Good)
20 (Good)
32 (Good)
33 (Good)
43 (Moderate)
25 (Good)
40 (Moderate)
41 (Moderate)
45 (Moderate)
53 (Moderate)
o3
121 (Unhealthy for Sensitive Groups)
142 (Unhealthy for Sensitive Groups)
91 (Moderate)
80 (Moderate)
57 (Good)
63 (Good)
109 (Moderate)
121 (Unhealthy for Sensitive Groups)
187 (Very Unhealthy)
163 (Unhealthy)
132 (Unhealthy for Sensitive Groups)
137 (Unhealthy for Sensitive Groups)
131 (Unhealthy for Sensitive Groups)
116 (Moderate)
97 (Moderate)
56 (Good)
54 (Good)
41 (Good)
81 (Moderate)
108 (Moderate)
pm10
42 (Moderate)
50 (Moderate)
37 (Moderate)
30 (Moderate)
40 (Moderate)
70 (Unhealthy for Sensitive Groups)
71 (Unhealthy for Sensitive Groups)
62 (Unhealthy for Sensitive Groups)
74 (Unhealthy for Sensitive Groups)
52 (Unhealthy for Sensitive Groups)
37 (Moderate)
38 (Moderate)
61 (Unhealthy for Sensitive Groups)
45 (Moderate)
60 (Unhealthy for Sensitive Groups)
44 (Moderate)
77 (Unhealthy for Sensitive Groups)
58 (Unhealthy for Sensitive Groups)
57 (Unhealthy for Sensitive Groups)
60 (Unhealthy for Sensitive Groups)
so2
5.8 (Good)
8.5 (Good)
5.5 (Good)
4.5 (Good)
4.3 (Good)
7.2 (Good)
7.5 (Good)
6.1 (Good)
7.1 (Good)
5.3 (Good)
4.9 (Good)
5.4 (Good)
6.3 (Good)
5.3 (Good)
6.5 (Good)
5.6 (Good)
6.8 (Good)
7.8 (Good)
8.8 (Good)
9.8 (Good)
data source »
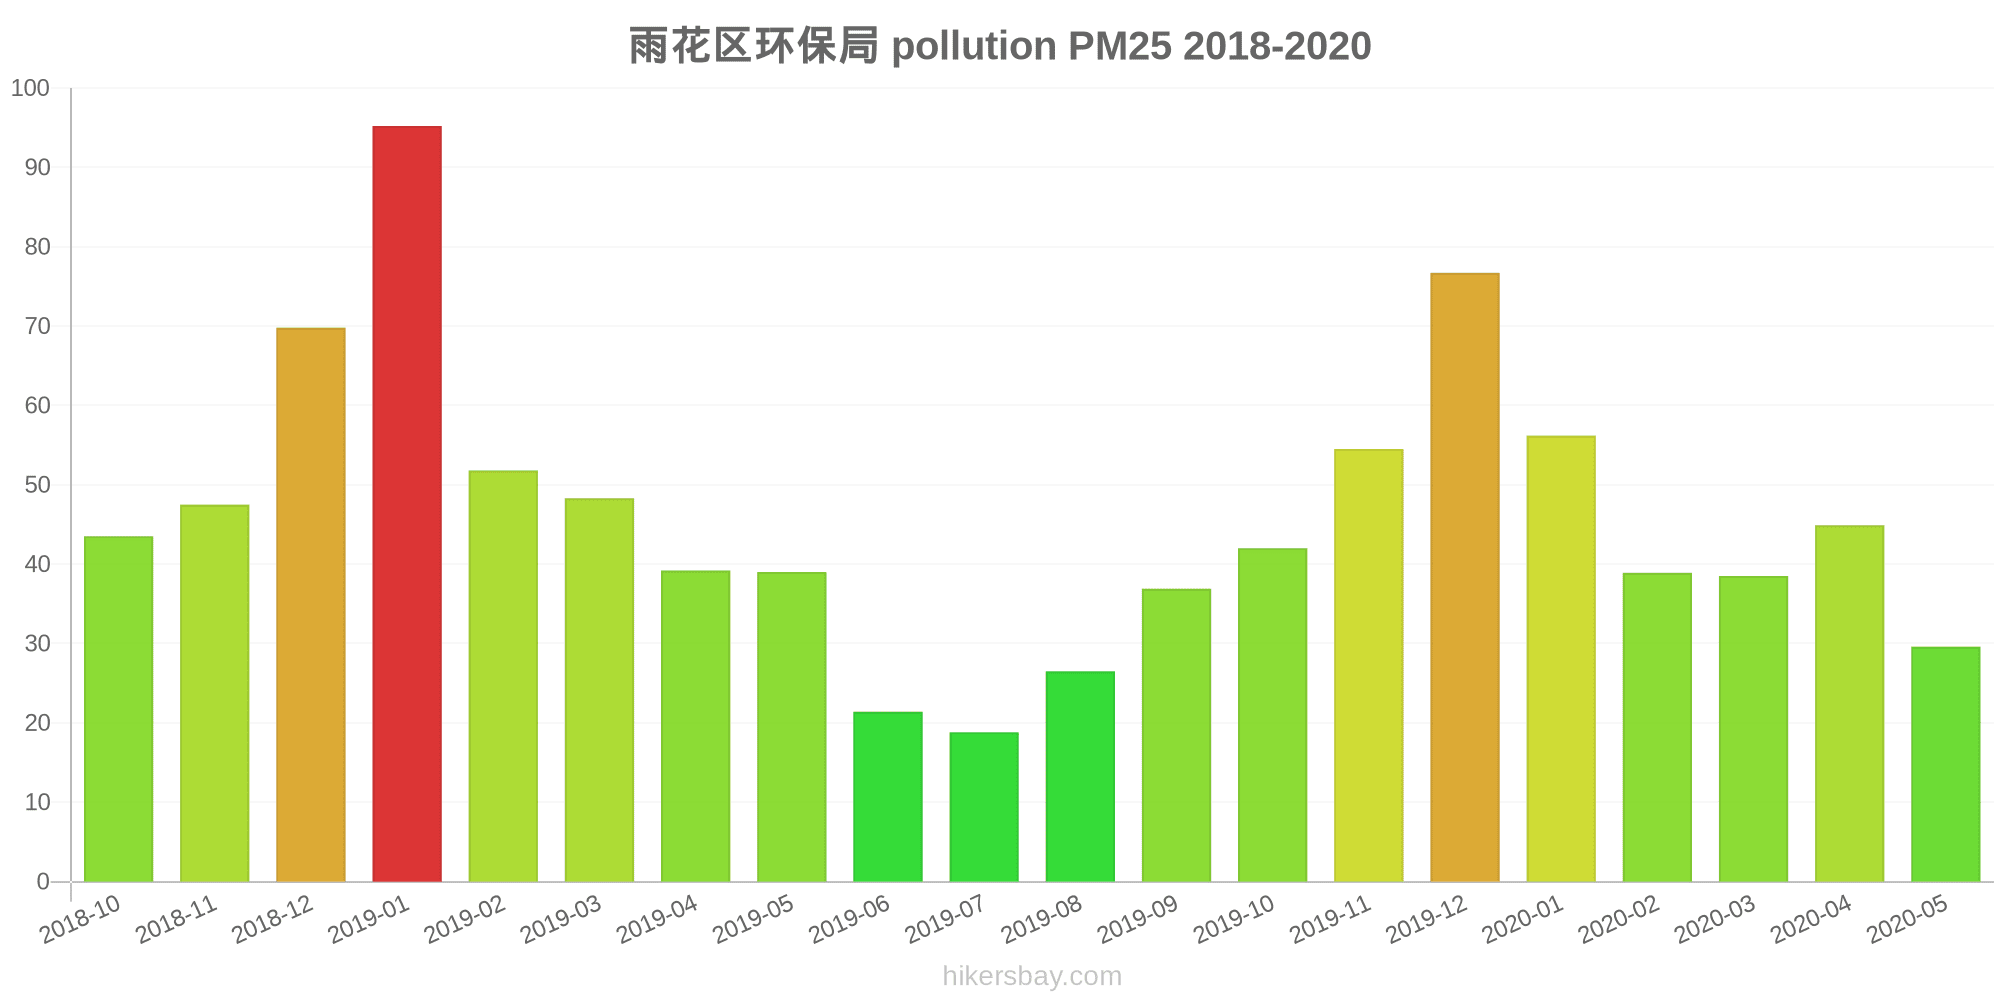
雨花区环保局
Friday, May 27, 2022, 12:00 PM
PM10 179 (Very bad Hazardous)
particulate matter (PM10) suspended dust
PM2,5 35 (Unhealthy for Sensitive Groups)
particulate matter (PM2.5) dust
O3 0.04 (Good)
ozone (O3)
NO2 0 (Good)
nitrogen dioxide (NO2)
SO2 0 (Good)
sulfur dioxide (SO2)
雨花区环保局
index
2022-05-27
pm10
56
pm25
56
o3
0.03
no2
0
so2
0
雨花区环保局
2018-10 2020-05

index
2020-05
2020-04
2020-03
2020-02
2020-01
2019-12
2019-11
2019-10
2019-09
2019-08
2019-07
2019-06
2019-05
2019-04
2019-03
2019-02
2019-01
2018-12
2018-11
2018-10
pm25
30
45
39
39
56
77
55
42
37
27
19
21
39
39
48
52
95
70
48
44
co
717
793
899
854
1
1
877
763
815
775
783
780
737
876
909
1
1
929
791
781
no2
17
32
26
14
26
49
39
33
32
27
16
20
32
33
43
25
40
41
45
53
o3
121
142
91
80
57
63
109
121
187
163
132
137
131
116
97
56
54
41
81
108
pm10
42
50
37
30
40
70
71
62
74
52
37
38
61
45
60
44
77
58
57
60
so2
5.8
8.5
5.5
4.5
4.3
7.2
7.5
6.1
7.1
5.3
4.9
5.4
6.3
5.3
6.5
5.6
6.8
7.8
8.8
9.8
* Pollution data source:
https://openaq.org
(ChinaAQIData)
The data is licensed under CC-By 4.0
PM10 179 (Very bad Hazardous)
PM2,5 35 (Unhealthy for Sensitive Groups)
O3 0 (Good)
NO2 0 (Good)
SO2 0 (Good)
Data on air pollution from recent days in Lujiachong
| index | 2022-05-27 |
|---|---|
| pm10 | 56 Unhealthy for Sensitive Groups |
| pm25 | 56 Unhealthy |
| o3 | 0 Good |
| no2 | 0 Good |
| so2 | 0 Good |
| index | 2020-05 | 2020-04 | 2020-03 | 2020-02 | 2020-01 | 2019-12 | 2019-11 | 2019-10 | 2019-09 | 2019-08 | 2019-07 | 2019-06 | 2019-05 | 2019-04 | 2019-03 | 2019-02 | 2019-01 | 2018-12 | 2018-11 | 2018-10 |
|---|---|---|---|---|---|---|---|---|---|---|---|---|---|---|---|---|---|---|---|---|
| pm25 | 30 (Moderate) | 45 (Unhealthy for Sensitive Groups) | 39 (Unhealthy for Sensitive Groups) | 39 (Unhealthy for Sensitive Groups) | 56 (Unhealthy) | 77 (Very Unhealthy) | 55 (Unhealthy for Sensitive Groups) | 42 (Unhealthy for Sensitive Groups) | 37 (Unhealthy for Sensitive Groups) | 27 (Moderate) | 19 (Moderate) | 21 (Moderate) | 39 (Unhealthy for Sensitive Groups) | 39 (Unhealthy for Sensitive Groups) | 48 (Unhealthy for Sensitive Groups) | 52 (Unhealthy for Sensitive Groups) | 95 (Very Unhealthy) | 70 (Unhealthy) | 48 (Unhealthy for Sensitive Groups) | 44 (Unhealthy for Sensitive Groups) |
| co | 717 (Good) | 793 (Good) | 899 (Good) | 854 (Good) | 1 (Good) | 1 (Good) | 877 (Good) | 763 (Good) | 815 (Good) | 775 (Good) | 783 (Good) | 780 (Good) | 737 (Good) | 876 (Good) | 909 (Good) | 1 (Good) | 1 (Good) | 929 (Good) | 791 (Good) | 781 (Good) |
| no2 | 17 (Good) | 32 (Good) | 26 (Good) | 14 (Good) | 26 (Good) | 49 (Moderate) | 39 (Good) | 33 (Good) | 32 (Good) | 27 (Good) | 16 (Good) | 20 (Good) | 32 (Good) | 33 (Good) | 43 (Moderate) | 25 (Good) | 40 (Moderate) | 41 (Moderate) | 45 (Moderate) | 53 (Moderate) |
| o3 | 121 (Unhealthy for Sensitive Groups) | 142 (Unhealthy for Sensitive Groups) | 91 (Moderate) | 80 (Moderate) | 57 (Good) | 63 (Good) | 109 (Moderate) | 121 (Unhealthy for Sensitive Groups) | 187 (Very Unhealthy) | 163 (Unhealthy) | 132 (Unhealthy for Sensitive Groups) | 137 (Unhealthy for Sensitive Groups) | 131 (Unhealthy for Sensitive Groups) | 116 (Moderate) | 97 (Moderate) | 56 (Good) | 54 (Good) | 41 (Good) | 81 (Moderate) | 108 (Moderate) |
| pm10 | 42 (Moderate) | 50 (Moderate) | 37 (Moderate) | 30 (Moderate) | 40 (Moderate) | 70 (Unhealthy for Sensitive Groups) | 71 (Unhealthy for Sensitive Groups) | 62 (Unhealthy for Sensitive Groups) | 74 (Unhealthy for Sensitive Groups) | 52 (Unhealthy for Sensitive Groups) | 37 (Moderate) | 38 (Moderate) | 61 (Unhealthy for Sensitive Groups) | 45 (Moderate) | 60 (Unhealthy for Sensitive Groups) | 44 (Moderate) | 77 (Unhealthy for Sensitive Groups) | 58 (Unhealthy for Sensitive Groups) | 57 (Unhealthy for Sensitive Groups) | 60 (Unhealthy for Sensitive Groups) |
| so2 | 5.8 (Good) | 8.5 (Good) | 5.5 (Good) | 4.5 (Good) | 4.3 (Good) | 7.2 (Good) | 7.5 (Good) | 6.1 (Good) | 7.1 (Good) | 5.3 (Good) | 4.9 (Good) | 5.4 (Good) | 6.3 (Good) | 5.3 (Good) | 6.5 (Good) | 5.6 (Good) | 6.8 (Good) | 7.8 (Good) | 8.8 (Good) | 9.8 (Good) |
PM10 179 (Very bad Hazardous)
particulate matter (PM10) suspended dustPM2,5 35 (Unhealthy for Sensitive Groups)
particulate matter (PM2.5) dustO3 0.04 (Good)
ozone (O3)NO2 0 (Good)
nitrogen dioxide (NO2)SO2 0 (Good)
sulfur dioxide (SO2)雨花区环保局
| index | 2022-05-27 |
|---|---|
| pm10 | 56 |
| pm25 | 56 |
| o3 | 0.03 |
| no2 | 0 |
| so2 | 0 |
雨花区环保局
| index | 2020-05 | 2020-04 | 2020-03 | 2020-02 | 2020-01 | 2019-12 | 2019-11 | 2019-10 | 2019-09 | 2019-08 | 2019-07 | 2019-06 | 2019-05 | 2019-04 | 2019-03 | 2019-02 | 2019-01 | 2018-12 | 2018-11 | 2018-10 |
|---|---|---|---|---|---|---|---|---|---|---|---|---|---|---|---|---|---|---|---|---|
| pm25 | 30 | 45 | 39 | 39 | 56 | 77 | 55 | 42 | 37 | 27 | 19 | 21 | 39 | 39 | 48 | 52 | 95 | 70 | 48 | 44 |
| co | 717 | 793 | 899 | 854 | 1 | 1 | 877 | 763 | 815 | 775 | 783 | 780 | 737 | 876 | 909 | 1 | 1 | 929 | 791 | 781 |
| no2 | 17 | 32 | 26 | 14 | 26 | 49 | 39 | 33 | 32 | 27 | 16 | 20 | 32 | 33 | 43 | 25 | 40 | 41 | 45 | 53 |
| o3 | 121 | 142 | 91 | 80 | 57 | 63 | 109 | 121 | 187 | 163 | 132 | 137 | 131 | 116 | 97 | 56 | 54 | 41 | 81 | 108 |
| pm10 | 42 | 50 | 37 | 30 | 40 | 70 | 71 | 62 | 74 | 52 | 37 | 38 | 61 | 45 | 60 | 44 | 77 | 58 | 57 | 60 |
| so2 | 5.8 | 8.5 | 5.5 | 4.5 | 4.3 | 7.2 | 7.5 | 6.1 | 7.1 | 5.3 | 4.9 | 5.4 | 6.3 | 5.3 | 6.5 | 5.6 | 6.8 | 7.8 | 8.8 | 9.8 |