Air Pollution in Yangziba: Real-time Air Quality Index and smog alert.
Pollution and air quality forecast for Yangziba. Today is Tuesday, June 16, 2026. The following air pollution values have been recorded for Yangziba:- particulate matter (PM10) suspended dust - 179 (Very bad Hazardous)
- particulate matter (PM2.5) dust - 35 (Unhealthy for Sensitive Groups)
- ozone (O3) - 0 (Good)
- nitrogen dioxide (NO2) - 0 (Good)
- sulfur dioxide (SO2) - 0 (Good)

What is the air quality in Yangziba today? Is the air polluted in Yangziba?. Is there smog?
What is the level of PM10 today in Yangziba? (particulate matter (PM10) suspended dust)
The current level of particulate matter PM10 in Yangziba is:
179 (Very bad Hazardous)
The highest PM10 values usually occur in month: 87 (January 2019).
The lowest value of particulate matter PM10 pollution in Yangziba is usually recorded in: February (39).
What is the current level of PM2.5 in Yangziba? (particulate matter (PM2.5) dust)
Today's PM2.5 level is:
35 (Unhealthy for Sensitive Groups)
For comparison, the highest level of PM2.5 in Yangziba in the last 7 days was: 56 (Friday, May 27, 2022) and the lowest: 56 (Friday, May 27, 2022).
The highest PM2.5 values were recorded: 102 (January 2019).
The lowest level of particulate matter PM2.5 pollution occurs in month: July (22).
How is the O3 level today in Yangziba? (ozone (O3))
0 (Good)
How high is the level of NO2? (nitrogen dioxide (NO2))
0 (Good)
What is the level of SO2 pollution? (sulfur dioxide (SO2))
0 (Good)
Current data Friday, May 27, 2022, 12:00 PM
PM10 179 (Very bad Hazardous)
PM2,5 35 (Unhealthy for Sensitive Groups)
O3 0 (Good)
NO2 0 (Good)
SO2 0 (Good)
Data on air pollution from recent days in Yangziba
index
2022-05-27
pm10
56
Unhealthy for Sensitive Groups
pm25
56
Unhealthy
o3
0
Good
no2
0
Good
so2
0
Good
data source »
Air pollution in Yangziba from October 2018 to May 2020
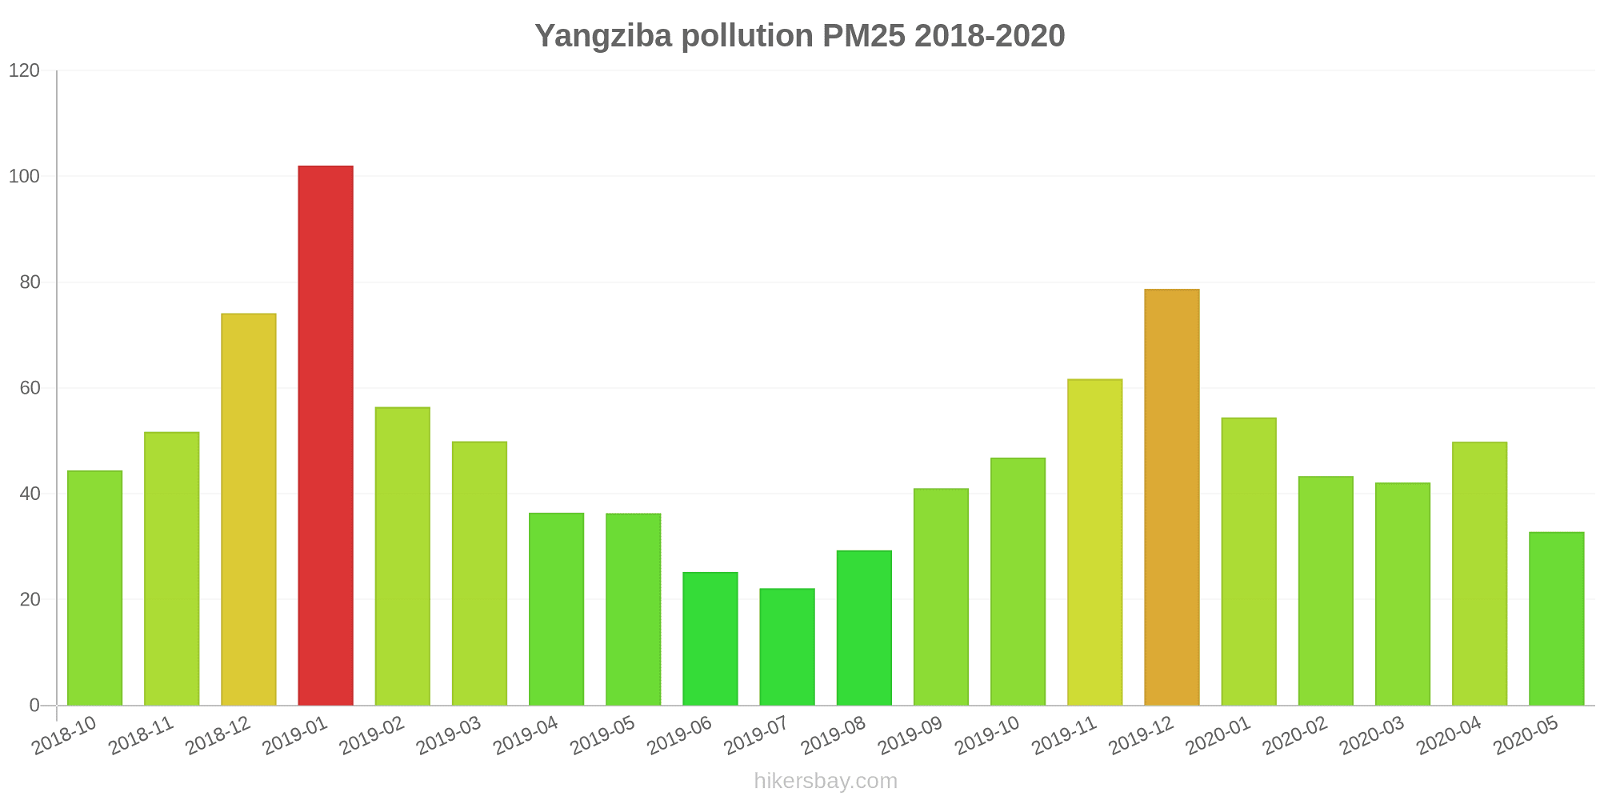
index
2020-05
2020-04
2020-03
2020-02
2020-01
2019-12
2019-11
2019-10
2019-09
2019-08
2019-07
2019-06
2019-05
2019-04
2019-03
2019-02
2019-01
2018-12
2018-11
2018-10
pm25
33 (Moderate)
50 (Unhealthy for Sensitive Groups)
42 (Unhealthy for Sensitive Groups)
43 (Unhealthy for Sensitive Groups)
54 (Unhealthy for Sensitive Groups)
79 (Very Unhealthy)
62 (Unhealthy)
47 (Unhealthy for Sensitive Groups)
41 (Unhealthy for Sensitive Groups)
29 (Moderate)
22 (Moderate)
25 (Moderate)
36 (Unhealthy for Sensitive Groups)
36 (Unhealthy for Sensitive Groups)
50 (Unhealthy for Sensitive Groups)
56 (Unhealthy)
102 (Very Unhealthy)
74 (Unhealthy)
52 (Unhealthy for Sensitive Groups)
44 (Unhealthy for Sensitive Groups)
co
714 (Good)
695 (Good)
792 (Good)
707 (Good)
1 (Good)
1 (Good)
887 (Good)
932 (Good)
806 (Good)
746 (Good)
723 (Good)
756 (Good)
757 (Good)
886 (Good)
935 (Good)
973 (Good)
1 (Good)
949 (Good)
801 (Good)
730 (Good)
no2
23 (Good)
39 (Good)
26 (Good)
14 (Good)
28 (Good)
56 (Moderate)
48 (Moderate)
41 (Moderate)
34 (Good)
22 (Good)
18 (Good)
21 (Good)
30 (Good)
32 (Good)
42 (Moderate)
23 (Good)
43 (Moderate)
38 (Good)
40 (Moderate)
45 (Moderate)
o3
131 (Unhealthy for Sensitive Groups)
148 (Unhealthy for Sensitive Groups)
91 (Moderate)
86 (Moderate)
58 (Good)
65 (Good)
116 (Moderate)
126 (Unhealthy for Sensitive Groups)
186 (Very Unhealthy)
180 (Very Unhealthy)
147 (Unhealthy for Sensitive Groups)
148 (Unhealthy for Sensitive Groups)
139 (Unhealthy for Sensitive Groups)
119 (Moderate)
92 (Moderate)
52 (Good)
48 (Good)
36 (Good)
74 (Moderate)
99 (Moderate)
pm10
51 (Unhealthy for Sensitive Groups)
66 (Unhealthy for Sensitive Groups)
48 (Moderate)
39 (Moderate)
48 (Moderate)
84 (Unhealthy)
85 (Unhealthy)
71 (Unhealthy for Sensitive Groups)
75 (Unhealthy for Sensitive Groups)
52 (Unhealthy for Sensitive Groups)
40 (Moderate)
40 (Moderate)
70 (Unhealthy for Sensitive Groups)
54 (Unhealthy for Sensitive Groups)
69 (Unhealthy for Sensitive Groups)
51 (Unhealthy for Sensitive Groups)
87 (Unhealthy)
62 (Unhealthy for Sensitive Groups)
64 (Unhealthy for Sensitive Groups)
68 (Unhealthy for Sensitive Groups)
so2
7.8 (Good)
8 (Good)
7.8 (Good)
7.6 (Good)
6.2 (Good)
10 (Good)
11 (Good)
9.3 (Good)
10 (Good)
7.5 (Good)
6.2 (Good)
5.5 (Good)
5.4 (Good)
8.5 (Good)
11 (Good)
6.7 (Good)
7.8 (Good)
8.8 (Good)
9.7 (Good)
10 (Good)
data source »
马坡岭
Friday, May 27, 2022, 12:00 PM
PM10 179 (Very bad Hazardous)
particulate matter (PM10) suspended dust
PM2,5 35 (Unhealthy for Sensitive Groups)
particulate matter (PM2.5) dust
O3 0.04 (Good)
ozone (O3)
NO2 0 (Good)
nitrogen dioxide (NO2)
SO2 0 (Good)
sulfur dioxide (SO2)
马坡岭
index
2022-05-27
pm10
56
pm25
56
o3
0.03
no2
0
so2
0
马坡岭
2018-10 2020-05
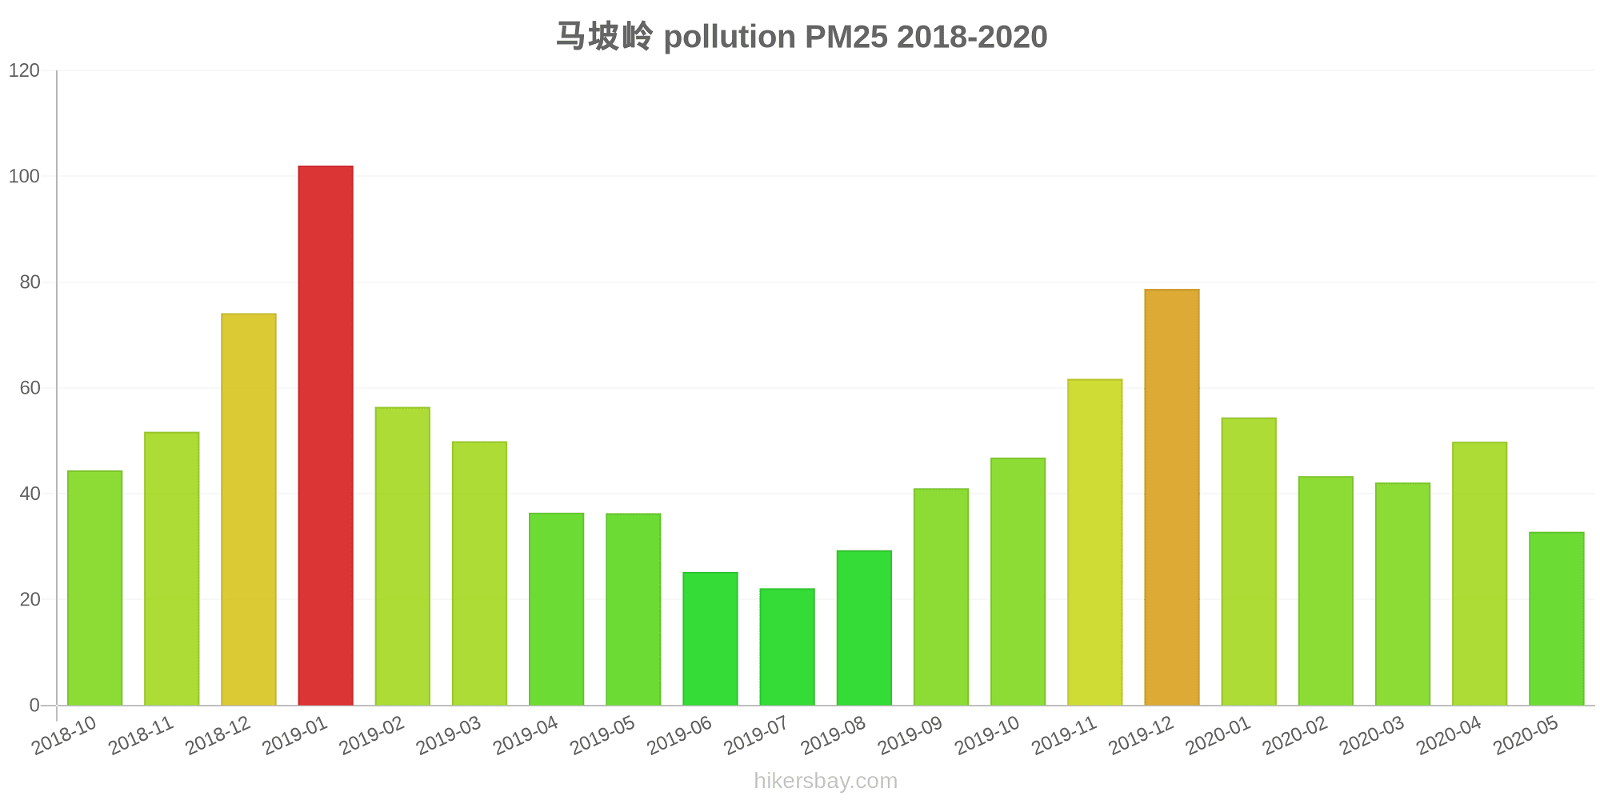
index
2020-05
2020-04
2020-03
2020-02
2020-01
2019-12
2019-11
2019-10
2019-09
2019-08
2019-07
2019-06
2019-05
2019-04
2019-03
2019-02
2019-01
2018-12
2018-11
2018-10
pm25
33
50
42
43
54
79
62
47
41
29
22
25
36
36
50
56
102
74
52
44
co
714
695
792
707
1
1
887
932
806
746
723
756
757
886
935
973
1
949
801
730
no2
23
39
26
14
28
56
48
41
34
22
18
21
30
32
42
23
43
38
40
45
o3
131
148
91
86
58
65
116
126
186
180
147
148
139
119
92
52
48
36
74
99
pm10
51
66
48
39
48
84
85
71
75
52
40
40
70
54
69
51
87
62
64
68
so2
7.8
8
7.8
7.6
6.2
10
11
9.3
10
7.5
6.2
5.5
5.4
8.5
11
6.7
7.8
8.8
9.7
10
* Pollution data source:
https://openaq.org
(ChinaAQIData)
The data is licensed under CC-By 4.0
PM10 179 (Very bad Hazardous)
PM2,5 35 (Unhealthy for Sensitive Groups)
O3 0 (Good)
NO2 0 (Good)
SO2 0 (Good)
Data on air pollution from recent days in Yangziba
| index | 2022-05-27 |
|---|---|
| pm10 | 56 Unhealthy for Sensitive Groups |
| pm25 | 56 Unhealthy |
| o3 | 0 Good |
| no2 | 0 Good |
| so2 | 0 Good |

| index | 2020-05 | 2020-04 | 2020-03 | 2020-02 | 2020-01 | 2019-12 | 2019-11 | 2019-10 | 2019-09 | 2019-08 | 2019-07 | 2019-06 | 2019-05 | 2019-04 | 2019-03 | 2019-02 | 2019-01 | 2018-12 | 2018-11 | 2018-10 |
|---|---|---|---|---|---|---|---|---|---|---|---|---|---|---|---|---|---|---|---|---|
| pm25 | 33 (Moderate) | 50 (Unhealthy for Sensitive Groups) | 42 (Unhealthy for Sensitive Groups) | 43 (Unhealthy for Sensitive Groups) | 54 (Unhealthy for Sensitive Groups) | 79 (Very Unhealthy) | 62 (Unhealthy) | 47 (Unhealthy for Sensitive Groups) | 41 (Unhealthy for Sensitive Groups) | 29 (Moderate) | 22 (Moderate) | 25 (Moderate) | 36 (Unhealthy for Sensitive Groups) | 36 (Unhealthy for Sensitive Groups) | 50 (Unhealthy for Sensitive Groups) | 56 (Unhealthy) | 102 (Very Unhealthy) | 74 (Unhealthy) | 52 (Unhealthy for Sensitive Groups) | 44 (Unhealthy for Sensitive Groups) |
| co | 714 (Good) | 695 (Good) | 792 (Good) | 707 (Good) | 1 (Good) | 1 (Good) | 887 (Good) | 932 (Good) | 806 (Good) | 746 (Good) | 723 (Good) | 756 (Good) | 757 (Good) | 886 (Good) | 935 (Good) | 973 (Good) | 1 (Good) | 949 (Good) | 801 (Good) | 730 (Good) |
| no2 | 23 (Good) | 39 (Good) | 26 (Good) | 14 (Good) | 28 (Good) | 56 (Moderate) | 48 (Moderate) | 41 (Moderate) | 34 (Good) | 22 (Good) | 18 (Good) | 21 (Good) | 30 (Good) | 32 (Good) | 42 (Moderate) | 23 (Good) | 43 (Moderate) | 38 (Good) | 40 (Moderate) | 45 (Moderate) |
| o3 | 131 (Unhealthy for Sensitive Groups) | 148 (Unhealthy for Sensitive Groups) | 91 (Moderate) | 86 (Moderate) | 58 (Good) | 65 (Good) | 116 (Moderate) | 126 (Unhealthy for Sensitive Groups) | 186 (Very Unhealthy) | 180 (Very Unhealthy) | 147 (Unhealthy for Sensitive Groups) | 148 (Unhealthy for Sensitive Groups) | 139 (Unhealthy for Sensitive Groups) | 119 (Moderate) | 92 (Moderate) | 52 (Good) | 48 (Good) | 36 (Good) | 74 (Moderate) | 99 (Moderate) |
| pm10 | 51 (Unhealthy for Sensitive Groups) | 66 (Unhealthy for Sensitive Groups) | 48 (Moderate) | 39 (Moderate) | 48 (Moderate) | 84 (Unhealthy) | 85 (Unhealthy) | 71 (Unhealthy for Sensitive Groups) | 75 (Unhealthy for Sensitive Groups) | 52 (Unhealthy for Sensitive Groups) | 40 (Moderate) | 40 (Moderate) | 70 (Unhealthy for Sensitive Groups) | 54 (Unhealthy for Sensitive Groups) | 69 (Unhealthy for Sensitive Groups) | 51 (Unhealthy for Sensitive Groups) | 87 (Unhealthy) | 62 (Unhealthy for Sensitive Groups) | 64 (Unhealthy for Sensitive Groups) | 68 (Unhealthy for Sensitive Groups) |
| so2 | 7.8 (Good) | 8 (Good) | 7.8 (Good) | 7.6 (Good) | 6.2 (Good) | 10 (Good) | 11 (Good) | 9.3 (Good) | 10 (Good) | 7.5 (Good) | 6.2 (Good) | 5.5 (Good) | 5.4 (Good) | 8.5 (Good) | 11 (Good) | 6.7 (Good) | 7.8 (Good) | 8.8 (Good) | 9.7 (Good) | 10 (Good) |
PM10 179 (Very bad Hazardous)
particulate matter (PM10) suspended dustPM2,5 35 (Unhealthy for Sensitive Groups)
particulate matter (PM2.5) dustO3 0.04 (Good)
ozone (O3)NO2 0 (Good)
nitrogen dioxide (NO2)SO2 0 (Good)
sulfur dioxide (SO2)马坡岭
| index | 2022-05-27 |
|---|---|
| pm10 | 56 |
| pm25 | 56 |
| o3 | 0.03 |
| no2 | 0 |
| so2 | 0 |
马坡岭

| index | 2020-05 | 2020-04 | 2020-03 | 2020-02 | 2020-01 | 2019-12 | 2019-11 | 2019-10 | 2019-09 | 2019-08 | 2019-07 | 2019-06 | 2019-05 | 2019-04 | 2019-03 | 2019-02 | 2019-01 | 2018-12 | 2018-11 | 2018-10 |
|---|---|---|---|---|---|---|---|---|---|---|---|---|---|---|---|---|---|---|---|---|
| pm25 | 33 | 50 | 42 | 43 | 54 | 79 | 62 | 47 | 41 | 29 | 22 | 25 | 36 | 36 | 50 | 56 | 102 | 74 | 52 | 44 |
| co | 714 | 695 | 792 | 707 | 1 | 1 | 887 | 932 | 806 | 746 | 723 | 756 | 757 | 886 | 935 | 973 | 1 | 949 | 801 | 730 |
| no2 | 23 | 39 | 26 | 14 | 28 | 56 | 48 | 41 | 34 | 22 | 18 | 21 | 30 | 32 | 42 | 23 | 43 | 38 | 40 | 45 |
| o3 | 131 | 148 | 91 | 86 | 58 | 65 | 116 | 126 | 186 | 180 | 147 | 148 | 139 | 119 | 92 | 52 | 48 | 36 | 74 | 99 |
| pm10 | 51 | 66 | 48 | 39 | 48 | 84 | 85 | 71 | 75 | 52 | 40 | 40 | 70 | 54 | 69 | 51 | 87 | 62 | 64 | 68 |
| so2 | 7.8 | 8 | 7.8 | 7.6 | 6.2 | 10 | 11 | 9.3 | 10 | 7.5 | 6.2 | 5.5 | 5.4 | 8.5 | 11 | 6.7 | 7.8 | 8.8 | 9.7 | 10 |