Air Pollution in Xiaojiatang: Real-time Air Quality Index and smog alert.
Pollution and air quality forecast for Xiaojiatang. Today is Tuesday, June 16, 2026. The following air pollution values have been recorded for Xiaojiatang:- particulate matter (PM10) suspended dust - 179 (Very bad Hazardous)
- particulate matter (PM2.5) dust - 35 (Unhealthy for Sensitive Groups)
- ozone (O3) - 0 (Good)
- nitrogen dioxide (NO2) - 0 (Good)
- sulfur dioxide (SO2) - 0 (Good)

What is the air quality in Xiaojiatang today? Is the air polluted in Xiaojiatang?. Is there smog?
What is the level of PM10 today in Xiaojiatang? (particulate matter (PM10) suspended dust)
The current level of particulate matter PM10 in Xiaojiatang is:
179 (Very bad Hazardous)
The highest PM10 values usually occur in month: 75 (January 2019).
The lowest value of particulate matter PM10 pollution in Xiaojiatang is usually recorded in: June (33).
What is the current level of PM2.5 in Xiaojiatang? (particulate matter (PM2.5) dust)
Today's PM2.5 level is:
35 (Unhealthy for Sensitive Groups)
For comparison, the highest level of PM2.5 in Xiaojiatang in the last 7 days was: 56 (Friday, May 27, 2022) and the lowest: 56 (Friday, May 27, 2022).
The highest PM2.5 values were recorded: 90 (January 2019).
The lowest level of particulate matter PM2.5 pollution occurs in month: July (23).
How is the O3 level today in Xiaojiatang? (ozone (O3))
0 (Good)
How high is the level of NO2? (nitrogen dioxide (NO2))
0 (Good)
What is the level of SO2 pollution? (sulfur dioxide (SO2))
0 (Good)
Current data Friday, May 27, 2022, 12:00 PM
PM10 179 (Very bad Hazardous)
PM2,5 35 (Unhealthy for Sensitive Groups)
O3 0 (Good)
NO2 0 (Good)
SO2 0 (Good)
Data on air pollution from recent days in Xiaojiatang
index
2022-05-27
pm10
56
Unhealthy for Sensitive Groups
pm25
56
Unhealthy
o3
0
Good
no2
0
Good
so2
0
Good
data source »
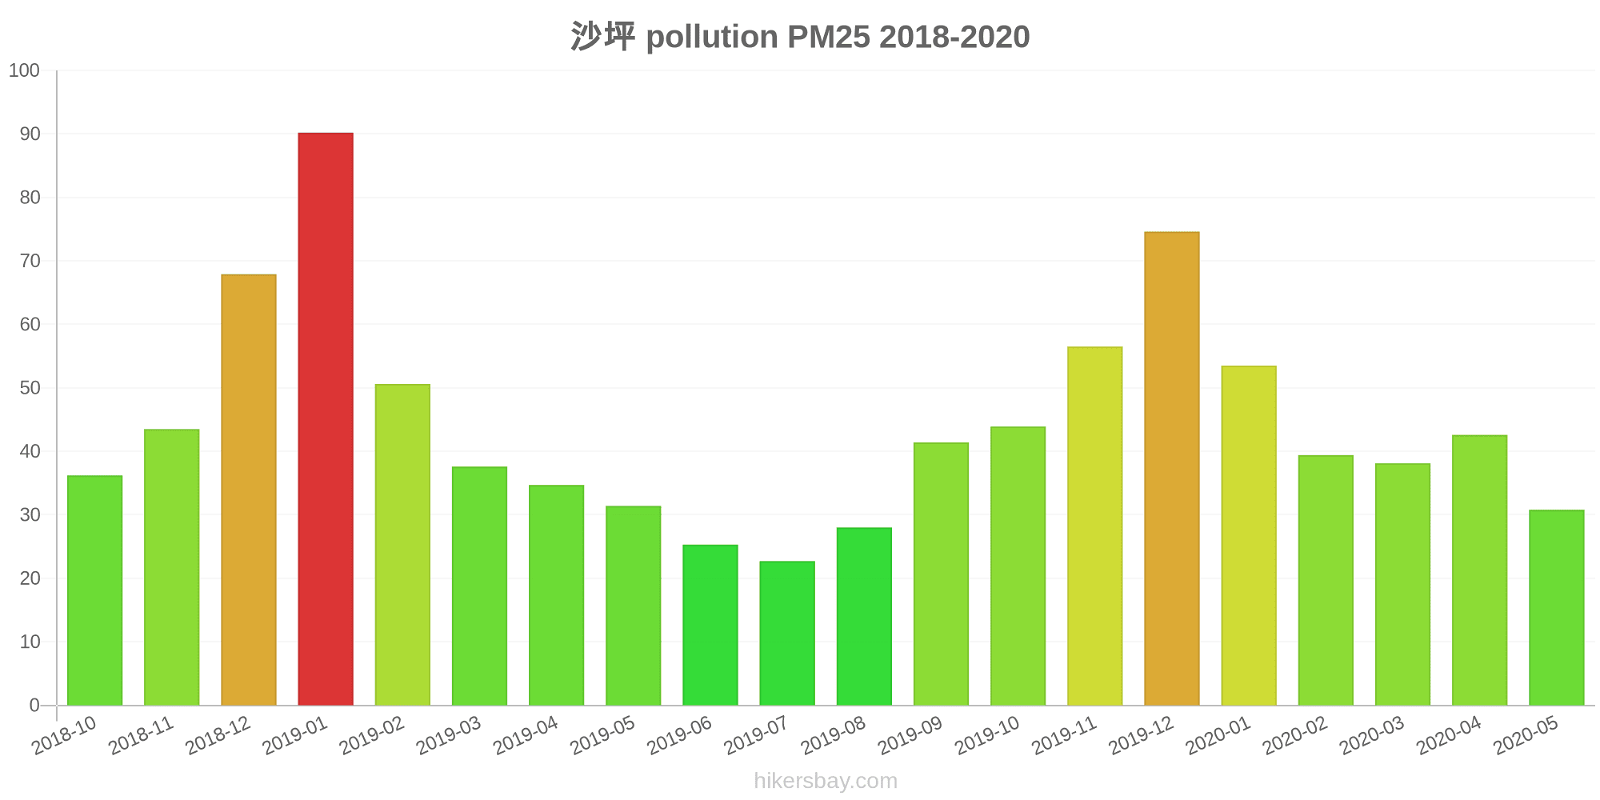
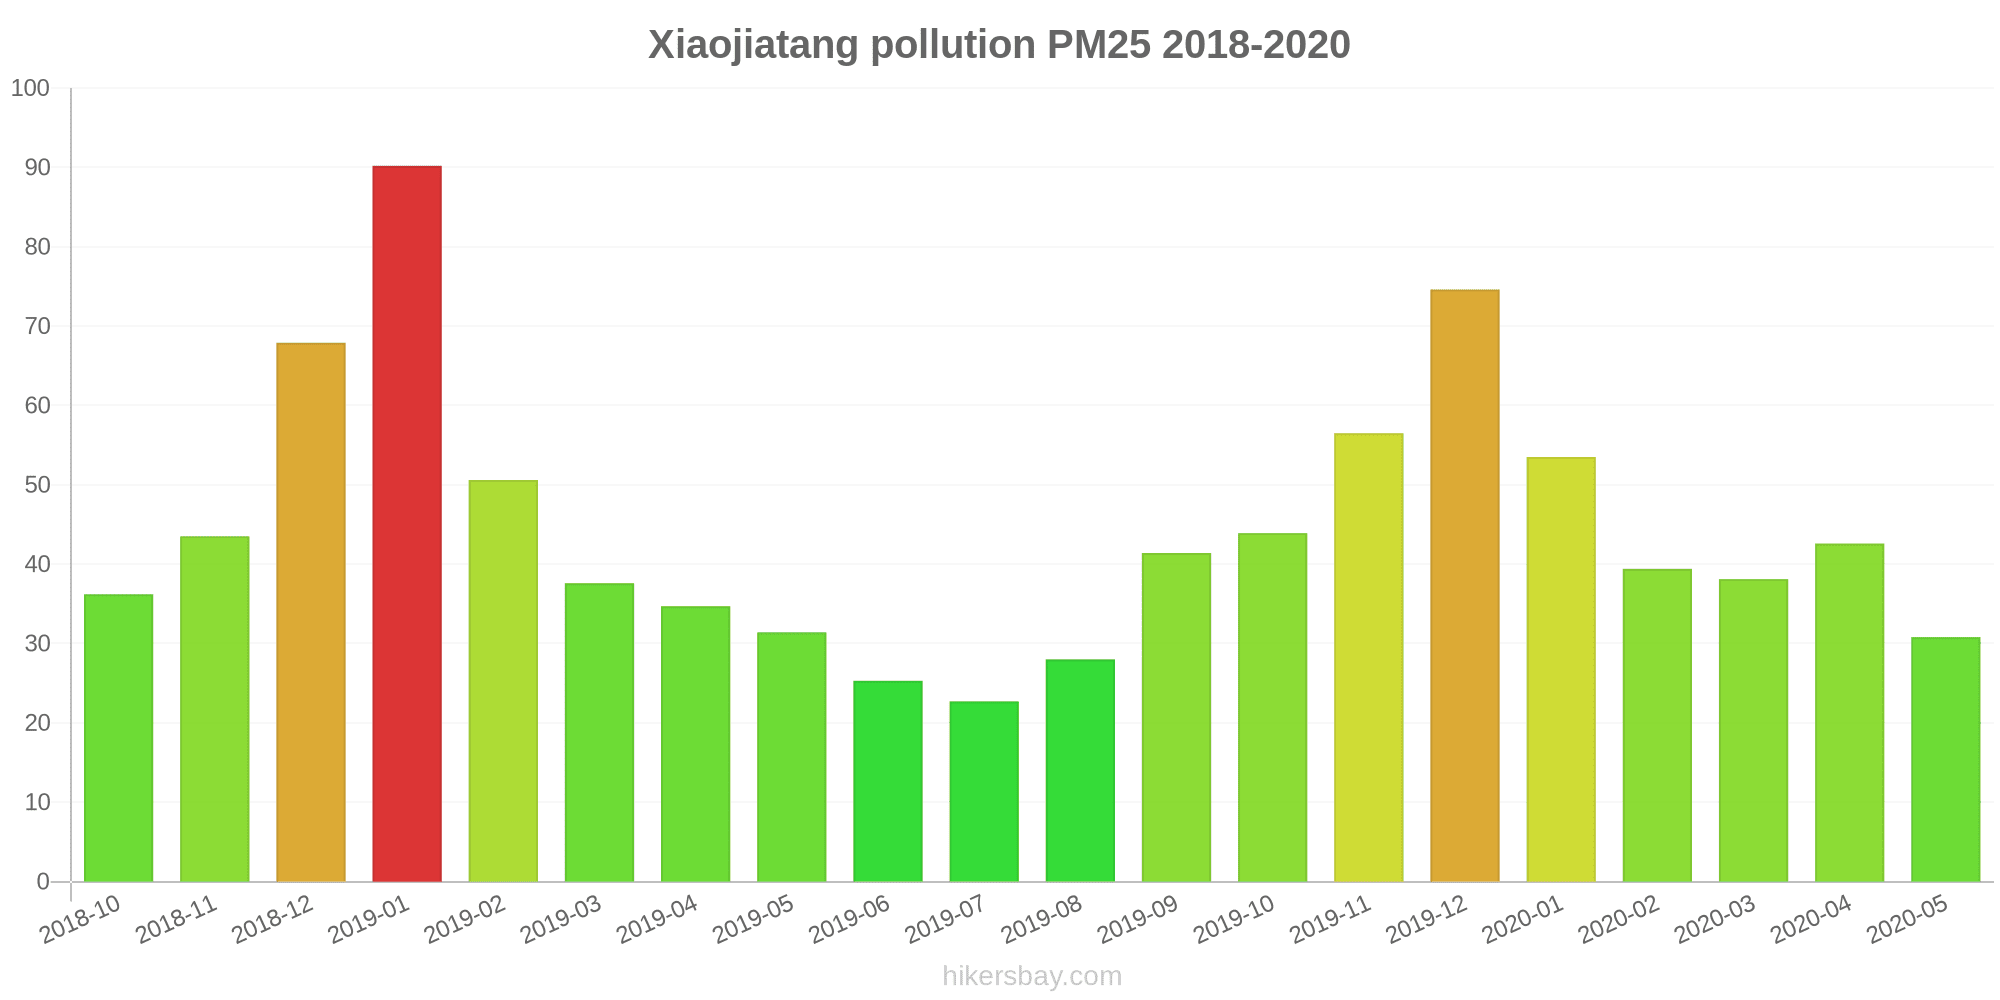
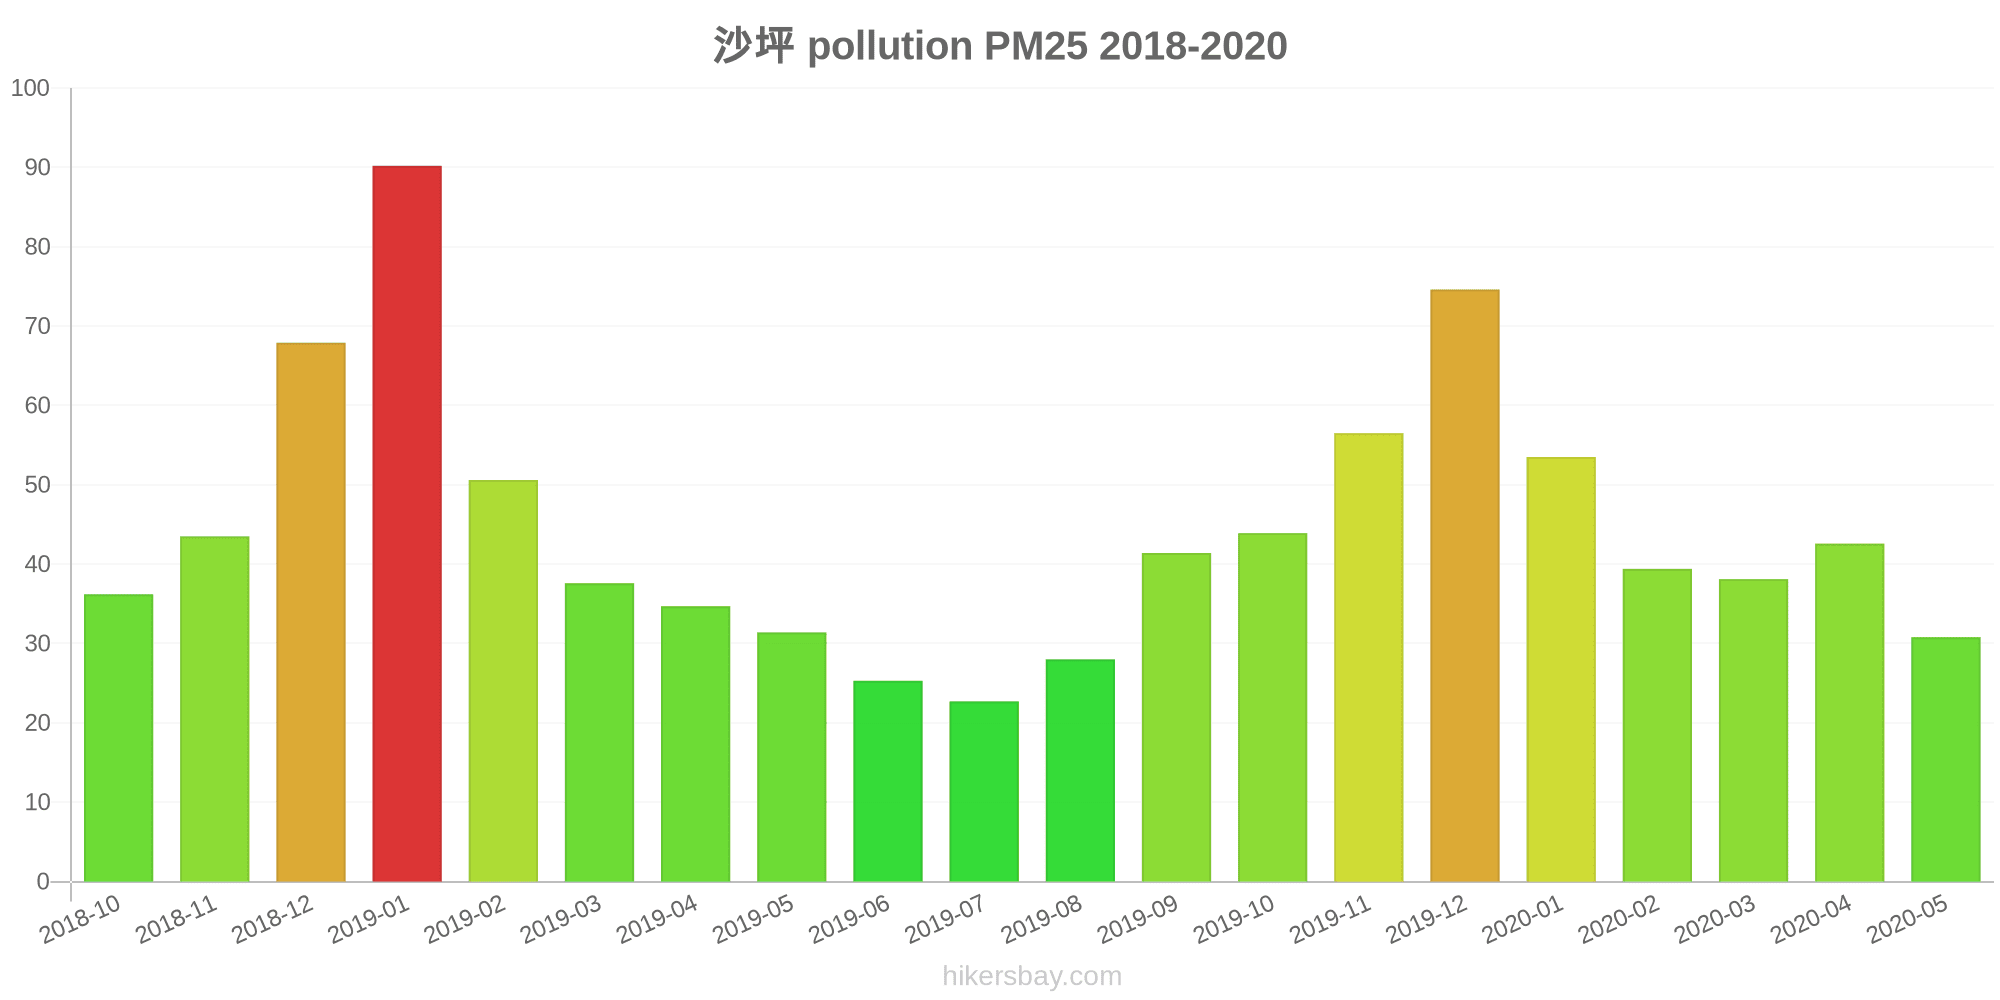
Air pollution in Xiaojiatang from October 2018 to May 2020

index
2020-05
2020-04
2020-03
2020-02
2020-01
2019-12
2019-11
2019-10
2019-09
2019-08
2019-07
2019-06
2019-05
2019-04
2019-03
2019-02
2019-01
2018-12
2018-11
2018-10
pm25
31 (Moderate)
43 (Unhealthy for Sensitive Groups)
38 (Unhealthy for Sensitive Groups)
39 (Unhealthy for Sensitive Groups)
54 (Unhealthy for Sensitive Groups)
75 (Unhealthy)
57 (Unhealthy)
44 (Unhealthy for Sensitive Groups)
41 (Unhealthy for Sensitive Groups)
28 (Moderate)
23 (Moderate)
25 (Moderate)
31 (Moderate)
35 (Moderate)
38 (Unhealthy for Sensitive Groups)
51 (Unhealthy for Sensitive Groups)
90 (Very Unhealthy)
68 (Unhealthy)
44 (Unhealthy for Sensitive Groups)
36 (Unhealthy for Sensitive Groups)
co
812 (Good)
704 (Good)
793 (Good)
886 (Good)
961 (Good)
1 (Good)
893 (Good)
922 (Good)
873 (Good)
813 (Good)
826 (Good)
666 (Good)
835 (Good)
825 (Good)
941 (Good)
1 (Good)
1 (Good)
946 (Good)
703 (Good)
649 (Good)
no2
22 (Good)
28 (Good)
23 (Good)
16 (Good)
25 (Good)
40 (Moderate)
30 (Good)
23 (Good)
19 (Good)
12 (Good)
12 (Good)
11 (Good)
13 (Good)
16 (Good)
21 (Good)
16 (Good)
30 (Good)
29 (Good)
22 (Good)
22 (Good)
o3
120 (Unhealthy for Sensitive Groups)
139 (Unhealthy for Sensitive Groups)
90 (Moderate)
80 (Moderate)
60 (Good)
71 (Moderate)
110 (Moderate)
124 (Unhealthy for Sensitive Groups)
185 (Very Unhealthy)
163 (Unhealthy)
133 (Unhealthy for Sensitive Groups)
138 (Unhealthy for Sensitive Groups)
134 (Unhealthy for Sensitive Groups)
118 (Moderate)
111 (Moderate)
65 (Good)
58 (Good)
47 (Good)
86 (Moderate)
112 (Moderate)
pm10
46 (Moderate)
51 (Unhealthy for Sensitive Groups)
43 (Moderate)
36 (Moderate)
42 (Moderate)
65 (Unhealthy for Sensitive Groups)
68 (Unhealthy for Sensitive Groups)
51 (Unhealthy for Sensitive Groups)
57 (Unhealthy for Sensitive Groups)
39 (Moderate)
33 (Moderate)
33 (Moderate)
56 (Unhealthy for Sensitive Groups)
45 (Moderate)
49 (Moderate)
48 (Moderate)
75 (Unhealthy for Sensitive Groups)
55 (Unhealthy for Sensitive Groups)
47 (Moderate)
50 (Unhealthy for Sensitive Groups)
so2
9.6 (Good)
9.7 (Good)
7.3 (Good)
5.7 (Good)
4.9 (Good)
10 (Good)
11 (Good)
8.6 (Good)
9.8 (Good)
6.6 (Good)
5.1 (Good)
5.2 (Good)
5.7 (Good)
6.4 (Good)
5.7 (Good)
4.2 (Good)
5 (Good)
6.2 (Good)
8.1 (Good)
8.9 (Good)
data source »
沙坪
Friday, May 27, 2022, 12:00 PM
PM10 179 (Very bad Hazardous)
particulate matter (PM10) suspended dust
PM2,5 35 (Unhealthy for Sensitive Groups)
particulate matter (PM2.5) dust
O3 0.04 (Good)
ozone (O3)
NO2 0 (Good)
nitrogen dioxide (NO2)
SO2 0 (Good)
sulfur dioxide (SO2)
沙坪
index
2022-05-27
pm10
56
pm25
56
o3
0.03
no2
0
so2
0
沙坪
2018-10 2020-05
index
2020-05
2020-04
2020-03
2020-02
2020-01
2019-12
2019-11
2019-10
2019-09
2019-08
2019-07
2019-06
2019-05
2019-04
2019-03
2019-02
2019-01
2018-12
2018-11
2018-10
pm25
31
43
38
39
54
75
57
44
41
28
23
25
31
35
38
51
90
68
44
36
co
812
704
793
886
961
1
893
922
873
813
826
666
835
825
941
1
1
946
703
649
no2
22
28
23
16
25
40
30
23
19
12
12
11
13
16
21
16
30
29
22
22
o3
120
139
90
80
60
71
110
124
185
163
133
138
134
118
111
65
58
47
86
112
pm10
46
51
43
36
42
65
68
51
57
39
33
33
56
45
49
48
75
55
47
50
so2
9.6
9.7
7.3
5.7
4.9
10
11
8.6
9.8
6.6
5.1
5.2
5.7
6.4
5.7
4.2
5
6.2
8.1
8.9
* Pollution data source:
https://openaq.org
(ChinaAQIData)
The data is licensed under CC-By 4.0
PM10 179 (Very bad Hazardous)
PM2,5 35 (Unhealthy for Sensitive Groups)
O3 0 (Good)
NO2 0 (Good)
SO2 0 (Good)
Data on air pollution from recent days in Xiaojiatang
| index | 2022-05-27 |
|---|---|
| pm10 | 56 Unhealthy for Sensitive Groups |
| pm25 | 56 Unhealthy |
| o3 | 0 Good |
| no2 | 0 Good |
| so2 | 0 Good |
| index | 2020-05 | 2020-04 | 2020-03 | 2020-02 | 2020-01 | 2019-12 | 2019-11 | 2019-10 | 2019-09 | 2019-08 | 2019-07 | 2019-06 | 2019-05 | 2019-04 | 2019-03 | 2019-02 | 2019-01 | 2018-12 | 2018-11 | 2018-10 |
|---|---|---|---|---|---|---|---|---|---|---|---|---|---|---|---|---|---|---|---|---|
| pm25 | 31 (Moderate) | 43 (Unhealthy for Sensitive Groups) | 38 (Unhealthy for Sensitive Groups) | 39 (Unhealthy for Sensitive Groups) | 54 (Unhealthy for Sensitive Groups) | 75 (Unhealthy) | 57 (Unhealthy) | 44 (Unhealthy for Sensitive Groups) | 41 (Unhealthy for Sensitive Groups) | 28 (Moderate) | 23 (Moderate) | 25 (Moderate) | 31 (Moderate) | 35 (Moderate) | 38 (Unhealthy for Sensitive Groups) | 51 (Unhealthy for Sensitive Groups) | 90 (Very Unhealthy) | 68 (Unhealthy) | 44 (Unhealthy for Sensitive Groups) | 36 (Unhealthy for Sensitive Groups) |
| co | 812 (Good) | 704 (Good) | 793 (Good) | 886 (Good) | 961 (Good) | 1 (Good) | 893 (Good) | 922 (Good) | 873 (Good) | 813 (Good) | 826 (Good) | 666 (Good) | 835 (Good) | 825 (Good) | 941 (Good) | 1 (Good) | 1 (Good) | 946 (Good) | 703 (Good) | 649 (Good) |
| no2 | 22 (Good) | 28 (Good) | 23 (Good) | 16 (Good) | 25 (Good) | 40 (Moderate) | 30 (Good) | 23 (Good) | 19 (Good) | 12 (Good) | 12 (Good) | 11 (Good) | 13 (Good) | 16 (Good) | 21 (Good) | 16 (Good) | 30 (Good) | 29 (Good) | 22 (Good) | 22 (Good) |
| o3 | 120 (Unhealthy for Sensitive Groups) | 139 (Unhealthy for Sensitive Groups) | 90 (Moderate) | 80 (Moderate) | 60 (Good) | 71 (Moderate) | 110 (Moderate) | 124 (Unhealthy for Sensitive Groups) | 185 (Very Unhealthy) | 163 (Unhealthy) | 133 (Unhealthy for Sensitive Groups) | 138 (Unhealthy for Sensitive Groups) | 134 (Unhealthy for Sensitive Groups) | 118 (Moderate) | 111 (Moderate) | 65 (Good) | 58 (Good) | 47 (Good) | 86 (Moderate) | 112 (Moderate) |
| pm10 | 46 (Moderate) | 51 (Unhealthy for Sensitive Groups) | 43 (Moderate) | 36 (Moderate) | 42 (Moderate) | 65 (Unhealthy for Sensitive Groups) | 68 (Unhealthy for Sensitive Groups) | 51 (Unhealthy for Sensitive Groups) | 57 (Unhealthy for Sensitive Groups) | 39 (Moderate) | 33 (Moderate) | 33 (Moderate) | 56 (Unhealthy for Sensitive Groups) | 45 (Moderate) | 49 (Moderate) | 48 (Moderate) | 75 (Unhealthy for Sensitive Groups) | 55 (Unhealthy for Sensitive Groups) | 47 (Moderate) | 50 (Unhealthy for Sensitive Groups) |
| so2 | 9.6 (Good) | 9.7 (Good) | 7.3 (Good) | 5.7 (Good) | 4.9 (Good) | 10 (Good) | 11 (Good) | 8.6 (Good) | 9.8 (Good) | 6.6 (Good) | 5.1 (Good) | 5.2 (Good) | 5.7 (Good) | 6.4 (Good) | 5.7 (Good) | 4.2 (Good) | 5 (Good) | 6.2 (Good) | 8.1 (Good) | 8.9 (Good) |
PM10 179 (Very bad Hazardous)
particulate matter (PM10) suspended dustPM2,5 35 (Unhealthy for Sensitive Groups)
particulate matter (PM2.5) dustO3 0.04 (Good)
ozone (O3)NO2 0 (Good)
nitrogen dioxide (NO2)SO2 0 (Good)
sulfur dioxide (SO2)沙坪
| index | 2022-05-27 |
|---|---|
| pm10 | 56 |
| pm25 | 56 |
| o3 | 0.03 |
| no2 | 0 |
| so2 | 0 |
沙坪
| index | 2020-05 | 2020-04 | 2020-03 | 2020-02 | 2020-01 | 2019-12 | 2019-11 | 2019-10 | 2019-09 | 2019-08 | 2019-07 | 2019-06 | 2019-05 | 2019-04 | 2019-03 | 2019-02 | 2019-01 | 2018-12 | 2018-11 | 2018-10 |
|---|---|---|---|---|---|---|---|---|---|---|---|---|---|---|---|---|---|---|---|---|
| pm25 | 31 | 43 | 38 | 39 | 54 | 75 | 57 | 44 | 41 | 28 | 23 | 25 | 31 | 35 | 38 | 51 | 90 | 68 | 44 | 36 |
| co | 812 | 704 | 793 | 886 | 961 | 1 | 893 | 922 | 873 | 813 | 826 | 666 | 835 | 825 | 941 | 1 | 1 | 946 | 703 | 649 |
| no2 | 22 | 28 | 23 | 16 | 25 | 40 | 30 | 23 | 19 | 12 | 12 | 11 | 13 | 16 | 21 | 16 | 30 | 29 | 22 | 22 |
| o3 | 120 | 139 | 90 | 80 | 60 | 71 | 110 | 124 | 185 | 163 | 133 | 138 | 134 | 118 | 111 | 65 | 58 | 47 | 86 | 112 |
| pm10 | 46 | 51 | 43 | 36 | 42 | 65 | 68 | 51 | 57 | 39 | 33 | 33 | 56 | 45 | 49 | 48 | 75 | 55 | 47 | 50 |
| so2 | 9.6 | 9.7 | 7.3 | 5.7 | 4.9 | 10 | 11 | 8.6 | 9.8 | 6.6 | 5.1 | 5.2 | 5.7 | 6.4 | 5.7 | 4.2 | 5 | 6.2 | 8.1 | 8.9 |