Air Pollution in Wangjiawan: Real-time Air Quality Index and smog alert.
Pollution and air quality forecast for Wangjiawan. Today is Tuesday, June 16, 2026. The following air pollution values have been recorded for Wangjiawan:- particulate matter (PM10) suspended dust - 179 (Very bad Hazardous)
- particulate matter (PM2.5) dust - 35 (Unhealthy for Sensitive Groups)
- ozone (O3) - 0 (Good)
- nitrogen dioxide (NO2) - 0 (Good)
- sulfur dioxide (SO2) - 0 (Good)

What is the air quality in Wangjiawan today? Is the air polluted in Wangjiawan?. Is there smog?
What is the level of PM10 today in Wangjiawan? (particulate matter (PM10) suspended dust)
The current level of particulate matter PM10 in Wangjiawan is:
179 (Very bad Hazardous)
The highest PM10 values usually occur in month: 157 (January 2019).
The lowest value of particulate matter PM10 pollution in Wangjiawan is usually recorded in: June (34).
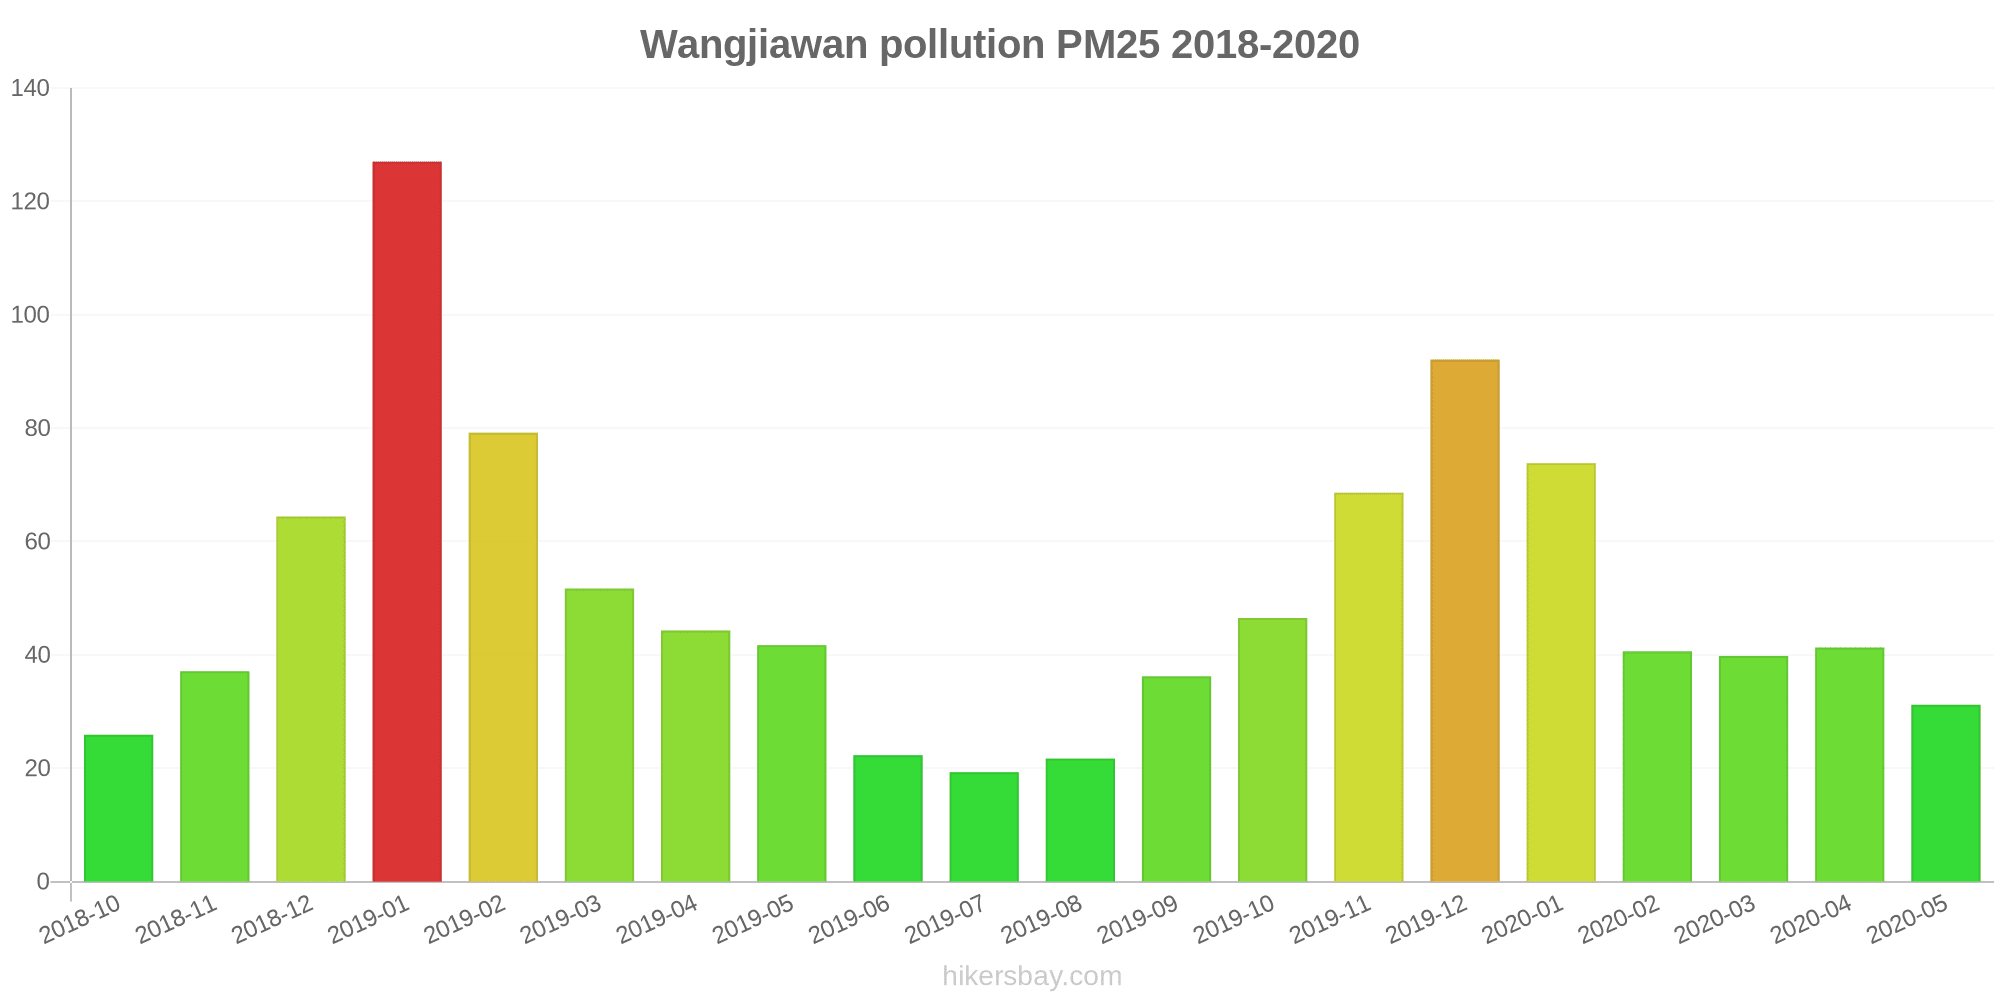
What is the current level of PM2.5 in Wangjiawan? (particulate matter (PM2.5) dust)
Today's PM2.5 level is:
35 (Unhealthy for Sensitive Groups)
For comparison, the highest level of PM2.5 in Wangjiawan in the last 7 days was: 56 (Friday, May 27, 2022) and the lowest: 56 (Friday, May 27, 2022).
The highest PM2.5 values were recorded: 127 (January 2019).
The lowest level of particulate matter PM2.5 pollution occurs in month: July (19).
How is the O3 level today in Wangjiawan? (ozone (O3))
0 (Good)
How high is the level of NO2? (nitrogen dioxide (NO2))
0 (Good)
What is the level of SO2 pollution? (sulfur dioxide (SO2))
0 (Good)
Current data Friday, May 27, 2022, 12:00 PM
PM10 179 (Very bad Hazardous)
PM2,5 35 (Unhealthy for Sensitive Groups)
O3 0 (Good)
NO2 0 (Good)
SO2 0 (Good)
Data on air pollution from recent days in Wangjiawan
index
2022-05-27
pm10
56
Unhealthy for Sensitive Groups
pm25
56
Unhealthy
o3
0
Good
no2
0
Good
so2
0
Good
data source »
Air pollution in Wangjiawan from October 2018 to May 2020

index
2020-05
2020-04
2020-03
2020-02
2020-01
2019-12
2019-11
2019-10
2019-09
2019-08
2019-07
2019-06
2019-05
2019-04
2019-03
2019-02
2019-01
2018-12
2018-11
2018-10
pm25
31 (Moderate)
41 (Unhealthy for Sensitive Groups)
40 (Unhealthy for Sensitive Groups)
41 (Unhealthy for Sensitive Groups)
74 (Unhealthy)
92 (Very Unhealthy)
69 (Unhealthy)
47 (Unhealthy for Sensitive Groups)
36 (Unhealthy for Sensitive Groups)
22 (Moderate)
19 (Moderate)
22 (Moderate)
42 (Unhealthy for Sensitive Groups)
44 (Unhealthy for Sensitive Groups)
52 (Unhealthy for Sensitive Groups)
79 (Very Unhealthy)
127 (Very bad Hazardous)
64 (Unhealthy)
37 (Unhealthy for Sensitive Groups)
26 (Moderate)
co
1 (Good)
1 (Good)
1 (Good)
1 (Good)
1 (Good)
1 (Good)
1 (Good)
1 (Good)
1 (Good)
1 (Good)
859 (Good)
991 (Good)
881 (Good)
1 (Good)
1 (Good)
1 (Good)
1 (Good)
1 (Good)
1 (Good)
1 (Good)
no2
15 (Good)
23 (Good)
21 (Good)
14 (Good)
26 (Good)
40 (Good)
29 (Good)
27 (Good)
20 (Good)
12 (Good)
14 (Good)
15 (Good)
24 (Good)
26 (Good)
32 (Good)
27 (Good)
39 (Good)
33 (Good)
33 (Good)
28 (Good)
o3
105 (Moderate)
123 (Unhealthy for Sensitive Groups)
81 (Moderate)
73 (Moderate)
60 (Good)
73 (Moderate)
98 (Moderate)
107 (Moderate)
161 (Unhealthy)
133 (Unhealthy for Sensitive Groups)
121 (Unhealthy for Sensitive Groups)
122 (Unhealthy for Sensitive Groups)
121 (Unhealthy for Sensitive Groups)
106 (Moderate)
104 (Moderate)
64 (Good)
61 (Good)
55 (Good)
83 (Moderate)
101 (Moderate)
pm10
51 (Unhealthy for Sensitive Groups)
58 (Unhealthy for Sensitive Groups)
58 (Unhealthy for Sensitive Groups)
50 (Moderate)
85 (Unhealthy)
114 (Very Unhealthy)
97 (Unhealthy)
70 (Unhealthy for Sensitive Groups)
63 (Unhealthy for Sensitive Groups)
48 (Moderate)
38 (Moderate)
34 (Moderate)
72 (Unhealthy for Sensitive Groups)
66 (Unhealthy for Sensitive Groups)
77 (Unhealthy for Sensitive Groups)
98 (Unhealthy)
157 (Very bad Hazardous)
105 (Unhealthy)
77 (Unhealthy for Sensitive Groups)
67 (Unhealthy for Sensitive Groups)
so2
4 (Good)
6.3 (Good)
3.7 (Good)
1.7 (Good)
3 (Good)
7.3 (Good)
10 (Good)
8.8 (Good)
6.9 (Good)
5.5 (Good)
10 (Good)
6.3 (Good)
5.5 (Good)
6.7 (Good)
5.5 (Good)
2.3 (Good)
6.3 (Good)
6.6 (Good)
10 (Good)
18 (Good)
data source »
赫山环保分局
Friday, May 27, 2022, 12:00 PM
PM10 179 (Very bad Hazardous)
particulate matter (PM10) suspended dust
PM2,5 35 (Unhealthy for Sensitive Groups)
particulate matter (PM2.5) dust
O3 0.04 (Good)
ozone (O3)
NO2 0 (Good)
nitrogen dioxide (NO2)
SO2 0 (Good)
sulfur dioxide (SO2)
赫山环保分局
index
2022-05-27
pm10
56
pm25
56
o3
0.03
no2
0
so2
0
赫山环保分局
2018-10 2020-05

index
2020-05
2020-04
2020-03
2020-02
2020-01
2019-12
2019-11
2019-10
2019-09
2019-08
2019-07
2019-06
2019-05
2019-04
2019-03
2019-02
2019-01
2018-12
2018-11
2018-10
pm25
31
41
40
41
74
92
69
47
36
22
19
22
42
44
52
79
127
64
37
26
co
1
1
1
1
1
1
1
1
1
1
859
991
881
1
1
1
1
1
1
1
no2
15
23
21
14
26
40
29
27
20
12
14
15
24
26
32
27
39
33
33
28
o3
105
123
81
73
60
73
98
107
161
133
121
122
121
106
104
64
61
55
83
101
pm10
51
58
58
50
85
114
97
70
63
48
38
34
72
66
77
98
157
105
77
67
so2
4
6.3
3.7
1.7
3
7.3
10
8.8
6.9
5.5
10
6.3
5.5
6.7
5.5
2.3
6.3
6.6
10
18
* Pollution data source:
https://openaq.org
(ChinaAQIData)
The data is licensed under CC-By 4.0
PM10 179 (Very bad Hazardous)
PM2,5 35 (Unhealthy for Sensitive Groups)
O3 0 (Good)
NO2 0 (Good)
SO2 0 (Good)
Data on air pollution from recent days in Wangjiawan
| index | 2022-05-27 |
|---|---|
| pm10 | 56 Unhealthy for Sensitive Groups |
| pm25 | 56 Unhealthy |
| o3 | 0 Good |
| no2 | 0 Good |
| so2 | 0 Good |
| index | 2020-05 | 2020-04 | 2020-03 | 2020-02 | 2020-01 | 2019-12 | 2019-11 | 2019-10 | 2019-09 | 2019-08 | 2019-07 | 2019-06 | 2019-05 | 2019-04 | 2019-03 | 2019-02 | 2019-01 | 2018-12 | 2018-11 | 2018-10 |
|---|---|---|---|---|---|---|---|---|---|---|---|---|---|---|---|---|---|---|---|---|
| pm25 | 31 (Moderate) | 41 (Unhealthy for Sensitive Groups) | 40 (Unhealthy for Sensitive Groups) | 41 (Unhealthy for Sensitive Groups) | 74 (Unhealthy) | 92 (Very Unhealthy) | 69 (Unhealthy) | 47 (Unhealthy for Sensitive Groups) | 36 (Unhealthy for Sensitive Groups) | 22 (Moderate) | 19 (Moderate) | 22 (Moderate) | 42 (Unhealthy for Sensitive Groups) | 44 (Unhealthy for Sensitive Groups) | 52 (Unhealthy for Sensitive Groups) | 79 (Very Unhealthy) | 127 (Very bad Hazardous) | 64 (Unhealthy) | 37 (Unhealthy for Sensitive Groups) | 26 (Moderate) |
| co | 1 (Good) | 1 (Good) | 1 (Good) | 1 (Good) | 1 (Good) | 1 (Good) | 1 (Good) | 1 (Good) | 1 (Good) | 1 (Good) | 859 (Good) | 991 (Good) | 881 (Good) | 1 (Good) | 1 (Good) | 1 (Good) | 1 (Good) | 1 (Good) | 1 (Good) | 1 (Good) |
| no2 | 15 (Good) | 23 (Good) | 21 (Good) | 14 (Good) | 26 (Good) | 40 (Good) | 29 (Good) | 27 (Good) | 20 (Good) | 12 (Good) | 14 (Good) | 15 (Good) | 24 (Good) | 26 (Good) | 32 (Good) | 27 (Good) | 39 (Good) | 33 (Good) | 33 (Good) | 28 (Good) |
| o3 | 105 (Moderate) | 123 (Unhealthy for Sensitive Groups) | 81 (Moderate) | 73 (Moderate) | 60 (Good) | 73 (Moderate) | 98 (Moderate) | 107 (Moderate) | 161 (Unhealthy) | 133 (Unhealthy for Sensitive Groups) | 121 (Unhealthy for Sensitive Groups) | 122 (Unhealthy for Sensitive Groups) | 121 (Unhealthy for Sensitive Groups) | 106 (Moderate) | 104 (Moderate) | 64 (Good) | 61 (Good) | 55 (Good) | 83 (Moderate) | 101 (Moderate) |
| pm10 | 51 (Unhealthy for Sensitive Groups) | 58 (Unhealthy for Sensitive Groups) | 58 (Unhealthy for Sensitive Groups) | 50 (Moderate) | 85 (Unhealthy) | 114 (Very Unhealthy) | 97 (Unhealthy) | 70 (Unhealthy for Sensitive Groups) | 63 (Unhealthy for Sensitive Groups) | 48 (Moderate) | 38 (Moderate) | 34 (Moderate) | 72 (Unhealthy for Sensitive Groups) | 66 (Unhealthy for Sensitive Groups) | 77 (Unhealthy for Sensitive Groups) | 98 (Unhealthy) | 157 (Very bad Hazardous) | 105 (Unhealthy) | 77 (Unhealthy for Sensitive Groups) | 67 (Unhealthy for Sensitive Groups) |
| so2 | 4 (Good) | 6.3 (Good) | 3.7 (Good) | 1.7 (Good) | 3 (Good) | 7.3 (Good) | 10 (Good) | 8.8 (Good) | 6.9 (Good) | 5.5 (Good) | 10 (Good) | 6.3 (Good) | 5.5 (Good) | 6.7 (Good) | 5.5 (Good) | 2.3 (Good) | 6.3 (Good) | 6.6 (Good) | 10 (Good) | 18 (Good) |
PM10 179 (Very bad Hazardous)
particulate matter (PM10) suspended dustPM2,5 35 (Unhealthy for Sensitive Groups)
particulate matter (PM2.5) dustO3 0.04 (Good)
ozone (O3)NO2 0 (Good)
nitrogen dioxide (NO2)SO2 0 (Good)
sulfur dioxide (SO2)赫山环保分局
| index | 2022-05-27 |
|---|---|
| pm10 | 56 |
| pm25 | 56 |
| o3 | 0.03 |
| no2 | 0 |
| so2 | 0 |
赫山环保分局

| index | 2020-05 | 2020-04 | 2020-03 | 2020-02 | 2020-01 | 2019-12 | 2019-11 | 2019-10 | 2019-09 | 2019-08 | 2019-07 | 2019-06 | 2019-05 | 2019-04 | 2019-03 | 2019-02 | 2019-01 | 2018-12 | 2018-11 | 2018-10 |
|---|---|---|---|---|---|---|---|---|---|---|---|---|---|---|---|---|---|---|---|---|
| pm25 | 31 | 41 | 40 | 41 | 74 | 92 | 69 | 47 | 36 | 22 | 19 | 22 | 42 | 44 | 52 | 79 | 127 | 64 | 37 | 26 |
| co | 1 | 1 | 1 | 1 | 1 | 1 | 1 | 1 | 1 | 1 | 859 | 991 | 881 | 1 | 1 | 1 | 1 | 1 | 1 | 1 |
| no2 | 15 | 23 | 21 | 14 | 26 | 40 | 29 | 27 | 20 | 12 | 14 | 15 | 24 | 26 | 32 | 27 | 39 | 33 | 33 | 28 |
| o3 | 105 | 123 | 81 | 73 | 60 | 73 | 98 | 107 | 161 | 133 | 121 | 122 | 121 | 106 | 104 | 64 | 61 | 55 | 83 | 101 |
| pm10 | 51 | 58 | 58 | 50 | 85 | 114 | 97 | 70 | 63 | 48 | 38 | 34 | 72 | 66 | 77 | 98 | 157 | 105 | 77 | 67 |
| so2 | 4 | 6.3 | 3.7 | 1.7 | 3 | 7.3 | 10 | 8.8 | 6.9 | 5.5 | 10 | 6.3 | 5.5 | 6.7 | 5.5 | 2.3 | 6.3 | 6.6 | 10 | 18 |