Air Pollution in Huangtengshu: Real-time Air Quality Index and smog alert.
Pollution and air quality forecast for Huangtengshu. Today is Tuesday, June 16, 2026. The following air pollution values have been recorded for Huangtengshu:- particulate matter (PM10) suspended dust - 179 (Very bad Hazardous)
- particulate matter (PM2.5) dust - 35 (Unhealthy for Sensitive Groups)
- ozone (O3) - 0 (Good)
- nitrogen dioxide (NO2) - 0 (Good)
- sulfur dioxide (SO2) - 0 (Good)

What is the air quality in Huangtengshu today? Is the air polluted in Huangtengshu?. Is there smog?
What is the level of PM10 today in Huangtengshu? (particulate matter (PM10) suspended dust)
The current level of particulate matter PM10 in Huangtengshu is:
179 (Very bad Hazardous)
The highest PM10 values usually occur in month: 140 (January 2019).
The lowest value of particulate matter PM10 pollution in Huangtengshu is usually recorded in: June (40).
What is the current level of PM2.5 in Huangtengshu? (particulate matter (PM2.5) dust)
Today's PM2.5 level is:
35 (Unhealthy for Sensitive Groups)
For comparison, the highest level of PM2.5 in Huangtengshu in the last 7 days was: 56 (Friday, May 27, 2022) and the lowest: 56 (Friday, May 27, 2022).
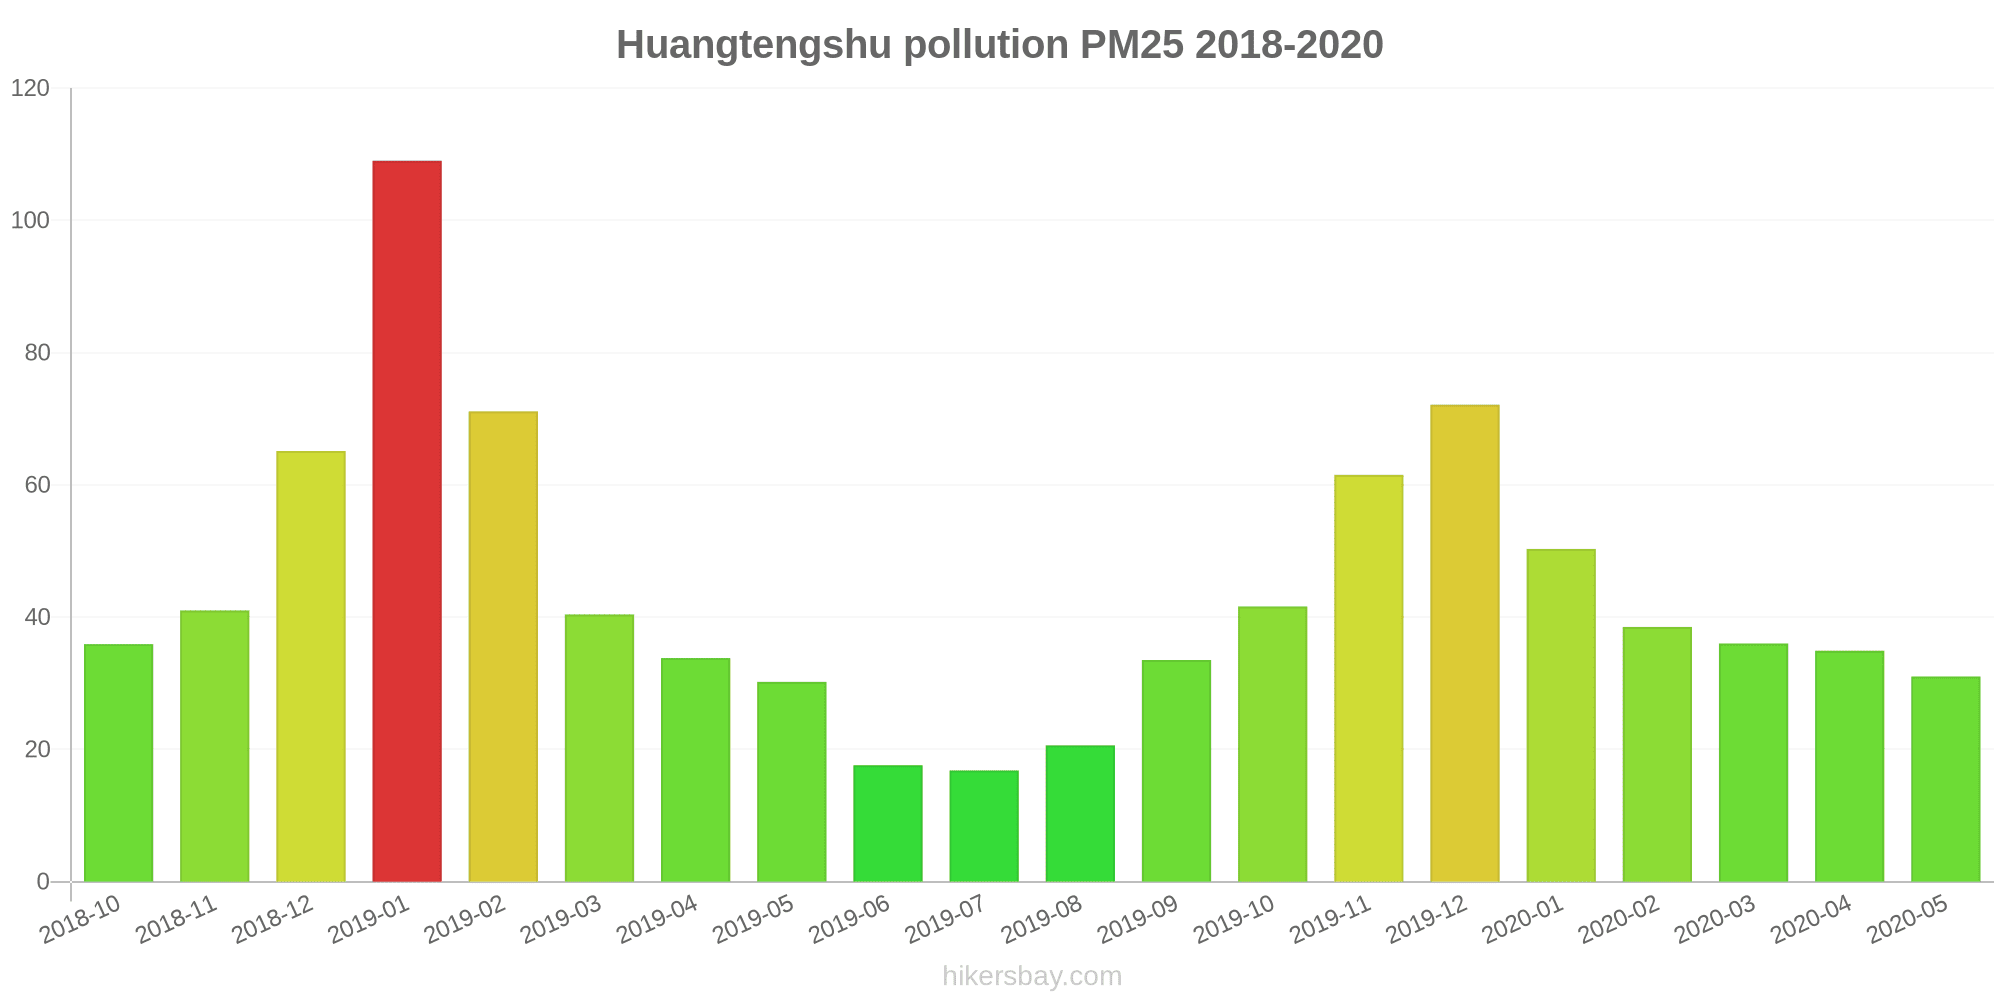
The highest PM2.5 values were recorded: 109 (January 2019).
The lowest level of particulate matter PM2.5 pollution occurs in month: July (17).
How is the O3 level today in Huangtengshu? (ozone (O3))
0 (Good)
How high is the level of NO2? (nitrogen dioxide (NO2))
0 (Good)
What is the level of SO2 pollution? (sulfur dioxide (SO2))
0 (Good)
Current data Friday, May 27, 2022, 12:00 PM
PM10 179 (Very bad Hazardous)
PM2,5 35 (Unhealthy for Sensitive Groups)
O3 0 (Good)
NO2 0 (Good)
SO2 0 (Good)
Data on air pollution from recent days in Huangtengshu
index
2022-05-27
pm10
56
Unhealthy for Sensitive Groups
pm25
56
Unhealthy
o3
0
Good
no2
0
Good
so2
0
Good
data source »
Air pollution in Huangtengshu from October 2018 to May 2020

index
2020-05
2020-04
2020-03
2020-02
2020-01
2019-12
2019-11
2019-10
2019-09
2019-08
2019-07
2019-06
2019-05
2019-04
2019-03
2019-02
2019-01
2018-12
2018-11
2018-10
pm25
31 (Moderate)
35 (Moderate)
36 (Unhealthy for Sensitive Groups)
39 (Unhealthy for Sensitive Groups)
50 (Unhealthy for Sensitive Groups)
72 (Unhealthy)
62 (Unhealthy)
42 (Unhealthy for Sensitive Groups)
34 (Moderate)
21 (Moderate)
17 (Moderate)
18 (Moderate)
30 (Moderate)
34 (Moderate)
40 (Unhealthy for Sensitive Groups)
71 (Unhealthy)
109 (Very Unhealthy)
65 (Unhealthy)
41 (Unhealthy for Sensitive Groups)
36 (Unhealthy for Sensitive Groups)
co
957 (Good)
1 (Good)
1 (Good)
1 (Good)
1 (Good)
1 (Good)
1 (Good)
1 (Good)
1 (Good)
1 (Good)
976 (Good)
1 (Good)
952 (Good)
1 (Good)
1 (Good)
1 (Good)
1 (Good)
1 (Good)
1 (Good)
1 (Good)
no2
11 (Good)
14 (Good)
15 (Good)
9.3 (Good)
14 (Good)
23 (Good)
20 (Good)
16 (Good)
12 (Good)
8.4 (Good)
8.7 (Good)
8.8 (Good)
12 (Good)
10 (Good)
17 (Good)
12 (Good)
20 (Good)
19 (Good)
17 (Good)
19 (Good)
o3
120 (Unhealthy for Sensitive Groups)
144 (Unhealthy for Sensitive Groups)
92 (Moderate)
73 (Moderate)
56 (Good)
80 (Moderate)
115 (Moderate)
124 (Unhealthy for Sensitive Groups)
166 (Unhealthy)
152 (Unhealthy)
118 (Moderate)
132 (Unhealthy for Sensitive Groups)
125 (Unhealthy for Sensitive Groups)
112 (Moderate)
113 (Moderate)
67 (Good)
69 (Good)
59 (Good)
96 (Moderate)
108 (Moderate)
pm10
63 (Unhealthy for Sensitive Groups)
58 (Unhealthy for Sensitive Groups)
63 (Unhealthy for Sensitive Groups)
58 (Unhealthy for Sensitive Groups)
77 (Unhealthy for Sensitive Groups)
103 (Unhealthy)
98 (Unhealthy)
71 (Unhealthy for Sensitive Groups)
64 (Unhealthy for Sensitive Groups)
46 (Moderate)
42 (Moderate)
40 (Moderate)
65 (Unhealthy for Sensitive Groups)
60 (Unhealthy for Sensitive Groups)
71 (Unhealthy for Sensitive Groups)
95 (Unhealthy)
140 (Very Unhealthy)
104 (Unhealthy)
73 (Unhealthy for Sensitive Groups)
77 (Unhealthy for Sensitive Groups)
so2
6 (Good)
3.4 (Good)
2.8 (Good)
3.1 (Good)
3.3 (Good)
8.2 (Good)
7.4 (Good)
5 (Good)
8.9 (Good)
6.5 (Good)
8.1 (Good)
7.3 (Good)
5.9 (Good)
5.2 (Good)
4.7 (Good)
3.5 (Good)
3.7 (Good)
7.2 (Good)
5.9 (Good)
7.3 (Good)
data source »
甘溪港
Friday, May 27, 2022, 12:00 PM
PM10 179 (Very bad Hazardous)
particulate matter (PM10) suspended dust
PM2,5 35 (Unhealthy for Sensitive Groups)
particulate matter (PM2.5) dust
O3 0.04 (Good)
ozone (O3)
NO2 0 (Good)
nitrogen dioxide (NO2)
SO2 0 (Good)
sulfur dioxide (SO2)
甘溪港
index
2022-05-27
pm10
56
pm25
56
o3
0.03
no2
0
so2
0
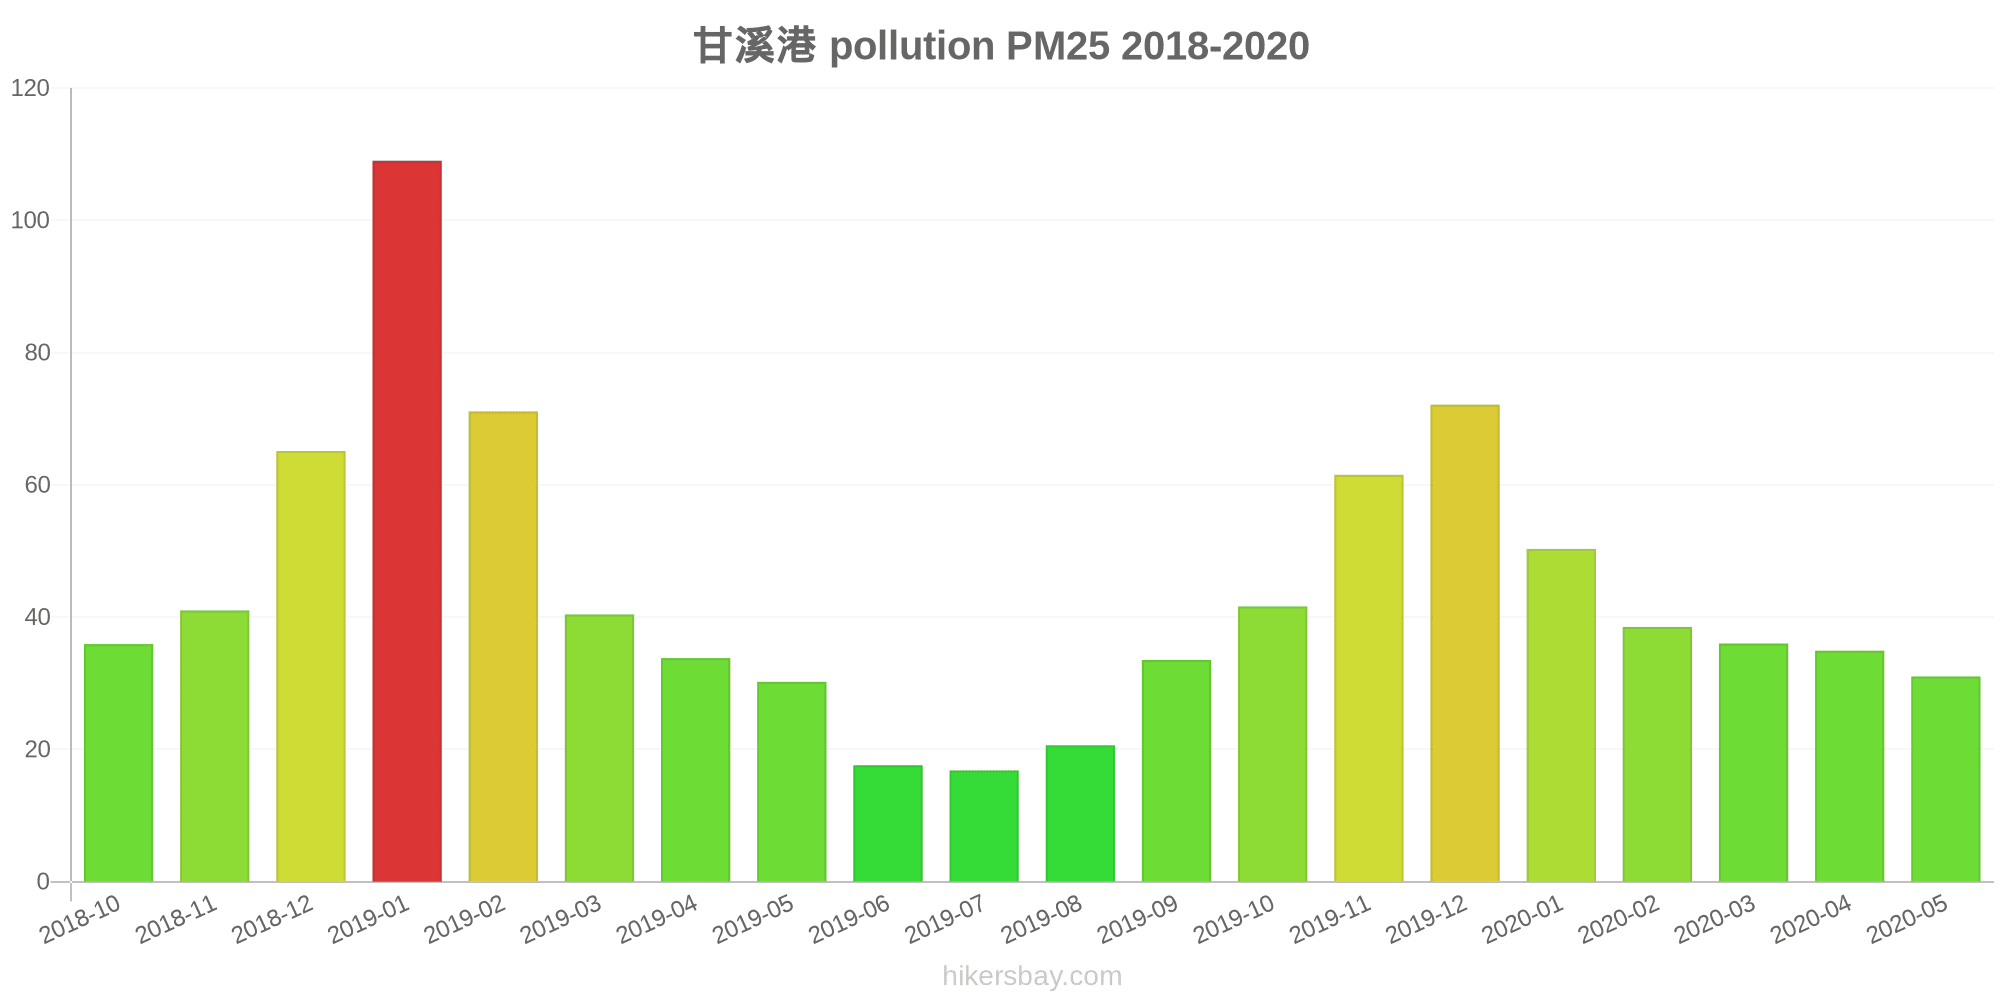
甘溪港
2018-10 2020-05

index
2020-05
2020-04
2020-03
2020-02
2020-01
2019-12
2019-11
2019-10
2019-09
2019-08
2019-07
2019-06
2019-05
2019-04
2019-03
2019-02
2019-01
2018-12
2018-11
2018-10
pm25
31
35
36
39
50
72
62
42
34
21
17
18
30
34
40
71
109
65
41
36
co
957
1
1
1
1
1
1
1
1
1
976
1
952
1
1
1
1
1
1
1
no2
11
14
15
9.3
14
23
20
16
12
8.4
8.7
8.8
12
10
17
12
20
19
17
19
o3
120
144
92
73
56
80
115
124
166
152
118
132
125
112
113
67
69
59
96
108
pm10
63
58
63
58
77
103
98
71
64
46
42
40
65
60
71
95
140
104
73
77
so2
6
3.4
2.8
3.1
3.3
8.2
7.4
5
8.9
6.5
8.1
7.3
5.9
5.2
4.7
3.5
3.7
7.2
5.9
7.3
* Pollution data source:
https://openaq.org
(ChinaAQIData)
The data is licensed under CC-By 4.0
PM10 179 (Very bad Hazardous)
PM2,5 35 (Unhealthy for Sensitive Groups)
O3 0 (Good)
NO2 0 (Good)
SO2 0 (Good)
Data on air pollution from recent days in Huangtengshu
| index | 2022-05-27 |
|---|---|
| pm10 | 56 Unhealthy for Sensitive Groups |
| pm25 | 56 Unhealthy |
| o3 | 0 Good |
| no2 | 0 Good |
| so2 | 0 Good |
| index | 2020-05 | 2020-04 | 2020-03 | 2020-02 | 2020-01 | 2019-12 | 2019-11 | 2019-10 | 2019-09 | 2019-08 | 2019-07 | 2019-06 | 2019-05 | 2019-04 | 2019-03 | 2019-02 | 2019-01 | 2018-12 | 2018-11 | 2018-10 |
|---|---|---|---|---|---|---|---|---|---|---|---|---|---|---|---|---|---|---|---|---|
| pm25 | 31 (Moderate) | 35 (Moderate) | 36 (Unhealthy for Sensitive Groups) | 39 (Unhealthy for Sensitive Groups) | 50 (Unhealthy for Sensitive Groups) | 72 (Unhealthy) | 62 (Unhealthy) | 42 (Unhealthy for Sensitive Groups) | 34 (Moderate) | 21 (Moderate) | 17 (Moderate) | 18 (Moderate) | 30 (Moderate) | 34 (Moderate) | 40 (Unhealthy for Sensitive Groups) | 71 (Unhealthy) | 109 (Very Unhealthy) | 65 (Unhealthy) | 41 (Unhealthy for Sensitive Groups) | 36 (Unhealthy for Sensitive Groups) |
| co | 957 (Good) | 1 (Good) | 1 (Good) | 1 (Good) | 1 (Good) | 1 (Good) | 1 (Good) | 1 (Good) | 1 (Good) | 1 (Good) | 976 (Good) | 1 (Good) | 952 (Good) | 1 (Good) | 1 (Good) | 1 (Good) | 1 (Good) | 1 (Good) | 1 (Good) | 1 (Good) |
| no2 | 11 (Good) | 14 (Good) | 15 (Good) | 9.3 (Good) | 14 (Good) | 23 (Good) | 20 (Good) | 16 (Good) | 12 (Good) | 8.4 (Good) | 8.7 (Good) | 8.8 (Good) | 12 (Good) | 10 (Good) | 17 (Good) | 12 (Good) | 20 (Good) | 19 (Good) | 17 (Good) | 19 (Good) |
| o3 | 120 (Unhealthy for Sensitive Groups) | 144 (Unhealthy for Sensitive Groups) | 92 (Moderate) | 73 (Moderate) | 56 (Good) | 80 (Moderate) | 115 (Moderate) | 124 (Unhealthy for Sensitive Groups) | 166 (Unhealthy) | 152 (Unhealthy) | 118 (Moderate) | 132 (Unhealthy for Sensitive Groups) | 125 (Unhealthy for Sensitive Groups) | 112 (Moderate) | 113 (Moderate) | 67 (Good) | 69 (Good) | 59 (Good) | 96 (Moderate) | 108 (Moderate) |
| pm10 | 63 (Unhealthy for Sensitive Groups) | 58 (Unhealthy for Sensitive Groups) | 63 (Unhealthy for Sensitive Groups) | 58 (Unhealthy for Sensitive Groups) | 77 (Unhealthy for Sensitive Groups) | 103 (Unhealthy) | 98 (Unhealthy) | 71 (Unhealthy for Sensitive Groups) | 64 (Unhealthy for Sensitive Groups) | 46 (Moderate) | 42 (Moderate) | 40 (Moderate) | 65 (Unhealthy for Sensitive Groups) | 60 (Unhealthy for Sensitive Groups) | 71 (Unhealthy for Sensitive Groups) | 95 (Unhealthy) | 140 (Very Unhealthy) | 104 (Unhealthy) | 73 (Unhealthy for Sensitive Groups) | 77 (Unhealthy for Sensitive Groups) |
| so2 | 6 (Good) | 3.4 (Good) | 2.8 (Good) | 3.1 (Good) | 3.3 (Good) | 8.2 (Good) | 7.4 (Good) | 5 (Good) | 8.9 (Good) | 6.5 (Good) | 8.1 (Good) | 7.3 (Good) | 5.9 (Good) | 5.2 (Good) | 4.7 (Good) | 3.5 (Good) | 3.7 (Good) | 7.2 (Good) | 5.9 (Good) | 7.3 (Good) |
PM10 179 (Very bad Hazardous)
particulate matter (PM10) suspended dustPM2,5 35 (Unhealthy for Sensitive Groups)
particulate matter (PM2.5) dustO3 0.04 (Good)
ozone (O3)NO2 0 (Good)
nitrogen dioxide (NO2)SO2 0 (Good)
sulfur dioxide (SO2)甘溪港
| index | 2022-05-27 |
|---|---|
| pm10 | 56 |
| pm25 | 56 |
| o3 | 0.03 |
| no2 | 0 |
| so2 | 0 |
甘溪港
| index | 2020-05 | 2020-04 | 2020-03 | 2020-02 | 2020-01 | 2019-12 | 2019-11 | 2019-10 | 2019-09 | 2019-08 | 2019-07 | 2019-06 | 2019-05 | 2019-04 | 2019-03 | 2019-02 | 2019-01 | 2018-12 | 2018-11 | 2018-10 |
|---|---|---|---|---|---|---|---|---|---|---|---|---|---|---|---|---|---|---|---|---|
| pm25 | 31 | 35 | 36 | 39 | 50 | 72 | 62 | 42 | 34 | 21 | 17 | 18 | 30 | 34 | 40 | 71 | 109 | 65 | 41 | 36 |
| co | 957 | 1 | 1 | 1 | 1 | 1 | 1 | 1 | 1 | 1 | 976 | 1 | 952 | 1 | 1 | 1 | 1 | 1 | 1 | 1 |
| no2 | 11 | 14 | 15 | 9.3 | 14 | 23 | 20 | 16 | 12 | 8.4 | 8.7 | 8.8 | 12 | 10 | 17 | 12 | 20 | 19 | 17 | 19 |
| o3 | 120 | 144 | 92 | 73 | 56 | 80 | 115 | 124 | 166 | 152 | 118 | 132 | 125 | 112 | 113 | 67 | 69 | 59 | 96 | 108 |
| pm10 | 63 | 58 | 63 | 58 | 77 | 103 | 98 | 71 | 64 | 46 | 42 | 40 | 65 | 60 | 71 | 95 | 140 | 104 | 73 | 77 |
| so2 | 6 | 3.4 | 2.8 | 3.1 | 3.3 | 8.2 | 7.4 | 5 | 8.9 | 6.5 | 8.1 | 7.3 | 5.9 | 5.2 | 4.7 | 3.5 | 3.7 | 7.2 | 5.9 | 7.3 |