Air Pollution in Yongning: Real-time Air Quality Index and smog alert.
Pollution and air quality forecast for Yongning. Today is Tuesday, June 16, 2026. The following air pollution values have been recorded for Yongning:- particulate matter (PM10) suspended dust - 7 (Good)
- particulate matter (PM2.5) dust - 2 (Good)
- carbon monoxide (CO) - 100 (Good)
- nitrogen dioxide (NO2) - 8 (Good)
- ozone (O3) - 0 (Good)
- sulfur dioxide (SO2) - 9 (Good)

What is the air quality in Yongning today? Is the air polluted in Yongning?. Is there smog?
What is the level of PM10 today in Yongning? (particulate matter (PM10) suspended dust)
The current level of particulate matter PM10 in Yongning is:
7 (Good)
The highest PM10 values usually occur in month: 112 (January 2019).
The lowest value of particulate matter PM10 pollution in Yongning is usually recorded in: July (40).
What is the current level of PM2.5 in Yongning? (particulate matter (PM2.5) dust)
Today's PM2.5 level is:
2 (Good)
For comparison, the highest level of PM2.5 in Yongning in the last 7 days was: 24 (Friday, May 27, 2022) and the lowest: 24 (Friday, May 27, 2022).
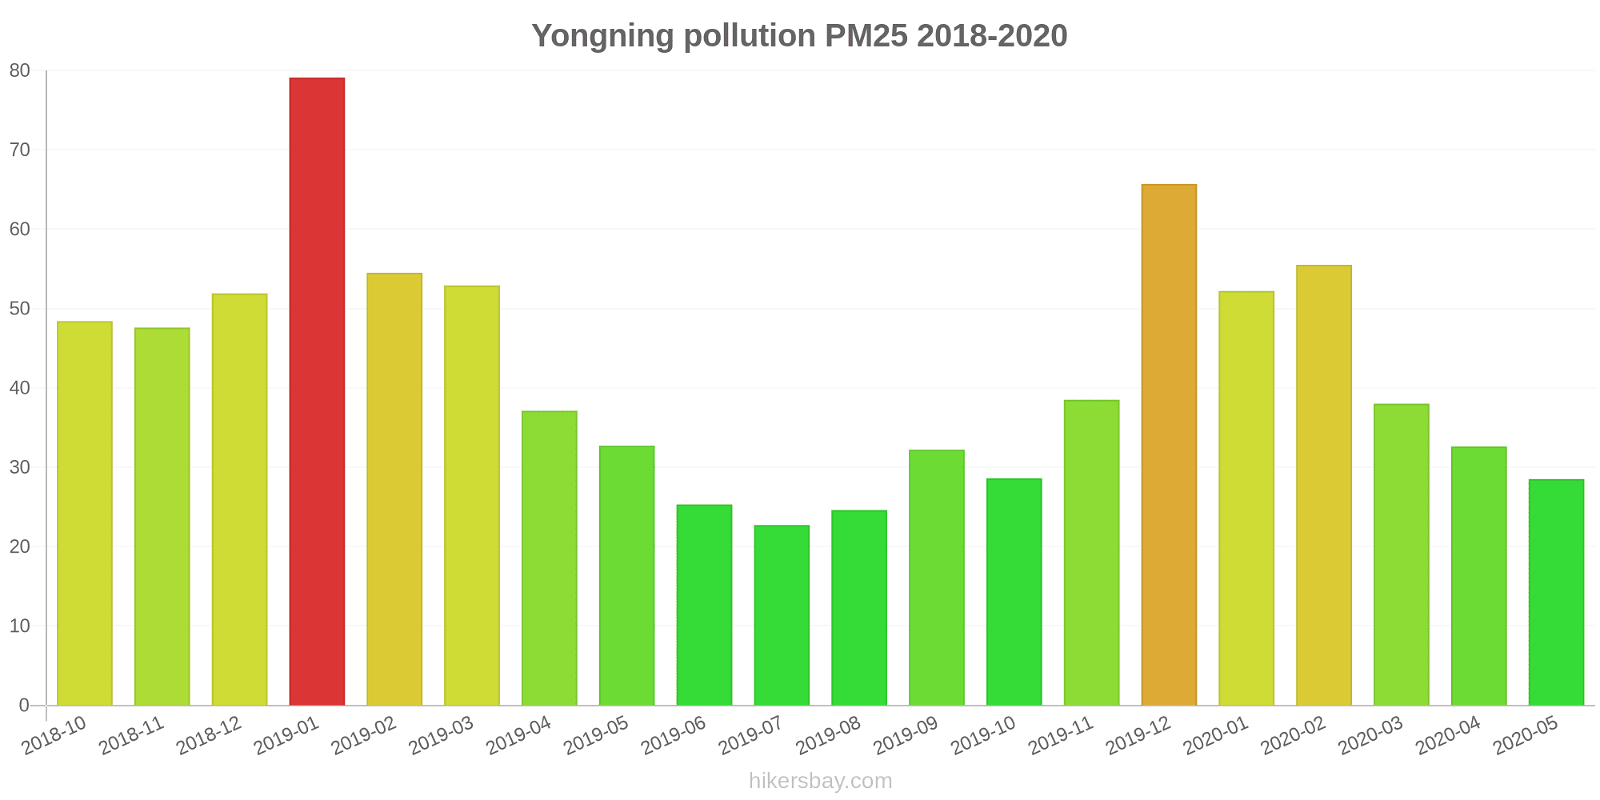
The highest PM2.5 values were recorded: 79 (January 2019).
The lowest level of particulate matter PM2.5 pollution occurs in month: July (23).
How high is the CO level? (carbon monoxide (CO))
100 (Good)
How high is the level of NO2? (nitrogen dioxide (NO2))
8 (Good)
How is the O3 level today in Yongning? (ozone (O3))
0 (Good)
What is the level of SO2 pollution? (sulfur dioxide (SO2))
9 (Good)
Current data Friday, May 27, 2022, 12:00 PM
PM10 7 (Good)
PM2,5 2 (Good)
CO 100 (Good)
NO2 8 (Good)
O3 0 (Good)
SO2 9 (Good)
Data on air pollution from recent days in Yongning
index
2022-05-27
pm10
32
Moderate
pm25
24
Moderate
co
468
Good
no2
21
Good
o3
32
Good
so2
5
Good
data source »
Air pollution in Yongning from October 2018 to May 2020
index
2020-05
2020-04
2020-03
2020-02
2020-01
2019-12
2019-11
2019-10
2019-09
2019-08
2019-07
2019-06
2019-05
2019-04
2019-03
2019-02
2019-01
2018-12
2018-11
2018-10
pm25
29 (Moderate)
33 (Moderate)
38 (Unhealthy for Sensitive Groups)
56 (Unhealthy)
52 (Unhealthy for Sensitive Groups)
66 (Unhealthy)
39 (Unhealthy for Sensitive Groups)
29 (Moderate)
32 (Moderate)
25 (Moderate)
23 (Moderate)
25 (Moderate)
33 (Moderate)
37 (Unhealthy for Sensitive Groups)
53 (Unhealthy for Sensitive Groups)
55 (Unhealthy for Sensitive Groups)
79 (Very Unhealthy)
52 (Unhealthy for Sensitive Groups)
48 (Unhealthy for Sensitive Groups)
48 (Unhealthy for Sensitive Groups)
co
661 (Good)
701 (Good)
623 (Good)
589 (Good)
633 (Good)
1 (Good)
932 (Good)
898 (Good)
910 (Good)
797 (Good)
820 (Good)
808 (Good)
947 (Good)
913 (Good)
861 (Good)
1 (Good)
1 (Good)
942 (Good)
1 (Good)
1 (Good)
no2
40 (Good)
47 (Moderate)
39 (Good)
24 (Good)
39 (Good)
47 (Moderate)
42 (Moderate)
36 (Good)
41 (Moderate)
39 (Good)
36 (Good)
37 (Good)
41 (Moderate)
44 (Moderate)
52 (Moderate)
34 (Good)
50 (Moderate)
39 (Good)
50 (Moderate)
47 (Moderate)
o3
170 (Unhealthy)
100 (Moderate)
90 (Moderate)
57 (Good)
40 (Good)
29 (Good)
34 (Good)
77 (Moderate)
130 (Unhealthy for Sensitive Groups)
189 (Very Unhealthy)
146 (Unhealthy for Sensitive Groups)
120 (Unhealthy for Sensitive Groups)
107 (Moderate)
136 (Unhealthy for Sensitive Groups)
86 (Moderate)
63 (Good)
37 (Good)
25 (Good)
41 (Good)
37 (Good)
pm10
57 (Unhealthy for Sensitive Groups)
56 (Unhealthy for Sensitive Groups)
59 (Unhealthy for Sensitive Groups)
64 (Unhealthy for Sensitive Groups)
71 (Unhealthy for Sensitive Groups)
95 (Unhealthy)
62 (Unhealthy for Sensitive Groups)
47 (Moderate)
54 (Unhealthy for Sensitive Groups)
48 (Moderate)
40 (Moderate)
43 (Moderate)
54 (Unhealthy for Sensitive Groups)
62 (Unhealthy for Sensitive Groups)
80 (Unhealthy)
73 (Unhealthy for Sensitive Groups)
112 (Very Unhealthy)
79 (Unhealthy for Sensitive Groups)
78 (Unhealthy for Sensitive Groups)
72 (Unhealthy for Sensitive Groups)
so2
9.2 (Good)
7.8 (Good)
7.8 (Good)
6.2 (Good)
7.4 (Good)
8.3 (Good)
7.1 (Good)
6.3 (Good)
6.4 (Good)
7.3 (Good)
6 (Good)
5.8 (Good)
5.7 (Good)
7 (Good)
7.5 (Good)
8.3 (Good)
7.3 (Good)
8.1 (Good)
8 (Good)
6.7 (Good)
data source »
茶园
Friday, May 27, 2022, 12:00 PM
PM10 6.7 (Good)
particulate matter (PM10) suspended dust
PM2,5 1.7 (Good)
particulate matter (PM2.5) dust
CO 100 (Good)
carbon monoxide (CO)
NO2 7.6 (Good)
nitrogen dioxide (NO2)
O3 0.02 (Good)
ozone (O3)
SO2 8.6 (Good)
sulfur dioxide (SO2)
茶园
index
2022-05-27
pm10
32
pm25
24
co
468
no2
21
o3
32
so2
4.6
茶园
2018-10 2020-05
index
2020-05
2020-04
2020-03
2020-02
2020-01
2019-12
2019-11
2019-10
2019-09
2019-08
2019-07
2019-06
2019-05
2019-04
2019-03
2019-02
2019-01
2018-12
2018-11
2018-10
pm25
29
33
38
56
52
66
39
29
32
25
23
25
33
37
53
55
79
52
48
48
co
661
701
623
589
633
1
932
898
910
797
820
808
947
913
861
1
1
942
1
1
no2
40
47
39
24
39
47
42
36
41
39
36
37
41
44
52
34
50
39
50
47
o3
170
100
90
57
40
29
34
77
130
189
146
120
107
136
86
63
37
25
41
37
pm10
57
56
59
64
71
95
62
47
54
48
40
43
54
62
80
73
112
79
78
72
so2
9.2
7.8
7.8
6.2
7.4
8.3
7.1
6.3
6.4
7.3
6
5.8
5.7
7
7.5
8.3
7.3
8.1
8
6.7
* Pollution data source:
https://openaq.org
(ChinaAQIData)
The data is licensed under CC-By 4.0
PM10 7 (Good)
PM2,5 2 (Good)
CO 100 (Good)
NO2 8 (Good)
O3 0 (Good)
SO2 9 (Good)
Data on air pollution from recent days in Yongning
| index | 2022-05-27 |
|---|---|
| pm10 | 32 Moderate |
| pm25 | 24 Moderate |
| co | 468 Good |
| no2 | 21 Good |
| o3 | 32 Good |
| so2 | 5 Good |

| index | 2020-05 | 2020-04 | 2020-03 | 2020-02 | 2020-01 | 2019-12 | 2019-11 | 2019-10 | 2019-09 | 2019-08 | 2019-07 | 2019-06 | 2019-05 | 2019-04 | 2019-03 | 2019-02 | 2019-01 | 2018-12 | 2018-11 | 2018-10 |
|---|---|---|---|---|---|---|---|---|---|---|---|---|---|---|---|---|---|---|---|---|
| pm25 | 29 (Moderate) | 33 (Moderate) | 38 (Unhealthy for Sensitive Groups) | 56 (Unhealthy) | 52 (Unhealthy for Sensitive Groups) | 66 (Unhealthy) | 39 (Unhealthy for Sensitive Groups) | 29 (Moderate) | 32 (Moderate) | 25 (Moderate) | 23 (Moderate) | 25 (Moderate) | 33 (Moderate) | 37 (Unhealthy for Sensitive Groups) | 53 (Unhealthy for Sensitive Groups) | 55 (Unhealthy for Sensitive Groups) | 79 (Very Unhealthy) | 52 (Unhealthy for Sensitive Groups) | 48 (Unhealthy for Sensitive Groups) | 48 (Unhealthy for Sensitive Groups) |
| co | 661 (Good) | 701 (Good) | 623 (Good) | 589 (Good) | 633 (Good) | 1 (Good) | 932 (Good) | 898 (Good) | 910 (Good) | 797 (Good) | 820 (Good) | 808 (Good) | 947 (Good) | 913 (Good) | 861 (Good) | 1 (Good) | 1 (Good) | 942 (Good) | 1 (Good) | 1 (Good) |
| no2 | 40 (Good) | 47 (Moderate) | 39 (Good) | 24 (Good) | 39 (Good) | 47 (Moderate) | 42 (Moderate) | 36 (Good) | 41 (Moderate) | 39 (Good) | 36 (Good) | 37 (Good) | 41 (Moderate) | 44 (Moderate) | 52 (Moderate) | 34 (Good) | 50 (Moderate) | 39 (Good) | 50 (Moderate) | 47 (Moderate) |
| o3 | 170 (Unhealthy) | 100 (Moderate) | 90 (Moderate) | 57 (Good) | 40 (Good) | 29 (Good) | 34 (Good) | 77 (Moderate) | 130 (Unhealthy for Sensitive Groups) | 189 (Very Unhealthy) | 146 (Unhealthy for Sensitive Groups) | 120 (Unhealthy for Sensitive Groups) | 107 (Moderate) | 136 (Unhealthy for Sensitive Groups) | 86 (Moderate) | 63 (Good) | 37 (Good) | 25 (Good) | 41 (Good) | 37 (Good) |
| pm10 | 57 (Unhealthy for Sensitive Groups) | 56 (Unhealthy for Sensitive Groups) | 59 (Unhealthy for Sensitive Groups) | 64 (Unhealthy for Sensitive Groups) | 71 (Unhealthy for Sensitive Groups) | 95 (Unhealthy) | 62 (Unhealthy for Sensitive Groups) | 47 (Moderate) | 54 (Unhealthy for Sensitive Groups) | 48 (Moderate) | 40 (Moderate) | 43 (Moderate) | 54 (Unhealthy for Sensitive Groups) | 62 (Unhealthy for Sensitive Groups) | 80 (Unhealthy) | 73 (Unhealthy for Sensitive Groups) | 112 (Very Unhealthy) | 79 (Unhealthy for Sensitive Groups) | 78 (Unhealthy for Sensitive Groups) | 72 (Unhealthy for Sensitive Groups) |
| so2 | 9.2 (Good) | 7.8 (Good) | 7.8 (Good) | 6.2 (Good) | 7.4 (Good) | 8.3 (Good) | 7.1 (Good) | 6.3 (Good) | 6.4 (Good) | 7.3 (Good) | 6 (Good) | 5.8 (Good) | 5.7 (Good) | 7 (Good) | 7.5 (Good) | 8.3 (Good) | 7.3 (Good) | 8.1 (Good) | 8 (Good) | 6.7 (Good) |
PM10 6.7 (Good)
particulate matter (PM10) suspended dustPM2,5 1.7 (Good)
particulate matter (PM2.5) dustCO 100 (Good)
carbon monoxide (CO)NO2 7.6 (Good)
nitrogen dioxide (NO2)O3 0.02 (Good)
ozone (O3)SO2 8.6 (Good)
sulfur dioxide (SO2)茶园
| index | 2022-05-27 |
|---|---|
| pm10 | 32 |
| pm25 | 24 |
| co | 468 |
| no2 | 21 |
| o3 | 32 |
| so2 | 4.6 |
茶园

| index | 2020-05 | 2020-04 | 2020-03 | 2020-02 | 2020-01 | 2019-12 | 2019-11 | 2019-10 | 2019-09 | 2019-08 | 2019-07 | 2019-06 | 2019-05 | 2019-04 | 2019-03 | 2019-02 | 2019-01 | 2018-12 | 2018-11 | 2018-10 |
|---|---|---|---|---|---|---|---|---|---|---|---|---|---|---|---|---|---|---|---|---|
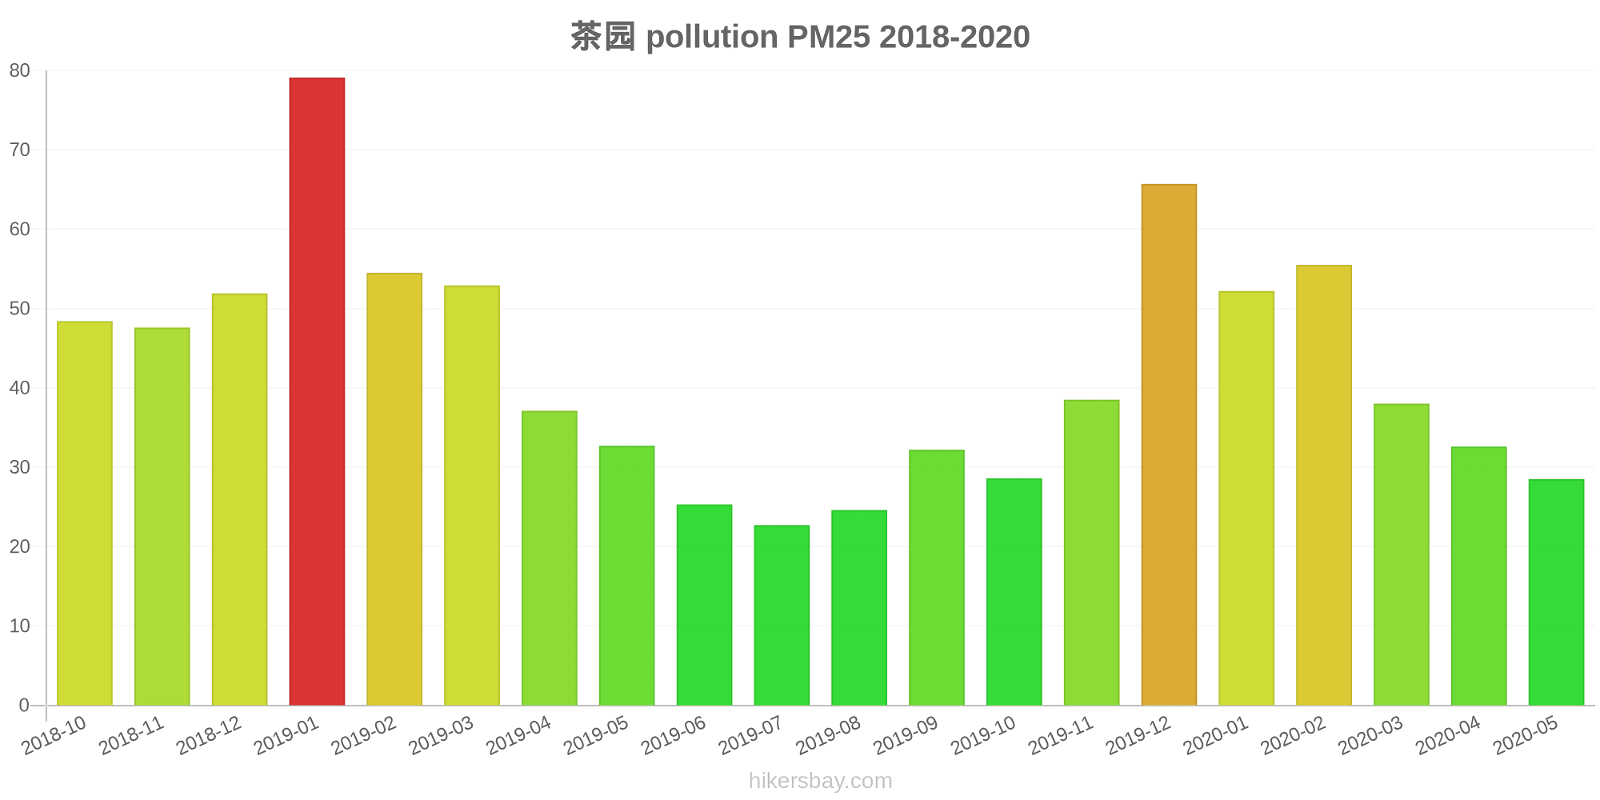
| pm25 | 29 | 33 | 38 | 56 | 52 | 66 | 39 | 29 | 32 | 25 | 23 | 25 | 33 | 37 | 53 | 55 | 79 | 52 | 48 | 48 |
| co | 661 | 701 | 623 | 589 | 633 | 1 | 932 | 898 | 910 | 797 | 820 | 808 | 947 | 913 | 861 | 1 | 1 | 942 | 1 | 1 |
| no2 | 40 | 47 | 39 | 24 | 39 | 47 | 42 | 36 | 41 | 39 | 36 | 37 | 41 | 44 | 52 | 34 | 50 | 39 | 50 | 47 |
| o3 | 170 | 100 | 90 | 57 | 40 | 29 | 34 | 77 | 130 | 189 | 146 | 120 | 107 | 136 | 86 | 63 | 37 | 25 | 41 | 37 |
| pm10 | 57 | 56 | 59 | 64 | 71 | 95 | 62 | 47 | 54 | 48 | 40 | 43 | 54 | 62 | 80 | 73 | 112 | 79 | 78 | 72 |
| so2 | 9.2 | 7.8 | 7.8 | 6.2 | 7.4 | 8.3 | 7.1 | 6.3 | 6.4 | 7.3 | 6 | 5.8 | 5.7 | 7 | 7.5 | 8.3 | 7.3 | 8.1 | 8 | 6.7 |