Air Pollution in Sinancun: Real-time Air Quality Index and smog alert.
Pollution and air quality forecast for Sinancun. Today is Sunday, June 21, 2026. The following air pollution values have been recorded for Sinancun:- particulate matter (PM10) suspended dust - 7 (Good)
- particulate matter (PM2.5) dust - 2 (Good)
- carbon monoxide (CO) - 100 (Good)
- nitrogen dioxide (NO2) - 8 (Good)
- ozone (O3) - 0 (Good)
- sulfur dioxide (SO2) - 9 (Good)

What is the air quality in Sinancun today? Is the air polluted in Sinancun?. Is there smog?
What is the level of PM10 today in Sinancun? (particulate matter (PM10) suspended dust)
The current level of particulate matter PM10 in Sinancun is:
7 (Good)
The highest PM10 values usually occur in month: 99 (January 2019).
The lowest value of particulate matter PM10 pollution in Sinancun is usually recorded in: June (42).
What is the current level of PM2.5 in Sinancun? (particulate matter (PM2.5) dust)
Today's PM2.5 level is:
2 (Good)
For comparison, the highest level of PM2.5 in Sinancun in the last 7 days was: 24 (Friday, May 27, 2022) and the lowest: 24 (Friday, May 27, 2022).
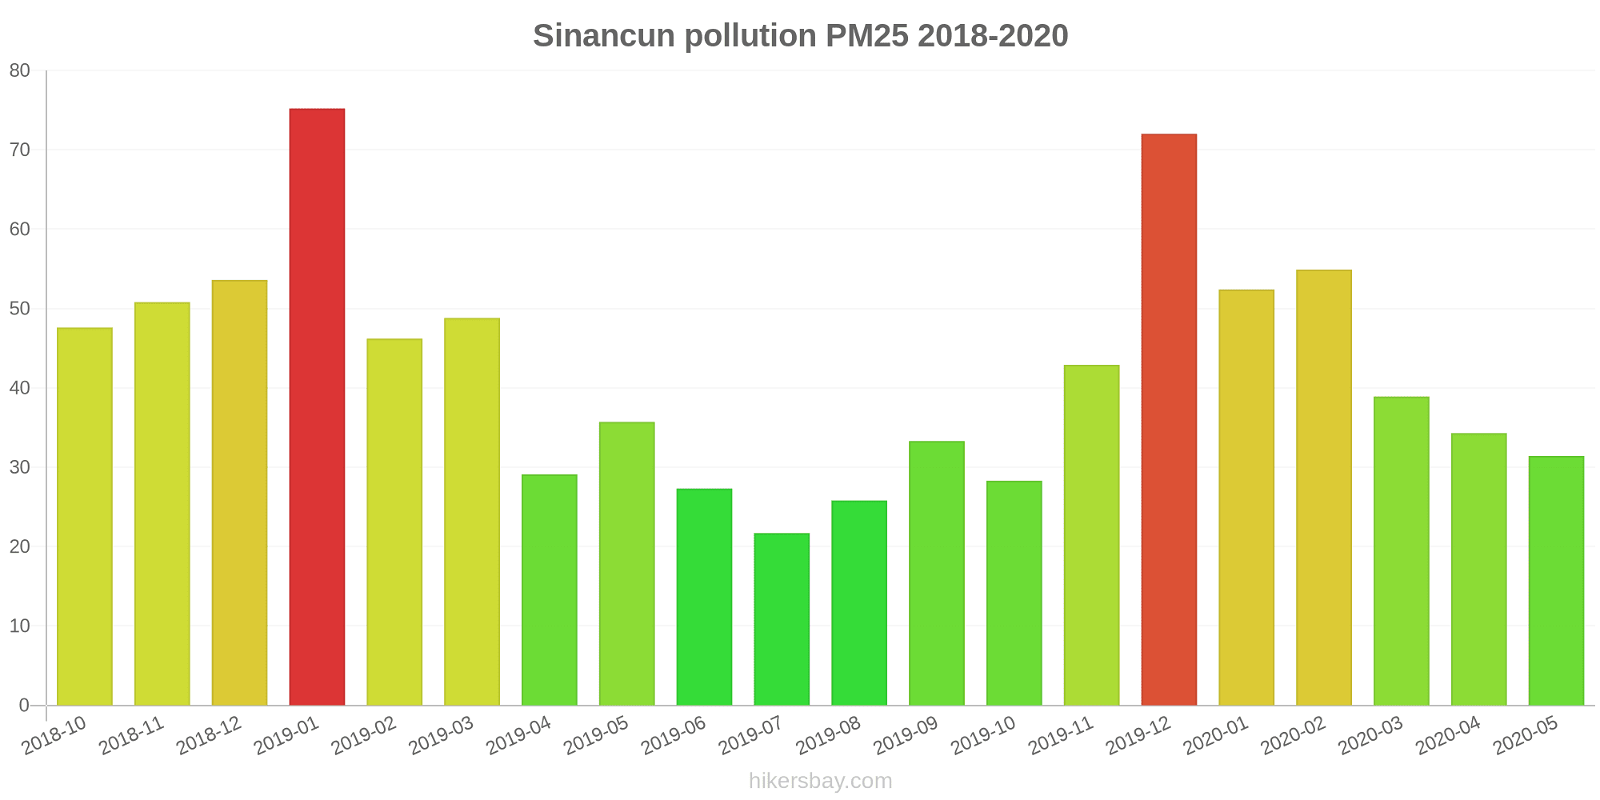
The highest PM2.5 values were recorded: 75 (January 2019).
The lowest level of particulate matter PM2.5 pollution occurs in month: July (22).
How high is the CO level? (carbon monoxide (CO))
100 (Good)
How high is the level of NO2? (nitrogen dioxide (NO2))
8 (Good)
How is the O3 level today in Sinancun? (ozone (O3))
0 (Good)
What is the level of SO2 pollution? (sulfur dioxide (SO2))
9 (Good)
Current data Friday, May 27, 2022, 12:00 PM
PM10 7 (Good)
PM2,5 2 (Good)
CO 100 (Good)
NO2 8 (Good)
O3 0 (Good)
SO2 9 (Good)
Data on air pollution from recent days in Sinancun
index
2022-05-27
pm10
32
Moderate
pm25
24
Moderate
co
468
Good
no2
21
Good
o3
32
Good
so2
5
Good
data source »
Air pollution in Sinancun from October 2018 to May 2020
index
2020-05
2020-04
2020-03
2020-02
2020-01
2019-12
2019-11
2019-10
2019-09
2019-08
2019-07
2019-06
2019-05
2019-04
2019-03
2019-02
2019-01
2018-12
2018-11
2018-10
pm25
31 (Moderate)
34 (Moderate)
39 (Unhealthy for Sensitive Groups)
55 (Unhealthy for Sensitive Groups)
52 (Unhealthy for Sensitive Groups)
72 (Unhealthy)
43 (Unhealthy for Sensitive Groups)
28 (Moderate)
33 (Moderate)
26 (Moderate)
22 (Moderate)
27 (Moderate)
36 (Unhealthy for Sensitive Groups)
29 (Moderate)
49 (Unhealthy for Sensitive Groups)
46 (Unhealthy for Sensitive Groups)
75 (Very Unhealthy)
54 (Unhealthy for Sensitive Groups)
51 (Unhealthy for Sensitive Groups)
48 (Unhealthy for Sensitive Groups)
co
557 (Good)
583 (Good)
658 (Good)
931 (Good)
1 (Good)
1 (Good)
808 (Good)
742 (Good)
700 (Good)
680 (Good)
633 (Good)
693 (Good)
740 (Good)
744 (Good)
795 (Good)
909 (Good)
1 (Good)
1 (Good)
908 (Good)
956 (Good)
no2
28 (Good)
38 (Good)
32 (Good)
17 (Good)
35 (Good)
54 (Moderate)
46 (Moderate)
35 (Good)
35 (Good)
26 (Good)
26 (Good)
28 (Good)
39 (Good)
37 (Good)
55 (Moderate)
33 (Good)
51 (Moderate)
42 (Moderate)
46 (Moderate)
46 (Moderate)
o3
180 (Very Unhealthy)
102 (Moderate)
95 (Moderate)
59 (Good)
42 (Good)
30 (Good)
38 (Good)
76 (Moderate)
128 (Unhealthy for Sensitive Groups)
193 (Very Unhealthy)
153 (Unhealthy)
126 (Unhealthy for Sensitive Groups)
113 (Moderate)
143 (Unhealthy for Sensitive Groups)
87 (Moderate)
69 (Good)
44 (Good)
30 (Good)
47 (Good)
43 (Good)
pm10
56 (Unhealthy for Sensitive Groups)
57 (Unhealthy for Sensitive Groups)
65 (Unhealthy for Sensitive Groups)
64 (Unhealthy for Sensitive Groups)
62 (Unhealthy for Sensitive Groups)
92 (Unhealthy)
63 (Unhealthy for Sensitive Groups)
46 (Moderate)
57 (Unhealthy for Sensitive Groups)
51 (Unhealthy for Sensitive Groups)
46 (Moderate)
42 (Moderate)
53 (Unhealthy for Sensitive Groups)
50 (Moderate)
74 (Unhealthy for Sensitive Groups)
66 (Unhealthy for Sensitive Groups)
99 (Unhealthy)
69 (Unhealthy for Sensitive Groups)
67 (Unhealthy for Sensitive Groups)
64 (Unhealthy for Sensitive Groups)
so2
8.4 (Good)
7.9 (Good)
7.3 (Good)
6.1 (Good)
11 (Good)
9.1 (Good)
8 (Good)
7.2 (Good)
8 (Good)
8.8 (Good)
4.5 (Good)
5.6 (Good)
4.5 (Good)
5.3 (Good)
9.1 (Good)
12 (Good)
8.4 (Good)
8 (Good)
9.4 (Good)
8.7 (Good)
data source »
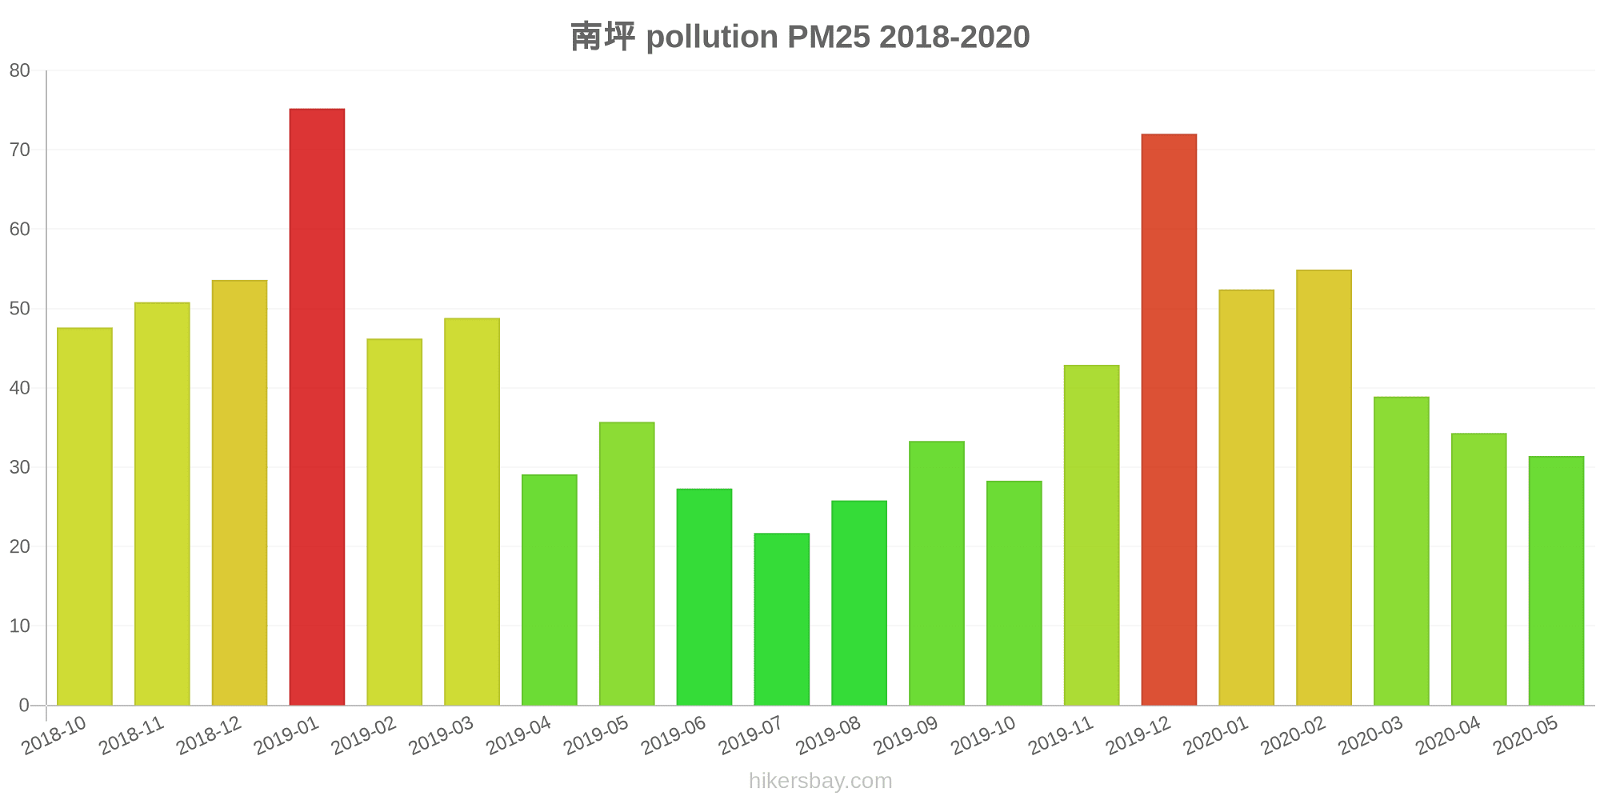
南坪
Friday, May 27, 2022, 12:00 PM
PM10 6.7 (Good)
particulate matter (PM10) suspended dust
PM2,5 1.7 (Good)
particulate matter (PM2.5) dust
CO 100 (Good)
carbon monoxide (CO)
NO2 7.6 (Good)
nitrogen dioxide (NO2)
O3 0.02 (Good)
ozone (O3)
SO2 8.6 (Good)
sulfur dioxide (SO2)
南坪
index
2022-05-27
pm10
32
pm25
24
co
468
no2
21
o3
32
so2
4.6
南坪
2018-10 2020-05
index
2020-05
2020-04
2020-03
2020-02
2020-01
2019-12
2019-11
2019-10
2019-09
2019-08
2019-07
2019-06
2019-05
2019-04
2019-03
2019-02
2019-01
2018-12
2018-11
2018-10
pm25
31
34
39
55
52
72
43
28
33
26
22
27
36
29
49
46
75
54
51
48
co
557
583
658
931
1
1
808
742
700
680
633
693
740
744
795
909
1
1
908
956
no2
28
38
32
17
35
54
46
35
35
26
26
28
39
37
55
33
51
42
46
46
o3
180
102
95
59
42
30
38
76
128
193
153
126
113
143
87
69
44
30
47
43
pm10
56
57
65
64
62
92
63
46
57
51
46
42
53
50
74
66
99
69
67
64
so2
8.4
7.9
7.3
6.1
11
9.1
8
7.2
8
8.8
4.5
5.6
4.5
5.3
9.1
12
8.4
8
9.4
8.7
* Pollution data source:
https://openaq.org
(ChinaAQIData)
The data is licensed under CC-By 4.0
PM10 7 (Good)
PM2,5 2 (Good)
CO 100 (Good)
NO2 8 (Good)
O3 0 (Good)
SO2 9 (Good)
Data on air pollution from recent days in Sinancun
| index | 2022-05-27 |
|---|---|
| pm10 | 32 Moderate |
| pm25 | 24 Moderate |
| co | 468 Good |
| no2 | 21 Good |
| o3 | 32 Good |
| so2 | 5 Good |

| index | 2020-05 | 2020-04 | 2020-03 | 2020-02 | 2020-01 | 2019-12 | 2019-11 | 2019-10 | 2019-09 | 2019-08 | 2019-07 | 2019-06 | 2019-05 | 2019-04 | 2019-03 | 2019-02 | 2019-01 | 2018-12 | 2018-11 | 2018-10 |
|---|---|---|---|---|---|---|---|---|---|---|---|---|---|---|---|---|---|---|---|---|
| pm25 | 31 (Moderate) | 34 (Moderate) | 39 (Unhealthy for Sensitive Groups) | 55 (Unhealthy for Sensitive Groups) | 52 (Unhealthy for Sensitive Groups) | 72 (Unhealthy) | 43 (Unhealthy for Sensitive Groups) | 28 (Moderate) | 33 (Moderate) | 26 (Moderate) | 22 (Moderate) | 27 (Moderate) | 36 (Unhealthy for Sensitive Groups) | 29 (Moderate) | 49 (Unhealthy for Sensitive Groups) | 46 (Unhealthy for Sensitive Groups) | 75 (Very Unhealthy) | 54 (Unhealthy for Sensitive Groups) | 51 (Unhealthy for Sensitive Groups) | 48 (Unhealthy for Sensitive Groups) |
| co | 557 (Good) | 583 (Good) | 658 (Good) | 931 (Good) | 1 (Good) | 1 (Good) | 808 (Good) | 742 (Good) | 700 (Good) | 680 (Good) | 633 (Good) | 693 (Good) | 740 (Good) | 744 (Good) | 795 (Good) | 909 (Good) | 1 (Good) | 1 (Good) | 908 (Good) | 956 (Good) |
| no2 | 28 (Good) | 38 (Good) | 32 (Good) | 17 (Good) | 35 (Good) | 54 (Moderate) | 46 (Moderate) | 35 (Good) | 35 (Good) | 26 (Good) | 26 (Good) | 28 (Good) | 39 (Good) | 37 (Good) | 55 (Moderate) | 33 (Good) | 51 (Moderate) | 42 (Moderate) | 46 (Moderate) | 46 (Moderate) |
| o3 | 180 (Very Unhealthy) | 102 (Moderate) | 95 (Moderate) | 59 (Good) | 42 (Good) | 30 (Good) | 38 (Good) | 76 (Moderate) | 128 (Unhealthy for Sensitive Groups) | 193 (Very Unhealthy) | 153 (Unhealthy) | 126 (Unhealthy for Sensitive Groups) | 113 (Moderate) | 143 (Unhealthy for Sensitive Groups) | 87 (Moderate) | 69 (Good) | 44 (Good) | 30 (Good) | 47 (Good) | 43 (Good) |
| pm10 | 56 (Unhealthy for Sensitive Groups) | 57 (Unhealthy for Sensitive Groups) | 65 (Unhealthy for Sensitive Groups) | 64 (Unhealthy for Sensitive Groups) | 62 (Unhealthy for Sensitive Groups) | 92 (Unhealthy) | 63 (Unhealthy for Sensitive Groups) | 46 (Moderate) | 57 (Unhealthy for Sensitive Groups) | 51 (Unhealthy for Sensitive Groups) | 46 (Moderate) | 42 (Moderate) | 53 (Unhealthy for Sensitive Groups) | 50 (Moderate) | 74 (Unhealthy for Sensitive Groups) | 66 (Unhealthy for Sensitive Groups) | 99 (Unhealthy) | 69 (Unhealthy for Sensitive Groups) | 67 (Unhealthy for Sensitive Groups) | 64 (Unhealthy for Sensitive Groups) |
| so2 | 8.4 (Good) | 7.9 (Good) | 7.3 (Good) | 6.1 (Good) | 11 (Good) | 9.1 (Good) | 8 (Good) | 7.2 (Good) | 8 (Good) | 8.8 (Good) | 4.5 (Good) | 5.6 (Good) | 4.5 (Good) | 5.3 (Good) | 9.1 (Good) | 12 (Good) | 8.4 (Good) | 8 (Good) | 9.4 (Good) | 8.7 (Good) |
PM10 6.7 (Good)
particulate matter (PM10) suspended dustPM2,5 1.7 (Good)
particulate matter (PM2.5) dustCO 100 (Good)
carbon monoxide (CO)NO2 7.6 (Good)
nitrogen dioxide (NO2)O3 0.02 (Good)
ozone (O3)SO2 8.6 (Good)
sulfur dioxide (SO2)南坪
| index | 2022-05-27 |
|---|---|
| pm10 | 32 |
| pm25 | 24 |
| co | 468 |
| no2 | 21 |
| o3 | 32 |
| so2 | 4.6 |
南坪

| index | 2020-05 | 2020-04 | 2020-03 | 2020-02 | 2020-01 | 2019-12 | 2019-11 | 2019-10 | 2019-09 | 2019-08 | 2019-07 | 2019-06 | 2019-05 | 2019-04 | 2019-03 | 2019-02 | 2019-01 | 2018-12 | 2018-11 | 2018-10 |
|---|---|---|---|---|---|---|---|---|---|---|---|---|---|---|---|---|---|---|---|---|
| pm25 | 31 | 34 | 39 | 55 | 52 | 72 | 43 | 28 | 33 | 26 | 22 | 27 | 36 | 29 | 49 | 46 | 75 | 54 | 51 | 48 |
| co | 557 | 583 | 658 | 931 | 1 | 1 | 808 | 742 | 700 | 680 | 633 | 693 | 740 | 744 | 795 | 909 | 1 | 1 | 908 | 956 |
| no2 | 28 | 38 | 32 | 17 | 35 | 54 | 46 | 35 | 35 | 26 | 26 | 28 | 39 | 37 | 55 | 33 | 51 | 42 | 46 | 46 |
| o3 | 180 | 102 | 95 | 59 | 42 | 30 | 38 | 76 | 128 | 193 | 153 | 126 | 113 | 143 | 87 | 69 | 44 | 30 | 47 | 43 |
| pm10 | 56 | 57 | 65 | 64 | 62 | 92 | 63 | 46 | 57 | 51 | 46 | 42 | 53 | 50 | 74 | 66 | 99 | 69 | 67 | 64 |
| so2 | 8.4 | 7.9 | 7.3 | 6.1 | 11 | 9.1 | 8 | 7.2 | 8 | 8.8 | 4.5 | 5.6 | 4.5 | 5.3 | 9.1 | 12 | 8.4 | 8 | 9.4 | 8.7 |