Air Pollution in Shengli: Real-time Air Quality Index and smog alert.
Pollution and air quality forecast for Shengli. Today is Tuesday, June 16, 2026. The following air pollution values have been recorded for Shengli:- particulate matter (PM10) suspended dust - 7 (Good)
- particulate matter (PM2.5) dust - 2 (Good)
- carbon monoxide (CO) - 100 (Good)
- nitrogen dioxide (NO2) - 8 (Good)
- ozone (O3) - 0 (Good)
- sulfur dioxide (SO2) - 9 (Good)

What is the air quality in Shengli today? Is the air polluted in Shengli?. Is there smog?
What is the level of PM10 today in Shengli? (particulate matter (PM10) suspended dust)
The current level of particulate matter PM10 in Shengli is:
7 (Good)
The highest PM10 values usually occur in month: 82 (January 2019).
The lowest value of particulate matter PM10 pollution in Shengli is usually recorded in: October (33).
What is the current level of PM2.5 in Shengli? (particulate matter (PM2.5) dust)
Today's PM2.5 level is:
2 (Good)
For comparison, the highest level of PM2.5 in Shengli in the last 7 days was: 24 (Friday, May 27, 2022) and the lowest: 24 (Friday, May 27, 2022).
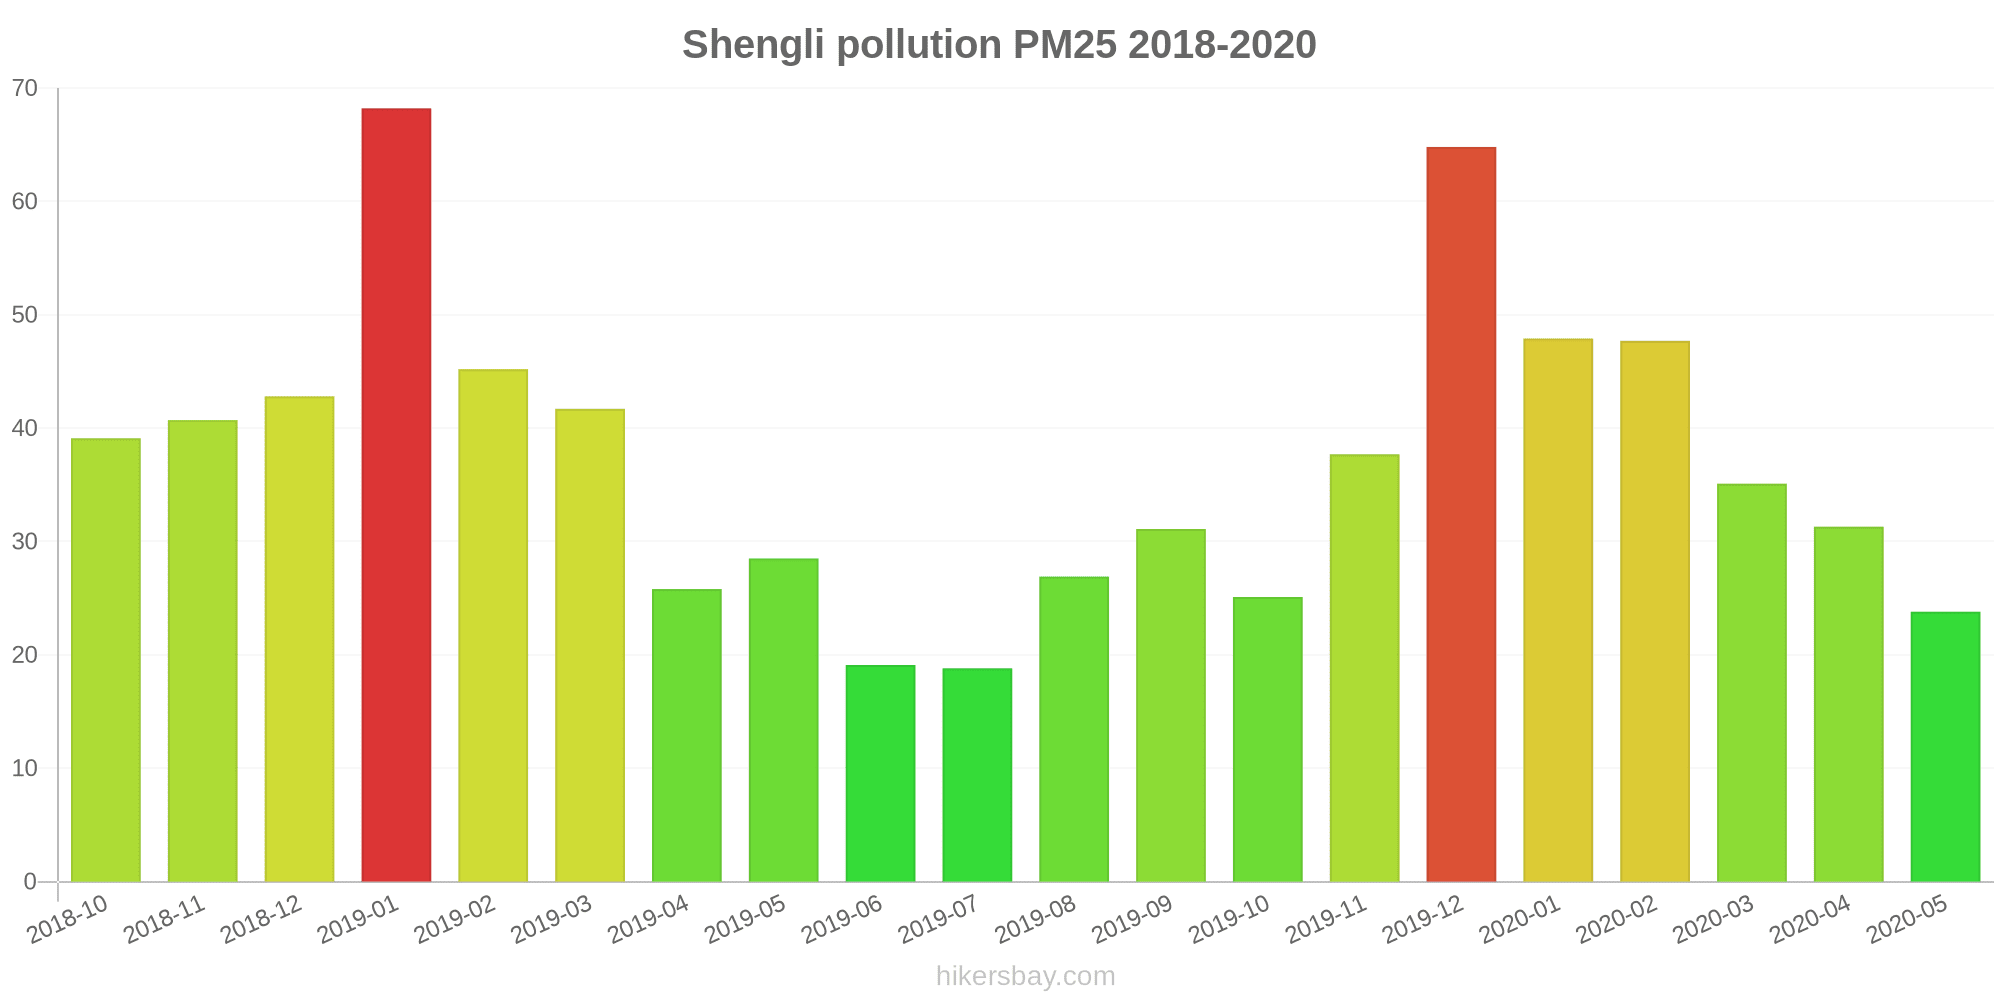
The highest PM2.5 values were recorded: 68 (January 2019).
The lowest level of particulate matter PM2.5 pollution occurs in month: July (19).
How high is the CO level? (carbon monoxide (CO))
100 (Good)
How high is the level of NO2? (nitrogen dioxide (NO2))
8 (Good)
How is the O3 level today in Shengli? (ozone (O3))
0 (Good)
What is the level of SO2 pollution? (sulfur dioxide (SO2))
9 (Good)
Current data Friday, May 27, 2022, 12:00 PM
PM10 7 (Good)
PM2,5 2 (Good)
CO 100 (Good)
NO2 8 (Good)
O3 0 (Good)
SO2 9 (Good)
Data on air pollution from recent days in Shengli
index
2022-05-27
pm10
32
Moderate
pm25
24
Moderate
co
468
Good
no2
21
Good
o3
32
Good
so2
5
Good
data source »
Air pollution in Shengli from October 2018 to May 2020

index
2020-05
2020-04
2020-03
2020-02
2020-01
2019-12
2019-11
2019-10
2019-09
2019-08
2019-07
2019-06
2019-05
2019-04
2019-03
2019-02
2019-01
2018-12
2018-11
2018-10
pm25
24 (Moderate)
31 (Moderate)
35 (Unhealthy for Sensitive Groups)
48 (Unhealthy for Sensitive Groups)
48 (Unhealthy for Sensitive Groups)
65 (Unhealthy)
38 (Unhealthy for Sensitive Groups)
25 (Moderate)
31 (Moderate)
27 (Moderate)
19 (Moderate)
19 (Moderate)
29 (Moderate)
26 (Moderate)
42 (Unhealthy for Sensitive Groups)
45 (Unhealthy for Sensitive Groups)
68 (Unhealthy)
43 (Unhealthy for Sensitive Groups)
41 (Unhealthy for Sensitive Groups)
39 (Unhealthy for Sensitive Groups)
co
567 (Good)
584 (Good)
590 (Good)
860 (Good)
1 (Good)
942 (Good)
704 (Good)
604 (Good)
549 (Good)
595 (Good)
594 (Good)
745 (Good)
690 (Good)
742 (Good)
797 (Good)
1 (Good)
1 (Good)
912 (Good)
765 (Good)
830 (Good)
no2
33 (Good)
41 (Moderate)
34 (Good)
20 (Good)
35 (Good)
47 (Moderate)
41 (Moderate)
34 (Good)
38 (Good)
34 (Good)
29 (Good)
30 (Good)
34 (Good)
34 (Good)
47 (Moderate)
28 (Good)
41 (Moderate)
34 (Good)
36 (Good)
32 (Good)
o3
173 (Unhealthy)
105 (Moderate)
96 (Moderate)
64 (Good)
34 (Good)
30 (Good)
36 (Good)
74 (Moderate)
128 (Unhealthy for Sensitive Groups)
187 (Very Unhealthy)
155 (Unhealthy)
121 (Unhealthy for Sensitive Groups)
108 (Moderate)
133 (Unhealthy for Sensitive Groups)
86 (Moderate)
69 (Good)
45 (Good)
33 (Good)
45 (Good)
48 (Good)
pm10
48 (Moderate)
52 (Unhealthy for Sensitive Groups)
57 (Unhealthy for Sensitive Groups)
59 (Unhealthy for Sensitive Groups)
61 (Unhealthy for Sensitive Groups)
79 (Unhealthy for Sensitive Groups)
51 (Unhealthy for Sensitive Groups)
33 (Moderate)
47 (Moderate)
50 (Moderate)
37 (Moderate)
35 (Moderate)
44 (Moderate)
44 (Moderate)
55 (Unhealthy for Sensitive Groups)
55 (Unhealthy for Sensitive Groups)
82 (Unhealthy)
56 (Unhealthy for Sensitive Groups)
52 (Unhealthy for Sensitive Groups)
49 (Moderate)
so2
7.4 (Good)
6.5 (Good)
6.1 (Good)
6 (Good)
6.1 (Good)
8.9 (Good)
6.7 (Good)
4.3 (Good)
8.4 (Good)
8.8 (Good)
5.5 (Good)
5.2 (Good)
4.6 (Good)
7.9 (Good)
8.3 (Good)
9.4 (Good)
7.8 (Good)
7.8 (Good)
7.6 (Good)
7 (Good)
data source »
唐家沱
Friday, May 27, 2022, 12:00 PM
PM10 6.7 (Good)
particulate matter (PM10) suspended dust
PM2,5 1.7 (Good)
particulate matter (PM2.5) dust
CO 100 (Good)
carbon monoxide (CO)
NO2 7.6 (Good)
nitrogen dioxide (NO2)
O3 0.02 (Good)
ozone (O3)
SO2 8.6 (Good)
sulfur dioxide (SO2)
唐家沱
index
2022-05-27
pm10
32
pm25
24
co
468
no2
21
o3
32
so2
4.6
唐家沱
2018-10 2020-05

index
2020-05
2020-04
2020-03
2020-02
2020-01
2019-12
2019-11
2019-10
2019-09
2019-08
2019-07
2019-06
2019-05
2019-04
2019-03
2019-02
2019-01
2018-12
2018-11
2018-10
pm25
24
31
35
48
48
65
38
25
31
27
19
19
29
26
42
45
68
43
41
39
co
567
584
590
860
1
942
704
604
549
595
594
745
690
742
797
1
1
912
765
830
no2
33
41
34
20
35
47
41
34
38
34
29
30
34
34
47
28
41
34
36
32
o3
173
105
96
64
34
30
36
74
128
187
155
121
108
133
86
69
45
33
45
48
pm10
48
52
57
59
61
79
51
33
47
50
37
35
44
44
55
55
82
56
52
49
so2
7.4
6.5
6.1
6
6.1
8.9
6.7
4.3
8.4
8.8
5.5
5.2
4.6
7.9
8.3
9.4
7.8
7.8
7.6
7
* Pollution data source:
https://openaq.org
(ChinaAQIData)
The data is licensed under CC-By 4.0
PM10 7 (Good)
PM2,5 2 (Good)
CO 100 (Good)
NO2 8 (Good)
O3 0 (Good)
SO2 9 (Good)
Data on air pollution from recent days in Shengli
| index | 2022-05-27 |
|---|---|
| pm10 | 32 Moderate |
| pm25 | 24 Moderate |
| co | 468 Good |
| no2 | 21 Good |
| o3 | 32 Good |
| so2 | 5 Good |
| index | 2020-05 | 2020-04 | 2020-03 | 2020-02 | 2020-01 | 2019-12 | 2019-11 | 2019-10 | 2019-09 | 2019-08 | 2019-07 | 2019-06 | 2019-05 | 2019-04 | 2019-03 | 2019-02 | 2019-01 | 2018-12 | 2018-11 | 2018-10 |
|---|---|---|---|---|---|---|---|---|---|---|---|---|---|---|---|---|---|---|---|---|
| pm25 | 24 (Moderate) | 31 (Moderate) | 35 (Unhealthy for Sensitive Groups) | 48 (Unhealthy for Sensitive Groups) | 48 (Unhealthy for Sensitive Groups) | 65 (Unhealthy) | 38 (Unhealthy for Sensitive Groups) | 25 (Moderate) | 31 (Moderate) | 27 (Moderate) | 19 (Moderate) | 19 (Moderate) | 29 (Moderate) | 26 (Moderate) | 42 (Unhealthy for Sensitive Groups) | 45 (Unhealthy for Sensitive Groups) | 68 (Unhealthy) | 43 (Unhealthy for Sensitive Groups) | 41 (Unhealthy for Sensitive Groups) | 39 (Unhealthy for Sensitive Groups) |
| co | 567 (Good) | 584 (Good) | 590 (Good) | 860 (Good) | 1 (Good) | 942 (Good) | 704 (Good) | 604 (Good) | 549 (Good) | 595 (Good) | 594 (Good) | 745 (Good) | 690 (Good) | 742 (Good) | 797 (Good) | 1 (Good) | 1 (Good) | 912 (Good) | 765 (Good) | 830 (Good) |
| no2 | 33 (Good) | 41 (Moderate) | 34 (Good) | 20 (Good) | 35 (Good) | 47 (Moderate) | 41 (Moderate) | 34 (Good) | 38 (Good) | 34 (Good) | 29 (Good) | 30 (Good) | 34 (Good) | 34 (Good) | 47 (Moderate) | 28 (Good) | 41 (Moderate) | 34 (Good) | 36 (Good) | 32 (Good) |
| o3 | 173 (Unhealthy) | 105 (Moderate) | 96 (Moderate) | 64 (Good) | 34 (Good) | 30 (Good) | 36 (Good) | 74 (Moderate) | 128 (Unhealthy for Sensitive Groups) | 187 (Very Unhealthy) | 155 (Unhealthy) | 121 (Unhealthy for Sensitive Groups) | 108 (Moderate) | 133 (Unhealthy for Sensitive Groups) | 86 (Moderate) | 69 (Good) | 45 (Good) | 33 (Good) | 45 (Good) | 48 (Good) |
| pm10 | 48 (Moderate) | 52 (Unhealthy for Sensitive Groups) | 57 (Unhealthy for Sensitive Groups) | 59 (Unhealthy for Sensitive Groups) | 61 (Unhealthy for Sensitive Groups) | 79 (Unhealthy for Sensitive Groups) | 51 (Unhealthy for Sensitive Groups) | 33 (Moderate) | 47 (Moderate) | 50 (Moderate) | 37 (Moderate) | 35 (Moderate) | 44 (Moderate) | 44 (Moderate) | 55 (Unhealthy for Sensitive Groups) | 55 (Unhealthy for Sensitive Groups) | 82 (Unhealthy) | 56 (Unhealthy for Sensitive Groups) | 52 (Unhealthy for Sensitive Groups) | 49 (Moderate) |
| so2 | 7.4 (Good) | 6.5 (Good) | 6.1 (Good) | 6 (Good) | 6.1 (Good) | 8.9 (Good) | 6.7 (Good) | 4.3 (Good) | 8.4 (Good) | 8.8 (Good) | 5.5 (Good) | 5.2 (Good) | 4.6 (Good) | 7.9 (Good) | 8.3 (Good) | 9.4 (Good) | 7.8 (Good) | 7.8 (Good) | 7.6 (Good) | 7 (Good) |
PM10 6.7 (Good)
particulate matter (PM10) suspended dustPM2,5 1.7 (Good)
particulate matter (PM2.5) dustCO 100 (Good)
carbon monoxide (CO)NO2 7.6 (Good)
nitrogen dioxide (NO2)O3 0.02 (Good)
ozone (O3)SO2 8.6 (Good)
sulfur dioxide (SO2)唐家沱
| index | 2022-05-27 |
|---|---|
| pm10 | 32 |
| pm25 | 24 |
| co | 468 |
| no2 | 21 |
| o3 | 32 |
| so2 | 4.6 |
唐家沱

| index | 2020-05 | 2020-04 | 2020-03 | 2020-02 | 2020-01 | 2019-12 | 2019-11 | 2019-10 | 2019-09 | 2019-08 | 2019-07 | 2019-06 | 2019-05 | 2019-04 | 2019-03 | 2019-02 | 2019-01 | 2018-12 | 2018-11 | 2018-10 |
|---|---|---|---|---|---|---|---|---|---|---|---|---|---|---|---|---|---|---|---|---|
| pm25 | 24 | 31 | 35 | 48 | 48 | 65 | 38 | 25 | 31 | 27 | 19 | 19 | 29 | 26 | 42 | 45 | 68 | 43 | 41 | 39 |
| co | 567 | 584 | 590 | 860 | 1 | 942 | 704 | 604 | 549 | 595 | 594 | 745 | 690 | 742 | 797 | 1 | 1 | 912 | 765 | 830 |
| no2 | 33 | 41 | 34 | 20 | 35 | 47 | 41 | 34 | 38 | 34 | 29 | 30 | 34 | 34 | 47 | 28 | 41 | 34 | 36 | 32 |
| o3 | 173 | 105 | 96 | 64 | 34 | 30 | 36 | 74 | 128 | 187 | 155 | 121 | 108 | 133 | 86 | 69 | 45 | 33 | 45 | 48 |
| pm10 | 48 | 52 | 57 | 59 | 61 | 79 | 51 | 33 | 47 | 50 | 37 | 35 | 44 | 44 | 55 | 55 | 82 | 56 | 52 | 49 |
| so2 | 7.4 | 6.5 | 6.1 | 6 | 6.1 | 8.9 | 6.7 | 4.3 | 8.4 | 8.8 | 5.5 | 5.2 | 4.6 | 7.9 | 8.3 | 9.4 | 7.8 | 7.8 | 7.6 | 7 |