Air Pollution in Liaogongzhuangcun: Real-time Air Quality Index and smog alert.
Pollution and air quality forecast for Liaogongzhuangcun. Today is Saturday, June 13, 2026. The following air pollution values have been recorded for Liaogongzhuangcun:- nitrogen dioxide (NO2) - 7 (Good)
- particulate matter (PM10) suspended dust - 19 (Good)
- ozone (O3) - 91 (Moderate)
- particulate matter (PM2.5) dust - 10 (Good)
- sulfur dioxide (SO2) - 0 (Good)
- carbon monoxide (CO) - 100 (Good)

What is the air quality in Liaogongzhuangcun today? Is the air polluted in Liaogongzhuangcun?. Is there smog?
How high is the level of NO2? (nitrogen dioxide (NO2))
7 (Good)
What is the level of PM10 today in Liaogongzhuangcun? (particulate matter (PM10) suspended dust)
The current level of particulate matter PM10 in Liaogongzhuangcun is:
19 (Good)
The highest PM10 values usually occur in month: 105 (November 2018).
The lowest value of particulate matter PM10 pollution in Liaogongzhuangcun is usually recorded in: August (41).
How is the O3 level today in Liaogongzhuangcun? (ozone (O3))
91 (Moderate)
What is the current level of PM2.5 in Liaogongzhuangcun? (particulate matter (PM2.5) dust)
Today's PM2.5 level is:
10 (Good)
For comparison, the highest level of PM2.5 in Liaogongzhuangcun in the last 7 days was: 20 (Friday, May 27, 2022) and the lowest: 20 (Friday, May 27, 2022).
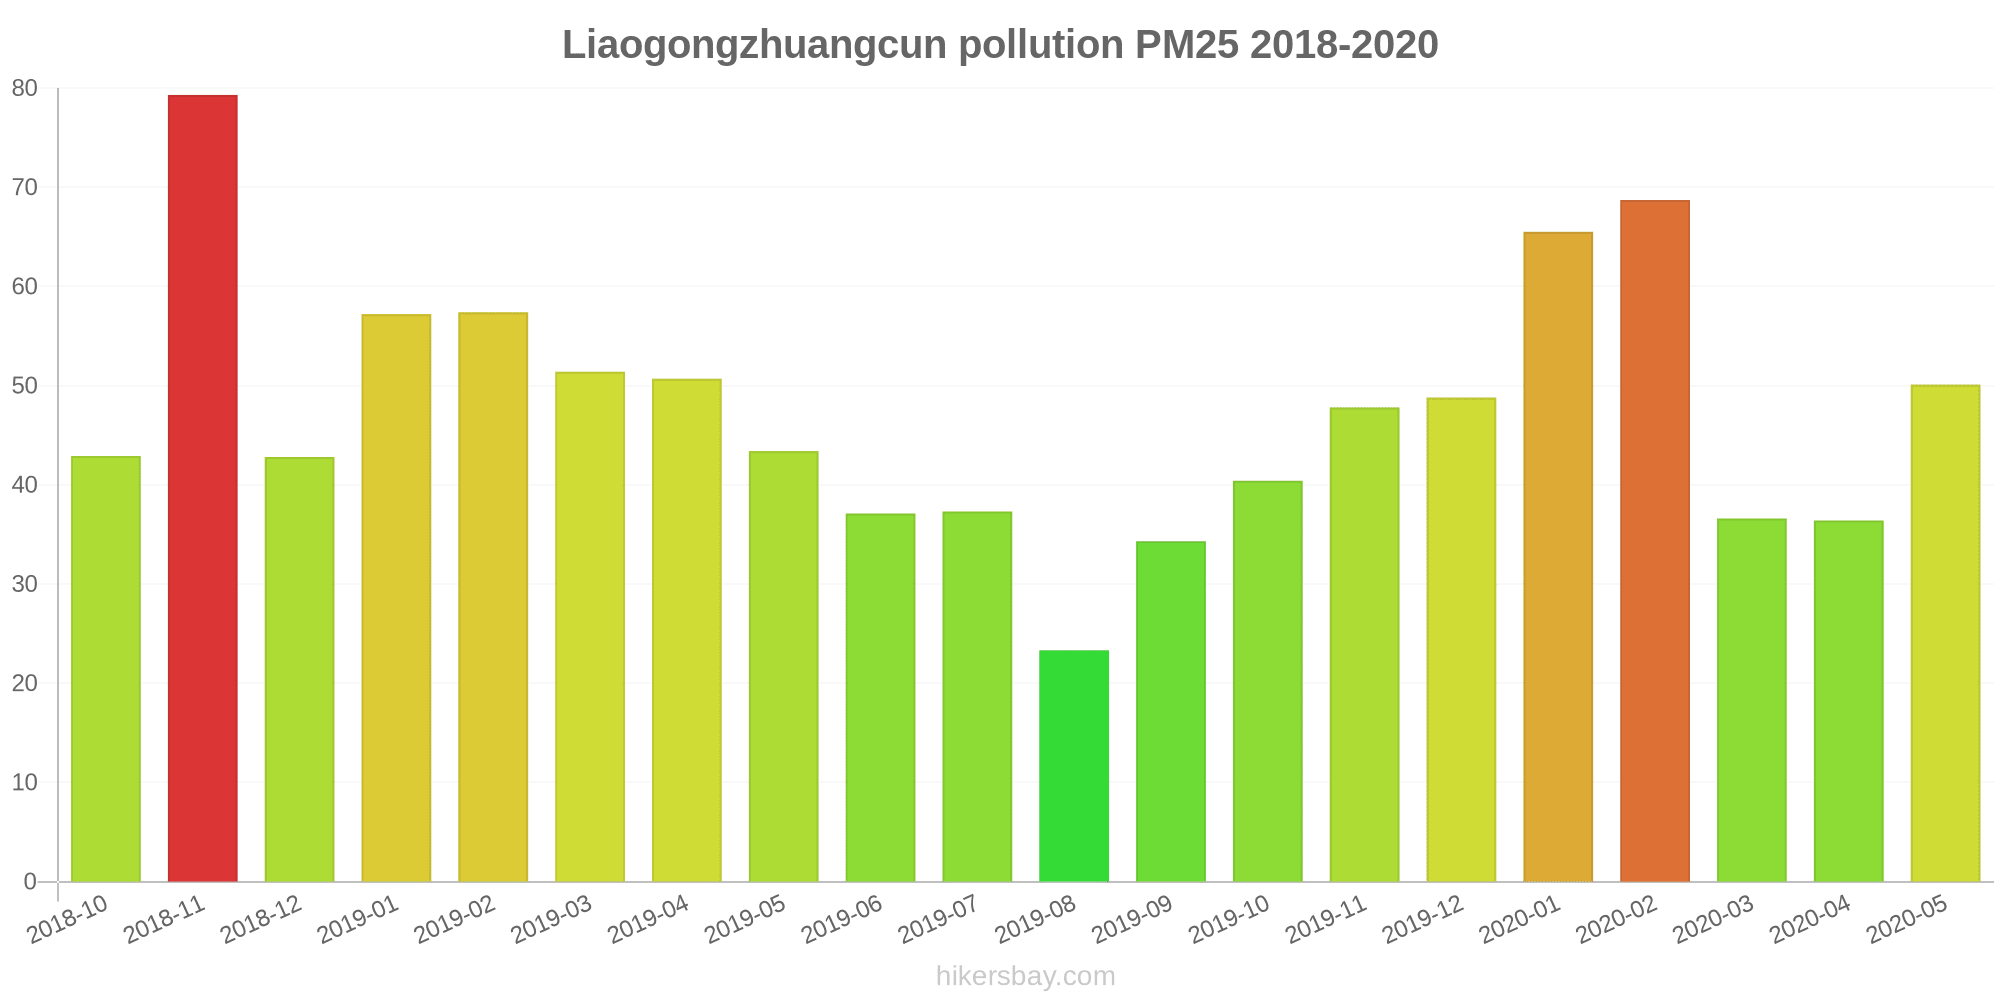
The highest PM2.5 values were recorded: 79 (November 2018).
The lowest level of particulate matter PM2.5 pollution occurs in month: August (23).
What is the level of SO2 pollution? (sulfur dioxide (SO2))
0 (Good)
How high is the CO level? (carbon monoxide (CO))
100 (Good)
Current data Friday, May 27, 2022, 12:00 PM
NO2 7 (Good)
PM10 19 (Good)
O3 91 (Moderate)
PM2,5 10 (Good)
SO2 0 (Good)
CO 100 (Good)
Data on air pollution from recent days in Liaogongzhuangcun
index
2022-05-27
no2
20
Good
pm10
27
Moderate
o3
39
Good
pm25
20
Moderate
so2
5
Good
co
240
Good
data source »
Air pollution in Liaogongzhuangcun from October 2018 to May 2020

index
2020-05
2020-04
2020-03
2020-02
2020-01
2019-12
2019-11
2019-10
2019-09
2019-08
2019-07
2019-06
2019-05
2019-04
2019-03
2019-02
2019-01
2018-12
2018-11
2018-10
pm25
50 (Unhealthy for Sensitive Groups)
36 (Unhealthy for Sensitive Groups)
37 (Unhealthy for Sensitive Groups)
69 (Unhealthy)
66 (Unhealthy)
49 (Unhealthy for Sensitive Groups)
48 (Unhealthy for Sensitive Groups)
40 (Unhealthy for Sensitive Groups)
34 (Moderate)
23 (Moderate)
37 (Unhealthy for Sensitive Groups)
37 (Unhealthy for Sensitive Groups)
43 (Unhealthy for Sensitive Groups)
51 (Unhealthy for Sensitive Groups)
51 (Unhealthy for Sensitive Groups)
57 (Unhealthy)
57 (Unhealthy)
43 (Unhealthy for Sensitive Groups)
79 (Very Unhealthy)
43 (Unhealthy for Sensitive Groups)
co
610 (Good)
395 (Good)
491 (Good)
873 (Good)
992 (Good)
803 (Good)
758 (Good)
630 (Good)
642 (Good)
554 (Good)
655 (Good)
635 (Good)
455 (Good)
499 (Good)
548 (Good)
755 (Good)
929 (Good)
831 (Good)
1 (Good)
784 (Good)
no2
22 (Good)
25 (Good)
24 (Good)
22 (Good)
38 (Good)
47 (Moderate)
50 (Moderate)
42 (Moderate)
31 (Good)
29 (Good)
32 (Good)
29 (Good)
38 (Good)
34 (Good)
37 (Good)
33 (Good)
50 (Moderate)
45 (Moderate)
66 (Moderate)
60 (Moderate)
o3
144 (Unhealthy for Sensitive Groups)
126 (Unhealthy for Sensitive Groups)
89 (Moderate)
75 (Moderate)
61 (Good)
47 (Good)
43 (Good)
81 (Moderate)
171 (Unhealthy)
134 (Unhealthy for Sensitive Groups)
177 (Unhealthy)
192 (Very Unhealthy)
156 (Unhealthy)
123 (Unhealthy for Sensitive Groups)
107 (Moderate)
73 (Moderate)
56 (Good)
53 (Good)
57 (Good)
90 (Moderate)
pm10
69 (Unhealthy for Sensitive Groups)
72 (Unhealthy for Sensitive Groups)
58 (Unhealthy for Sensitive Groups)
60 (Unhealthy for Sensitive Groups)
70 (Unhealthy for Sensitive Groups)
68 (Unhealthy for Sensitive Groups)
91 (Unhealthy)
78 (Unhealthy for Sensitive Groups)
61 (Unhealthy for Sensitive Groups)
41 (Moderate)
52 (Unhealthy for Sensitive Groups)
63 (Unhealthy for Sensitive Groups)
90 (Unhealthy)
97 (Unhealthy)
88 (Unhealthy)
75 (Unhealthy for Sensitive Groups)
78 (Unhealthy for Sensitive Groups)
73 (Unhealthy for Sensitive Groups)
105 (Unhealthy)
60 (Unhealthy for Sensitive Groups)
so2
3.1 (Good)
3.6 (Good)
3.7 (Good)
3.3 (Good)
5.8 (Good)
3.3 (Good)
3.5 (Good)
2.7 (Good)
2.5 (Good)
3 (Good)
2.3 (Good)
3.7 (Good)
4.3 (Good)
4.5 (Good)
5.6 (Good)
5.9 (Good)
8.6 (Good)
5.9 (Good)
5.5 (Good)
3.2 (Good)
data source »
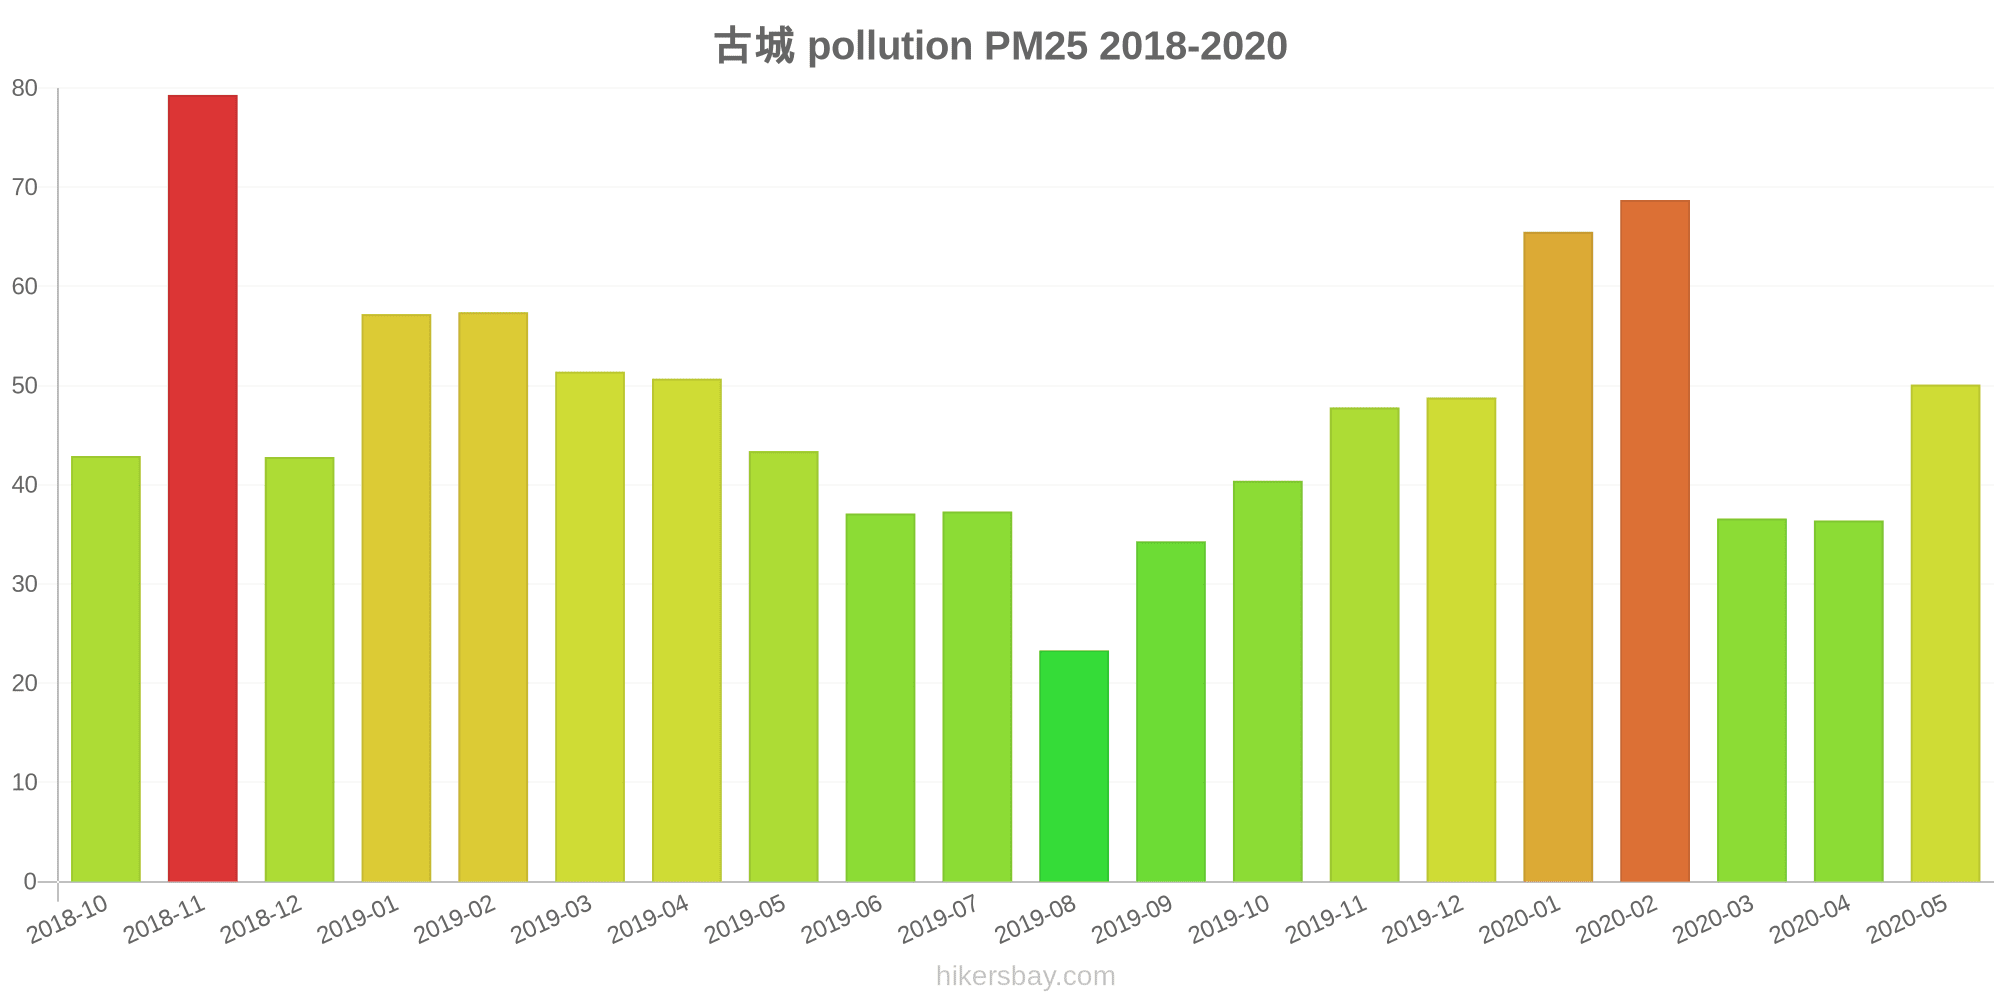
古城
Friday, May 27, 2022, 12:00 PM
NO2 7.3 (Good)
nitrogen dioxide (NO2)
PM10 19 (Good)
particulate matter (PM10) suspended dust
O3 91 (Moderate)
ozone (O3)
PM2,5 10 (Good)
particulate matter (PM2.5) dust
SO2 0.1 (Good)
sulfur dioxide (SO2)
CO 100 (Good)
carbon monoxide (CO)
古城
index
2022-05-27
no2
20
pm10
27
o3
39
pm25
20
so2
4.9
co
240
古城
2018-10 2020-05

index
2020-05
2020-04
2020-03
2020-02
2020-01
2019-12
2019-11
2019-10
2019-09
2019-08
2019-07
2019-06
2019-05
2019-04
2019-03
2019-02
2019-01
2018-12
2018-11
2018-10
pm25
50
36
37
69
66
49
48
40
34
23
37
37
43
51
51
57
57
43
79
43
co
610
395
491
873
992
803
758
630
642
554
655
635
455
499
548
755
929
831
1
784
no2
22
25
24
22
38
47
50
42
31
29
32
29
38
34
37
33
50
45
66
60
o3
144
126
89
75
61
47
43
81
171
134
177
192
156
123
107
73
56
53
57
90
pm10
69
72
58
60
70
68
91
78
61
41
52
63
90
97
88
75
78
73
105
60
so2
3.1
3.6
3.7
3.3
5.8
3.3
3.5
2.7
2.5
3
2.3
3.7
4.3
4.5
5.6
5.9
8.6
5.9
5.5
3.2
* Pollution data source:
https://openaq.org
(ChinaAQIData)
The data is licensed under CC-By 4.0
NO2 7 (Good)
PM10 19 (Good)
O3 91 (Moderate)
PM2,5 10 (Good)
SO2 0 (Good)
CO 100 (Good)
Data on air pollution from recent days in Liaogongzhuangcun
| index | 2022-05-27 |
|---|---|
| no2 | 20 Good |
| pm10 | 27 Moderate |
| o3 | 39 Good |
| pm25 | 20 Moderate |
| so2 | 5 Good |
| co | 240 Good |
| index | 2020-05 | 2020-04 | 2020-03 | 2020-02 | 2020-01 | 2019-12 | 2019-11 | 2019-10 | 2019-09 | 2019-08 | 2019-07 | 2019-06 | 2019-05 | 2019-04 | 2019-03 | 2019-02 | 2019-01 | 2018-12 | 2018-11 | 2018-10 |
|---|---|---|---|---|---|---|---|---|---|---|---|---|---|---|---|---|---|---|---|---|
| pm25 | 50 (Unhealthy for Sensitive Groups) | 36 (Unhealthy for Sensitive Groups) | 37 (Unhealthy for Sensitive Groups) | 69 (Unhealthy) | 66 (Unhealthy) | 49 (Unhealthy for Sensitive Groups) | 48 (Unhealthy for Sensitive Groups) | 40 (Unhealthy for Sensitive Groups) | 34 (Moderate) | 23 (Moderate) | 37 (Unhealthy for Sensitive Groups) | 37 (Unhealthy for Sensitive Groups) | 43 (Unhealthy for Sensitive Groups) | 51 (Unhealthy for Sensitive Groups) | 51 (Unhealthy for Sensitive Groups) | 57 (Unhealthy) | 57 (Unhealthy) | 43 (Unhealthy for Sensitive Groups) | 79 (Very Unhealthy) | 43 (Unhealthy for Sensitive Groups) |
| co | 610 (Good) | 395 (Good) | 491 (Good) | 873 (Good) | 992 (Good) | 803 (Good) | 758 (Good) | 630 (Good) | 642 (Good) | 554 (Good) | 655 (Good) | 635 (Good) | 455 (Good) | 499 (Good) | 548 (Good) | 755 (Good) | 929 (Good) | 831 (Good) | 1 (Good) | 784 (Good) |
| no2 | 22 (Good) | 25 (Good) | 24 (Good) | 22 (Good) | 38 (Good) | 47 (Moderate) | 50 (Moderate) | 42 (Moderate) | 31 (Good) | 29 (Good) | 32 (Good) | 29 (Good) | 38 (Good) | 34 (Good) | 37 (Good) | 33 (Good) | 50 (Moderate) | 45 (Moderate) | 66 (Moderate) | 60 (Moderate) |
| o3 | 144 (Unhealthy for Sensitive Groups) | 126 (Unhealthy for Sensitive Groups) | 89 (Moderate) | 75 (Moderate) | 61 (Good) | 47 (Good) | 43 (Good) | 81 (Moderate) | 171 (Unhealthy) | 134 (Unhealthy for Sensitive Groups) | 177 (Unhealthy) | 192 (Very Unhealthy) | 156 (Unhealthy) | 123 (Unhealthy for Sensitive Groups) | 107 (Moderate) | 73 (Moderate) | 56 (Good) | 53 (Good) | 57 (Good) | 90 (Moderate) |
| pm10 | 69 (Unhealthy for Sensitive Groups) | 72 (Unhealthy for Sensitive Groups) | 58 (Unhealthy for Sensitive Groups) | 60 (Unhealthy for Sensitive Groups) | 70 (Unhealthy for Sensitive Groups) | 68 (Unhealthy for Sensitive Groups) | 91 (Unhealthy) | 78 (Unhealthy for Sensitive Groups) | 61 (Unhealthy for Sensitive Groups) | 41 (Moderate) | 52 (Unhealthy for Sensitive Groups) | 63 (Unhealthy for Sensitive Groups) | 90 (Unhealthy) | 97 (Unhealthy) | 88 (Unhealthy) | 75 (Unhealthy for Sensitive Groups) | 78 (Unhealthy for Sensitive Groups) | 73 (Unhealthy for Sensitive Groups) | 105 (Unhealthy) | 60 (Unhealthy for Sensitive Groups) |
| so2 | 3.1 (Good) | 3.6 (Good) | 3.7 (Good) | 3.3 (Good) | 5.8 (Good) | 3.3 (Good) | 3.5 (Good) | 2.7 (Good) | 2.5 (Good) | 3 (Good) | 2.3 (Good) | 3.7 (Good) | 4.3 (Good) | 4.5 (Good) | 5.6 (Good) | 5.9 (Good) | 8.6 (Good) | 5.9 (Good) | 5.5 (Good) | 3.2 (Good) |
NO2 7.3 (Good)
nitrogen dioxide (NO2)PM10 19 (Good)
particulate matter (PM10) suspended dustO3 91 (Moderate)
ozone (O3)PM2,5 10 (Good)
particulate matter (PM2.5) dustSO2 0.1 (Good)
sulfur dioxide (SO2)CO 100 (Good)
carbon monoxide (CO)古城
| index | 2022-05-27 |
|---|---|
| no2 | 20 |
| pm10 | 27 |
| o3 | 39 |
| pm25 | 20 |
| so2 | 4.9 |
| co | 240 |
古城
| index | 2020-05 | 2020-04 | 2020-03 | 2020-02 | 2020-01 | 2019-12 | 2019-11 | 2019-10 | 2019-09 | 2019-08 | 2019-07 | 2019-06 | 2019-05 | 2019-04 | 2019-03 | 2019-02 | 2019-01 | 2018-12 | 2018-11 | 2018-10 |
|---|---|---|---|---|---|---|---|---|---|---|---|---|---|---|---|---|---|---|---|---|
| pm25 | 50 | 36 | 37 | 69 | 66 | 49 | 48 | 40 | 34 | 23 | 37 | 37 | 43 | 51 | 51 | 57 | 57 | 43 | 79 | 43 |
| co | 610 | 395 | 491 | 873 | 992 | 803 | 758 | 630 | 642 | 554 | 655 | 635 | 455 | 499 | 548 | 755 | 929 | 831 | 1 | 784 |
| no2 | 22 | 25 | 24 | 22 | 38 | 47 | 50 | 42 | 31 | 29 | 32 | 29 | 38 | 34 | 37 | 33 | 50 | 45 | 66 | 60 |
| o3 | 144 | 126 | 89 | 75 | 61 | 47 | 43 | 81 | 171 | 134 | 177 | 192 | 156 | 123 | 107 | 73 | 56 | 53 | 57 | 90 |
| pm10 | 69 | 72 | 58 | 60 | 70 | 68 | 91 | 78 | 61 | 41 | 52 | 63 | 90 | 97 | 88 | 75 | 78 | 73 | 105 | 60 |
| so2 | 3.1 | 3.6 | 3.7 | 3.3 | 5.8 | 3.3 | 3.5 | 2.7 | 2.5 | 3 | 2.3 | 3.7 | 4.3 | 4.5 | 5.6 | 5.9 | 8.6 | 5.9 | 5.5 | 3.2 |