Air Pollution in Taiyanggongcun: Real-time Air Quality Index and smog alert.
Pollution and air quality forecast for Taiyanggongcun. Today is Saturday, June 13, 2026. The following air pollution values have been recorded for Taiyanggongcun:- nitrogen dioxide (NO2) - 7 (Good)
- particulate matter (PM10) suspended dust - 19 (Good)
- ozone (O3) - 91 (Moderate)
- particulate matter (PM2.5) dust - 10 (Good)
- sulfur dioxide (SO2) - 0 (Good)
- carbon monoxide (CO) - 100 (Good)

What is the air quality in Taiyanggongcun today? Is the air polluted in Taiyanggongcun?. Is there smog?
How high is the level of NO2? (nitrogen dioxide (NO2))
7 (Good)
What is the level of PM10 today in Taiyanggongcun? (particulate matter (PM10) suspended dust)
The current level of particulate matter PM10 in Taiyanggongcun is:
19 (Good)
The highest PM10 values usually occur in month: 112 (November 2018).
The lowest value of particulate matter PM10 pollution in Taiyanggongcun is usually recorded in: August (42).
How is the O3 level today in Taiyanggongcun? (ozone (O3))
91 (Moderate)
What is the current level of PM2.5 in Taiyanggongcun? (particulate matter (PM2.5) dust)
Today's PM2.5 level is:
10 (Good)
For comparison, the highest level of PM2.5 in Taiyanggongcun in the last 7 days was: 20 (Friday, May 27, 2022) and the lowest: 20 (Friday, May 27, 2022).
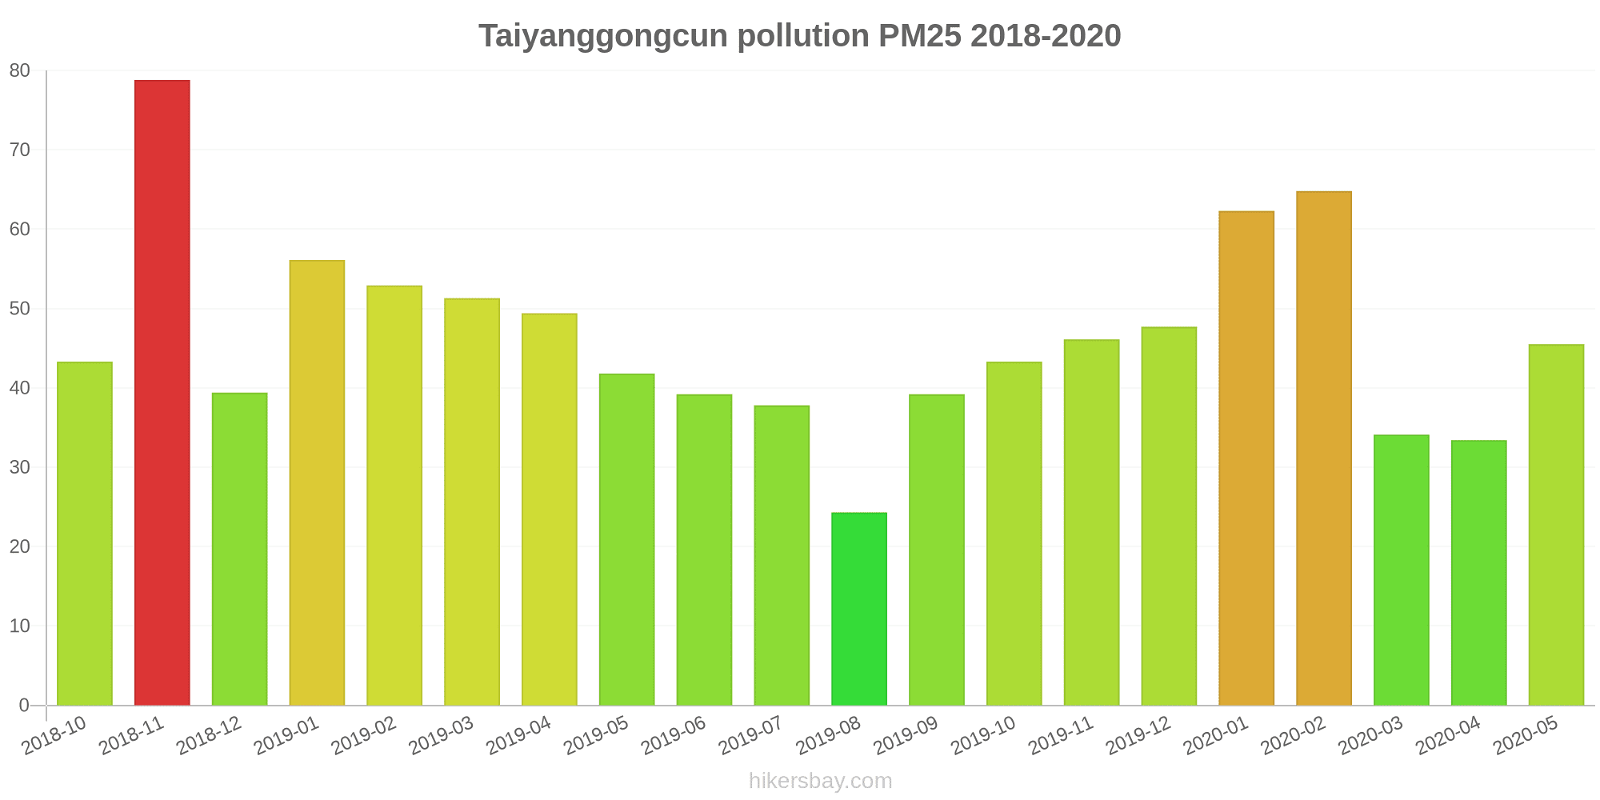
The highest PM2.5 values were recorded: 79 (November 2018).
The lowest level of particulate matter PM2.5 pollution occurs in month: August (24).
What is the level of SO2 pollution? (sulfur dioxide (SO2))
0 (Good)
How high is the CO level? (carbon monoxide (CO))
100 (Good)
Current data Friday, May 27, 2022, 12:00 PM
NO2 7 (Good)
PM10 19 (Good)
O3 91 (Moderate)
PM2,5 10 (Good)
SO2 0 (Good)
CO 100 (Good)
Data on air pollution from recent days in Taiyanggongcun
index
2022-05-27
no2
20
Good
pm10
27
Moderate
o3
39
Good
pm25
20
Moderate
so2
5
Good
co
240
Good
data source »
Air pollution in Taiyanggongcun from October 2018 to May 2020
index
2020-05
2020-04
2020-03
2020-02
2020-01
2019-12
2019-11
2019-10
2019-09
2019-08
2019-07
2019-06
2019-05
2019-04
2019-03
2019-02
2019-01
2018-12
2018-11
2018-10
pm25
46 (Unhealthy for Sensitive Groups)
33 (Moderate)
34 (Moderate)
65 (Unhealthy)
62 (Unhealthy)
48 (Unhealthy for Sensitive Groups)
46 (Unhealthy for Sensitive Groups)
43 (Unhealthy for Sensitive Groups)
39 (Unhealthy for Sensitive Groups)
24 (Moderate)
38 (Unhealthy for Sensitive Groups)
39 (Unhealthy for Sensitive Groups)
42 (Unhealthy for Sensitive Groups)
49 (Unhealthy for Sensitive Groups)
51 (Unhealthy for Sensitive Groups)
53 (Unhealthy for Sensitive Groups)
56 (Unhealthy)
39 (Unhealthy for Sensitive Groups)
79 (Very Unhealthy)
43 (Unhealthy for Sensitive Groups)
co
729 (Good)
444 (Good)
531 (Good)
1 (Good)
951 (Good)
919 (Good)
924 (Good)
774 (Good)
761 (Good)
593 (Good)
674 (Good)
788 (Good)
540 (Good)
616 (Good)
709 (Good)
757 (Good)
1 (Good)
796 (Good)
1 (Good)
732 (Good)
no2
23 (Good)
25 (Good)
25 (Good)
29 (Good)
40 (Moderate)
45 (Moderate)
47 (Moderate)
45 (Moderate)
36 (Good)
28 (Good)
28 (Good)
29 (Good)
35 (Good)
36 (Good)
41 (Moderate)
38 (Good)
53 (Moderate)
45 (Moderate)
62 (Moderate)
50 (Moderate)
o3
149 (Unhealthy for Sensitive Groups)
134 (Unhealthy for Sensitive Groups)
92 (Moderate)
72 (Moderate)
59 (Good)
45 (Good)
41 (Good)
69 (Good)
194 (Very Unhealthy)
154 (Unhealthy)
192 (Very Unhealthy)
211 (Very Unhealthy)
172 (Unhealthy)
113 (Moderate)
95 (Moderate)
85 (Moderate)
57 (Good)
47 (Good)
54 (Good)
77 (Moderate)
pm10
65 (Unhealthy for Sensitive Groups)
69 (Unhealthy for Sensitive Groups)
55 (Unhealthy for Sensitive Groups)
60 (Unhealthy for Sensitive Groups)
68 (Unhealthy for Sensitive Groups)
64 (Unhealthy for Sensitive Groups)
82 (Unhealthy)
74 (Unhealthy for Sensitive Groups)
65 (Unhealthy for Sensitive Groups)
42 (Moderate)
56 (Unhealthy for Sensitive Groups)
62 (Unhealthy for Sensitive Groups)
74 (Unhealthy for Sensitive Groups)
94 (Unhealthy)
80 (Unhealthy)
80 (Unhealthy for Sensitive Groups)
86 (Unhealthy)
78 (Unhealthy for Sensitive Groups)
112 (Very Unhealthy)
71 (Unhealthy for Sensitive Groups)
so2
3.5 (Good)
4.1 (Good)
4.9 (Good)
5.6 (Good)
7.7 (Good)
5.1 (Good)
7 (Good)
4.8 (Good)
3.7 (Good)
2.7 (Good)
2.4 (Good)
4.8 (Good)
4.5 (Good)
5.2 (Good)
6.1 (Good)
7.4 (Good)
9.9 (Good)
6.4 (Good)
8.3 (Good)
4.3 (Good)
data source »
东四
Friday, May 27, 2022, 12:00 PM
NO2 7.3 (Good)
nitrogen dioxide (NO2)
PM10 19 (Good)
particulate matter (PM10) suspended dust
O3 91 (Moderate)
ozone (O3)
PM2,5 10 (Good)
particulate matter (PM2.5) dust
SO2 0.1 (Good)
sulfur dioxide (SO2)
CO 100 (Good)
carbon monoxide (CO)
东四
index
2022-05-27
no2
20
pm10
27
o3
39
pm25
20
so2
4.9
co
240
东四
2018-10 2020-05

index
2020-05
2020-04
2020-03
2020-02
2020-01
2019-12
2019-11
2019-10
2019-09
2019-08
2019-07
2019-06
2019-05
2019-04
2019-03
2019-02
2019-01
2018-12
2018-11
2018-10
pm25
46
33
34
65
62
48
46
43
39
24
38
39
42
49
51
53
56
39
79
43
co
729
444
531
1
951
919
924
774
761
593
674
788
540
616
709
757
1
796
1
732
no2
23
25
25
29
40
45
47
45
36
28
28
29
35
36
41
38
53
45
62
50
o3
149
134
92
72
59
45
41
69
194
154
192
211
172
113
95
85
57
47
54
77
pm10
65
69
55
60
68
64
82
74
65
42
56
62
74
94
80
80
86
78
112
71
so2
3.5
4.1
4.9
5.6
7.7
5.1
7
4.8
3.7
2.7
2.4
4.8
4.5
5.2
6.1
7.4
9.9
6.4
8.3
4.3
* Pollution data source:
https://openaq.org
(ChinaAQIData)
The data is licensed under CC-By 4.0
NO2 7 (Good)
PM10 19 (Good)
O3 91 (Moderate)
PM2,5 10 (Good)
SO2 0 (Good)
CO 100 (Good)
Data on air pollution from recent days in Taiyanggongcun
| index | 2022-05-27 |
|---|---|
| no2 | 20 Good |
| pm10 | 27 Moderate |
| o3 | 39 Good |
| pm25 | 20 Moderate |
| so2 | 5 Good |
| co | 240 Good |

| index | 2020-05 | 2020-04 | 2020-03 | 2020-02 | 2020-01 | 2019-12 | 2019-11 | 2019-10 | 2019-09 | 2019-08 | 2019-07 | 2019-06 | 2019-05 | 2019-04 | 2019-03 | 2019-02 | 2019-01 | 2018-12 | 2018-11 | 2018-10 |
|---|---|---|---|---|---|---|---|---|---|---|---|---|---|---|---|---|---|---|---|---|
| pm25 | 46 (Unhealthy for Sensitive Groups) | 33 (Moderate) | 34 (Moderate) | 65 (Unhealthy) | 62 (Unhealthy) | 48 (Unhealthy for Sensitive Groups) | 46 (Unhealthy for Sensitive Groups) | 43 (Unhealthy for Sensitive Groups) | 39 (Unhealthy for Sensitive Groups) | 24 (Moderate) | 38 (Unhealthy for Sensitive Groups) | 39 (Unhealthy for Sensitive Groups) | 42 (Unhealthy for Sensitive Groups) | 49 (Unhealthy for Sensitive Groups) | 51 (Unhealthy for Sensitive Groups) | 53 (Unhealthy for Sensitive Groups) | 56 (Unhealthy) | 39 (Unhealthy for Sensitive Groups) | 79 (Very Unhealthy) | 43 (Unhealthy for Sensitive Groups) |
| co | 729 (Good) | 444 (Good) | 531 (Good) | 1 (Good) | 951 (Good) | 919 (Good) | 924 (Good) | 774 (Good) | 761 (Good) | 593 (Good) | 674 (Good) | 788 (Good) | 540 (Good) | 616 (Good) | 709 (Good) | 757 (Good) | 1 (Good) | 796 (Good) | 1 (Good) | 732 (Good) |
| no2 | 23 (Good) | 25 (Good) | 25 (Good) | 29 (Good) | 40 (Moderate) | 45 (Moderate) | 47 (Moderate) | 45 (Moderate) | 36 (Good) | 28 (Good) | 28 (Good) | 29 (Good) | 35 (Good) | 36 (Good) | 41 (Moderate) | 38 (Good) | 53 (Moderate) | 45 (Moderate) | 62 (Moderate) | 50 (Moderate) |
| o3 | 149 (Unhealthy for Sensitive Groups) | 134 (Unhealthy for Sensitive Groups) | 92 (Moderate) | 72 (Moderate) | 59 (Good) | 45 (Good) | 41 (Good) | 69 (Good) | 194 (Very Unhealthy) | 154 (Unhealthy) | 192 (Very Unhealthy) | 211 (Very Unhealthy) | 172 (Unhealthy) | 113 (Moderate) | 95 (Moderate) | 85 (Moderate) | 57 (Good) | 47 (Good) | 54 (Good) | 77 (Moderate) |
| pm10 | 65 (Unhealthy for Sensitive Groups) | 69 (Unhealthy for Sensitive Groups) | 55 (Unhealthy for Sensitive Groups) | 60 (Unhealthy for Sensitive Groups) | 68 (Unhealthy for Sensitive Groups) | 64 (Unhealthy for Sensitive Groups) | 82 (Unhealthy) | 74 (Unhealthy for Sensitive Groups) | 65 (Unhealthy for Sensitive Groups) | 42 (Moderate) | 56 (Unhealthy for Sensitive Groups) | 62 (Unhealthy for Sensitive Groups) | 74 (Unhealthy for Sensitive Groups) | 94 (Unhealthy) | 80 (Unhealthy) | 80 (Unhealthy for Sensitive Groups) | 86 (Unhealthy) | 78 (Unhealthy for Sensitive Groups) | 112 (Very Unhealthy) | 71 (Unhealthy for Sensitive Groups) |
| so2 | 3.5 (Good) | 4.1 (Good) | 4.9 (Good) | 5.6 (Good) | 7.7 (Good) | 5.1 (Good) | 7 (Good) | 4.8 (Good) | 3.7 (Good) | 2.7 (Good) | 2.4 (Good) | 4.8 (Good) | 4.5 (Good) | 5.2 (Good) | 6.1 (Good) | 7.4 (Good) | 9.9 (Good) | 6.4 (Good) | 8.3 (Good) | 4.3 (Good) |
NO2 7.3 (Good)
nitrogen dioxide (NO2)PM10 19 (Good)
particulate matter (PM10) suspended dustO3 91 (Moderate)
ozone (O3)PM2,5 10 (Good)
particulate matter (PM2.5) dustSO2 0.1 (Good)
sulfur dioxide (SO2)CO 100 (Good)
carbon monoxide (CO)东四
| index | 2022-05-27 |
|---|---|
| no2 | 20 |
| pm10 | 27 |
| o3 | 39 |
| pm25 | 20 |
| so2 | 4.9 |
| co | 240 |
东四

| index | 2020-05 | 2020-04 | 2020-03 | 2020-02 | 2020-01 | 2019-12 | 2019-11 | 2019-10 | 2019-09 | 2019-08 | 2019-07 | 2019-06 | 2019-05 | 2019-04 | 2019-03 | 2019-02 | 2019-01 | 2018-12 | 2018-11 | 2018-10 |
|---|---|---|---|---|---|---|---|---|---|---|---|---|---|---|---|---|---|---|---|---|
| pm25 | 46 | 33 | 34 | 65 | 62 | 48 | 46 | 43 | 39 | 24 | 38 | 39 | 42 | 49 | 51 | 53 | 56 | 39 | 79 | 43 |
| co | 729 | 444 | 531 | 1 | 951 | 919 | 924 | 774 | 761 | 593 | 674 | 788 | 540 | 616 | 709 | 757 | 1 | 796 | 1 | 732 |
| no2 | 23 | 25 | 25 | 29 | 40 | 45 | 47 | 45 | 36 | 28 | 28 | 29 | 35 | 36 | 41 | 38 | 53 | 45 | 62 | 50 |
| o3 | 149 | 134 | 92 | 72 | 59 | 45 | 41 | 69 | 194 | 154 | 192 | 211 | 172 | 113 | 95 | 85 | 57 | 47 | 54 | 77 |
| pm10 | 65 | 69 | 55 | 60 | 68 | 64 | 82 | 74 | 65 | 42 | 56 | 62 | 74 | 94 | 80 | 80 | 86 | 78 | 112 | 71 |
| so2 | 3.5 | 4.1 | 4.9 | 5.6 | 7.7 | 5.1 | 7 | 4.8 | 3.7 | 2.7 | 2.4 | 4.8 | 4.5 | 5.2 | 6.1 | 7.4 | 9.9 | 6.4 | 8.3 | 4.3 |