Air Pollution in Baifucun: Real-time Air Quality Index and smog alert.
Pollution and air quality forecast for Baifucun. Today is Saturday, June 13, 2026. The following air pollution values have been recorded for Baifucun:- nitrogen dioxide (NO2) - 7 (Good)
- particulate matter (PM10) suspended dust - 19 (Good)
- ozone (O3) - 91 (Moderate)
- particulate matter (PM2.5) dust - 10 (Good)
- sulfur dioxide (SO2) - 0 (Good)
- carbon monoxide (CO) - 100 (Good)

What is the air quality in Baifucun today? Is the air polluted in Baifucun?. Is there smog?
How high is the level of NO2? (nitrogen dioxide (NO2))
7 (Good)
What is the level of PM10 today in Baifucun? (particulate matter (PM10) suspended dust)
The current level of particulate matter PM10 in Baifucun is:
19 (Good)
The highest PM10 values usually occur in month: 96 (November 2018).
The lowest value of particulate matter PM10 pollution in Baifucun is usually recorded in: August (32).
How is the O3 level today in Baifucun? (ozone (O3))
91 (Moderate)
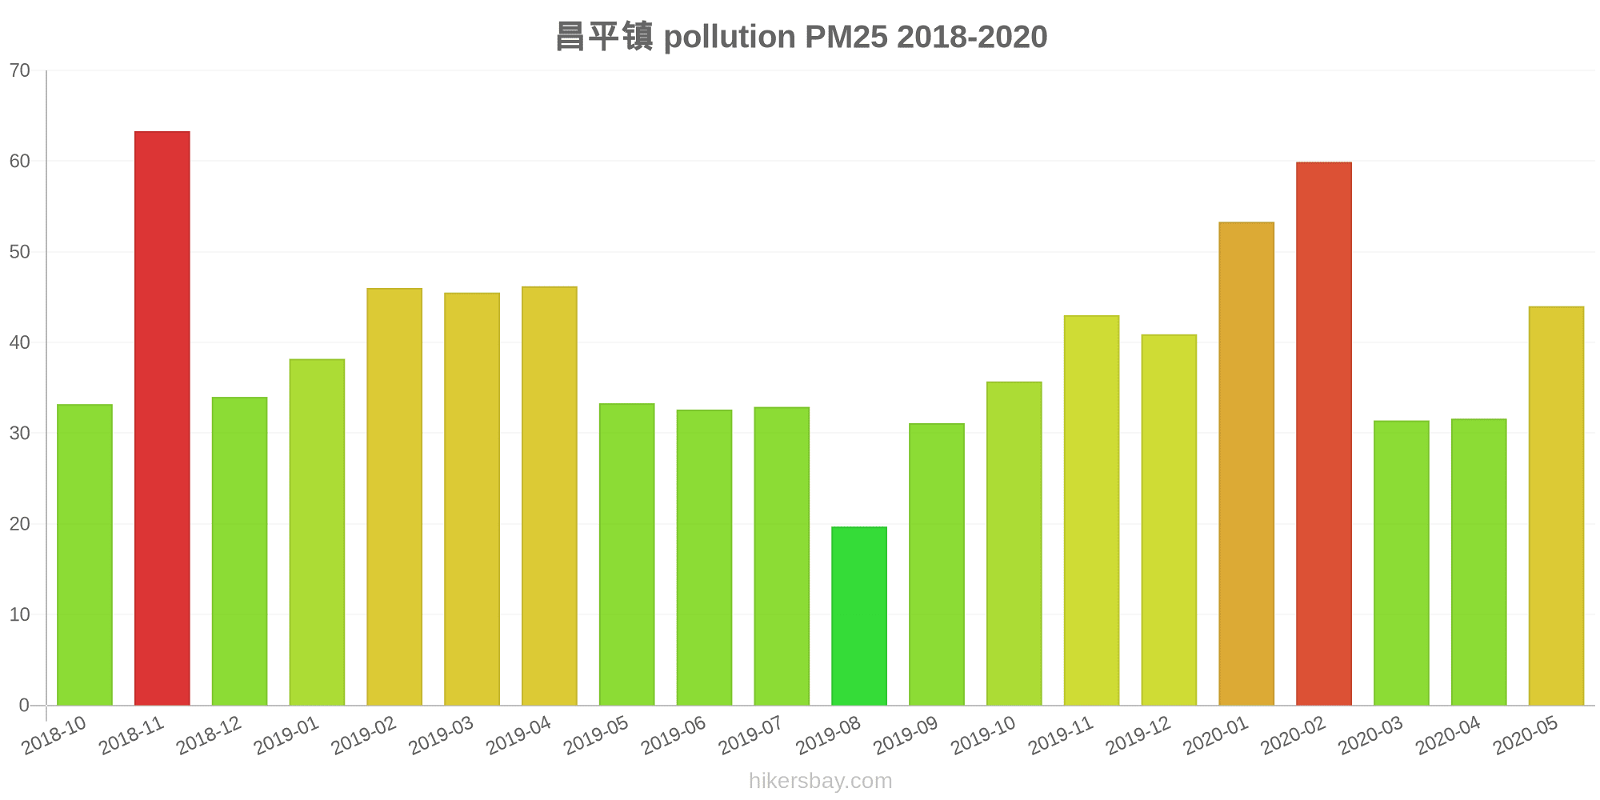
What is the current level of PM2.5 in Baifucun? (particulate matter (PM2.5) dust)
Today's PM2.5 level is:
10 (Good)
For comparison, the highest level of PM2.5 in Baifucun in the last 7 days was: 20 (Friday, May 27, 2022) and the lowest: 20 (Friday, May 27, 2022).
The highest PM2.5 values were recorded: 63 (November 2018).
The lowest level of particulate matter PM2.5 pollution occurs in month: August (20).
What is the level of SO2 pollution? (sulfur dioxide (SO2))
0 (Good)
How high is the CO level? (carbon monoxide (CO))
100 (Good)
Current data Friday, May 27, 2022, 12:00 PM
NO2 7 (Good)
PM10 19 (Good)
O3 91 (Moderate)
PM2,5 10 (Good)
SO2 0 (Good)
CO 100 (Good)
Data on air pollution from recent days in Baifucun
index
2022-05-27
no2
20
Good
pm10
27
Moderate
o3
39
Good
pm25
20
Moderate
so2
5
Good
co
240
Good
data source »
Air pollution in Baifucun from October 2018 to May 2020

index
2020-05
2020-04
2020-03
2020-02
2020-01
2019-12
2019-11
2019-10
2019-09
2019-08
2019-07
2019-06
2019-05
2019-04
2019-03
2019-02
2019-01
2018-12
2018-11
2018-10
pm25
44 (Unhealthy for Sensitive Groups)
32 (Moderate)
31 (Moderate)
60 (Unhealthy)
53 (Unhealthy for Sensitive Groups)
41 (Unhealthy for Sensitive Groups)
43 (Unhealthy for Sensitive Groups)
36 (Unhealthy for Sensitive Groups)
31 (Moderate)
20 (Moderate)
33 (Moderate)
33 (Moderate)
33 (Moderate)
46 (Unhealthy for Sensitive Groups)
46 (Unhealthy for Sensitive Groups)
46 (Unhealthy for Sensitive Groups)
38 (Unhealthy for Sensitive Groups)
34 (Moderate)
63 (Unhealthy)
33 (Moderate)
co
608 (Good)
377 (Good)
436 (Good)
858 (Good)
969 (Good)
802 (Good)
777 (Good)
578 (Good)
586 (Good)
512 (Good)
596 (Good)
616 (Good)
429 (Good)
481 (Good)
565 (Good)
708 (Good)
834 (Good)
762 (Good)
980 (Good)
530 (Good)
no2
19 (Good)
17 (Good)
19 (Good)
24 (Good)
36 (Good)
42 (Moderate)
42 (Moderate)
33 (Good)
26 (Good)
22 (Good)
22 (Good)
22 (Good)
25 (Good)
27 (Good)
31 (Good)
27 (Good)
34 (Good)
34 (Good)
51 (Moderate)
32 (Good)
o3
159 (Unhealthy)
134 (Unhealthy for Sensitive Groups)
94 (Moderate)
82 (Moderate)
63 (Good)
52 (Good)
41 (Good)
72 (Moderate)
180 (Very Unhealthy)
150 (Unhealthy)
189 (Very Unhealthy)
203 (Very Unhealthy)
162 (Unhealthy)
116 (Moderate)
100 (Moderate)
77 (Moderate)
65 (Good)
54 (Good)
47 (Good)
74 (Moderate)
pm10
72 (Unhealthy for Sensitive Groups)
65 (Unhealthy for Sensitive Groups)
48 (Moderate)
54 (Unhealthy for Sensitive Groups)
59 (Unhealthy for Sensitive Groups)
56 (Unhealthy for Sensitive Groups)
76 (Unhealthy for Sensitive Groups)
60 (Unhealthy for Sensitive Groups)
51 (Unhealthy for Sensitive Groups)
32 (Moderate)
44 (Moderate)
52 (Unhealthy for Sensitive Groups)
73 (Unhealthy for Sensitive Groups)
90 (Unhealthy)
78 (Unhealthy for Sensitive Groups)
70 (Unhealthy for Sensitive Groups)
66 (Unhealthy for Sensitive Groups)
79 (Unhealthy for Sensitive Groups)
96 (Unhealthy)
55 (Unhealthy for Sensitive Groups)
so2
3.1 (Good)
3.2 (Good)
3.3 (Good)
3.6 (Good)
7.2 (Good)
3.8 (Good)
3.7 (Good)
2.7 (Good)
2.6 (Good)
2.5 (Good)
2.7 (Good)
3.6 (Good)
4.1 (Good)
3.9 (Good)
5.1 (Good)
6.8 (Good)
8.2 (Good)
7 (Good)
5.5 (Good)
2.6 (Good)
data source »
昌平镇
Friday, May 27, 2022, 12:00 PM
NO2 7.3 (Good)
nitrogen dioxide (NO2)
PM10 19 (Good)
particulate matter (PM10) suspended dust
O3 91 (Moderate)
ozone (O3)
PM2,5 10 (Good)
particulate matter (PM2.5) dust
SO2 0.1 (Good)
sulfur dioxide (SO2)
CO 100 (Good)
carbon monoxide (CO)
昌平镇
index
2022-05-27
no2
20
pm10
27
o3
39
pm25
20
so2
4.9
co
240
昌平镇
2018-10 2020-05
index
2020-05
2020-04
2020-03
2020-02
2020-01
2019-12
2019-11
2019-10
2019-09
2019-08
2019-07
2019-06
2019-05
2019-04
2019-03
2019-02
2019-01
2018-12
2018-11
2018-10
pm25
44
32
31
60
53
41
43
36
31
20
33
33
33
46
46
46
38
34
63
33
co
608
377
436
858
969
802
777
578
586
512
596
616
429
481
565
708
834
762
980
530
no2
19
17
19
24
36
42
42
33
26
22
22
22
25
27
31
27
34
34
51
32
o3
159
134
94
82
63
52
41
72
180
150
189
203
162
116
100
77
65
54
47
74
pm10
72
65
48
54
59
56
76
60
51
32
44
52
73
90
78
70
66
79
96
55
so2
3.1
3.2
3.3
3.6
7.2
3.8
3.7
2.7
2.6
2.5
2.7
3.6
4.1
3.9
5.1
6.8
8.2
7
5.5
2.6
* Pollution data source:
https://openaq.org
(ChinaAQIData)
The data is licensed under CC-By 4.0
NO2 7 (Good)
PM10 19 (Good)
O3 91 (Moderate)
PM2,5 10 (Good)
SO2 0 (Good)
CO 100 (Good)
Data on air pollution from recent days in Baifucun
| index | 2022-05-27 |
|---|---|
| no2 | 20 Good |
| pm10 | 27 Moderate |
| o3 | 39 Good |
| pm25 | 20 Moderate |
| so2 | 5 Good |
| co | 240 Good |

| index | 2020-05 | 2020-04 | 2020-03 | 2020-02 | 2020-01 | 2019-12 | 2019-11 | 2019-10 | 2019-09 | 2019-08 | 2019-07 | 2019-06 | 2019-05 | 2019-04 | 2019-03 | 2019-02 | 2019-01 | 2018-12 | 2018-11 | 2018-10 |
|---|---|---|---|---|---|---|---|---|---|---|---|---|---|---|---|---|---|---|---|---|
| pm25 | 44 (Unhealthy for Sensitive Groups) | 32 (Moderate) | 31 (Moderate) | 60 (Unhealthy) | 53 (Unhealthy for Sensitive Groups) | 41 (Unhealthy for Sensitive Groups) | 43 (Unhealthy for Sensitive Groups) | 36 (Unhealthy for Sensitive Groups) | 31 (Moderate) | 20 (Moderate) | 33 (Moderate) | 33 (Moderate) | 33 (Moderate) | 46 (Unhealthy for Sensitive Groups) | 46 (Unhealthy for Sensitive Groups) | 46 (Unhealthy for Sensitive Groups) | 38 (Unhealthy for Sensitive Groups) | 34 (Moderate) | 63 (Unhealthy) | 33 (Moderate) |
| co | 608 (Good) | 377 (Good) | 436 (Good) | 858 (Good) | 969 (Good) | 802 (Good) | 777 (Good) | 578 (Good) | 586 (Good) | 512 (Good) | 596 (Good) | 616 (Good) | 429 (Good) | 481 (Good) | 565 (Good) | 708 (Good) | 834 (Good) | 762 (Good) | 980 (Good) | 530 (Good) |
| no2 | 19 (Good) | 17 (Good) | 19 (Good) | 24 (Good) | 36 (Good) | 42 (Moderate) | 42 (Moderate) | 33 (Good) | 26 (Good) | 22 (Good) | 22 (Good) | 22 (Good) | 25 (Good) | 27 (Good) | 31 (Good) | 27 (Good) | 34 (Good) | 34 (Good) | 51 (Moderate) | 32 (Good) |
| o3 | 159 (Unhealthy) | 134 (Unhealthy for Sensitive Groups) | 94 (Moderate) | 82 (Moderate) | 63 (Good) | 52 (Good) | 41 (Good) | 72 (Moderate) | 180 (Very Unhealthy) | 150 (Unhealthy) | 189 (Very Unhealthy) | 203 (Very Unhealthy) | 162 (Unhealthy) | 116 (Moderate) | 100 (Moderate) | 77 (Moderate) | 65 (Good) | 54 (Good) | 47 (Good) | 74 (Moderate) |
| pm10 | 72 (Unhealthy for Sensitive Groups) | 65 (Unhealthy for Sensitive Groups) | 48 (Moderate) | 54 (Unhealthy for Sensitive Groups) | 59 (Unhealthy for Sensitive Groups) | 56 (Unhealthy for Sensitive Groups) | 76 (Unhealthy for Sensitive Groups) | 60 (Unhealthy for Sensitive Groups) | 51 (Unhealthy for Sensitive Groups) | 32 (Moderate) | 44 (Moderate) | 52 (Unhealthy for Sensitive Groups) | 73 (Unhealthy for Sensitive Groups) | 90 (Unhealthy) | 78 (Unhealthy for Sensitive Groups) | 70 (Unhealthy for Sensitive Groups) | 66 (Unhealthy for Sensitive Groups) | 79 (Unhealthy for Sensitive Groups) | 96 (Unhealthy) | 55 (Unhealthy for Sensitive Groups) |
| so2 | 3.1 (Good) | 3.2 (Good) | 3.3 (Good) | 3.6 (Good) | 7.2 (Good) | 3.8 (Good) | 3.7 (Good) | 2.7 (Good) | 2.6 (Good) | 2.5 (Good) | 2.7 (Good) | 3.6 (Good) | 4.1 (Good) | 3.9 (Good) | 5.1 (Good) | 6.8 (Good) | 8.2 (Good) | 7 (Good) | 5.5 (Good) | 2.6 (Good) |
NO2 7.3 (Good)
nitrogen dioxide (NO2)PM10 19 (Good)
particulate matter (PM10) suspended dustO3 91 (Moderate)
ozone (O3)PM2,5 10 (Good)
particulate matter (PM2.5) dustSO2 0.1 (Good)
sulfur dioxide (SO2)CO 100 (Good)
carbon monoxide (CO)昌平镇
| index | 2022-05-27 |
|---|---|
| no2 | 20 |
| pm10 | 27 |
| o3 | 39 |
| pm25 | 20 |
| so2 | 4.9 |
| co | 240 |
昌平镇

| index | 2020-05 | 2020-04 | 2020-03 | 2020-02 | 2020-01 | 2019-12 | 2019-11 | 2019-10 | 2019-09 | 2019-08 | 2019-07 | 2019-06 | 2019-05 | 2019-04 | 2019-03 | 2019-02 | 2019-01 | 2018-12 | 2018-11 | 2018-10 |
|---|---|---|---|---|---|---|---|---|---|---|---|---|---|---|---|---|---|---|---|---|
| pm25 | 44 | 32 | 31 | 60 | 53 | 41 | 43 | 36 | 31 | 20 | 33 | 33 | 33 | 46 | 46 | 46 | 38 | 34 | 63 | 33 |
| co | 608 | 377 | 436 | 858 | 969 | 802 | 777 | 578 | 586 | 512 | 596 | 616 | 429 | 481 | 565 | 708 | 834 | 762 | 980 | 530 |
| no2 | 19 | 17 | 19 | 24 | 36 | 42 | 42 | 33 | 26 | 22 | 22 | 22 | 25 | 27 | 31 | 27 | 34 | 34 | 51 | 32 |
| o3 | 159 | 134 | 94 | 82 | 63 | 52 | 41 | 72 | 180 | 150 | 189 | 203 | 162 | 116 | 100 | 77 | 65 | 54 | 47 | 74 |
| pm10 | 72 | 65 | 48 | 54 | 59 | 56 | 76 | 60 | 51 | 32 | 44 | 52 | 73 | 90 | 78 | 70 | 66 | 79 | 96 | 55 |
| so2 | 3.1 | 3.2 | 3.3 | 3.6 | 7.2 | 3.8 | 3.7 | 2.7 | 2.6 | 2.5 | 2.7 | 3.6 | 4.1 | 3.9 | 5.1 | 6.8 | 8.2 | 7 | 5.5 | 2.6 |