Air Pollution in Zhangqiwan: Real-time Air Quality Index and smog alert.
Pollution and air quality forecast for Zhangqiwan. Today is Tuesday, June 16, 2026. The following air pollution values have been recorded for Zhangqiwan:- particulate matter (PM2.5) dust - 61 (Unhealthy)
- nitrogen dioxide (NO2) - 22 (Good)
- particulate matter (PM10) suspended dust - 69 (Unhealthy for Sensitive Groups)
- carbon monoxide (CO) - 219 (Good)
- ozone (O3) - 0 (Good)
- sulfur dioxide (SO2) - 8 (Good)

What is the air quality in Zhangqiwan today? Is the air polluted in Zhangqiwan?. Is there smog?
What is the current level of PM2.5 in Zhangqiwan? (particulate matter (PM2.5) dust)
Today's PM2.5 level is:
61 (Unhealthy)
For comparison, the highest level of PM2.5 in Zhangqiwan in the last 7 days was: 28 (Friday, May 27, 2022) and the lowest: 28 (Friday, May 27, 2022).
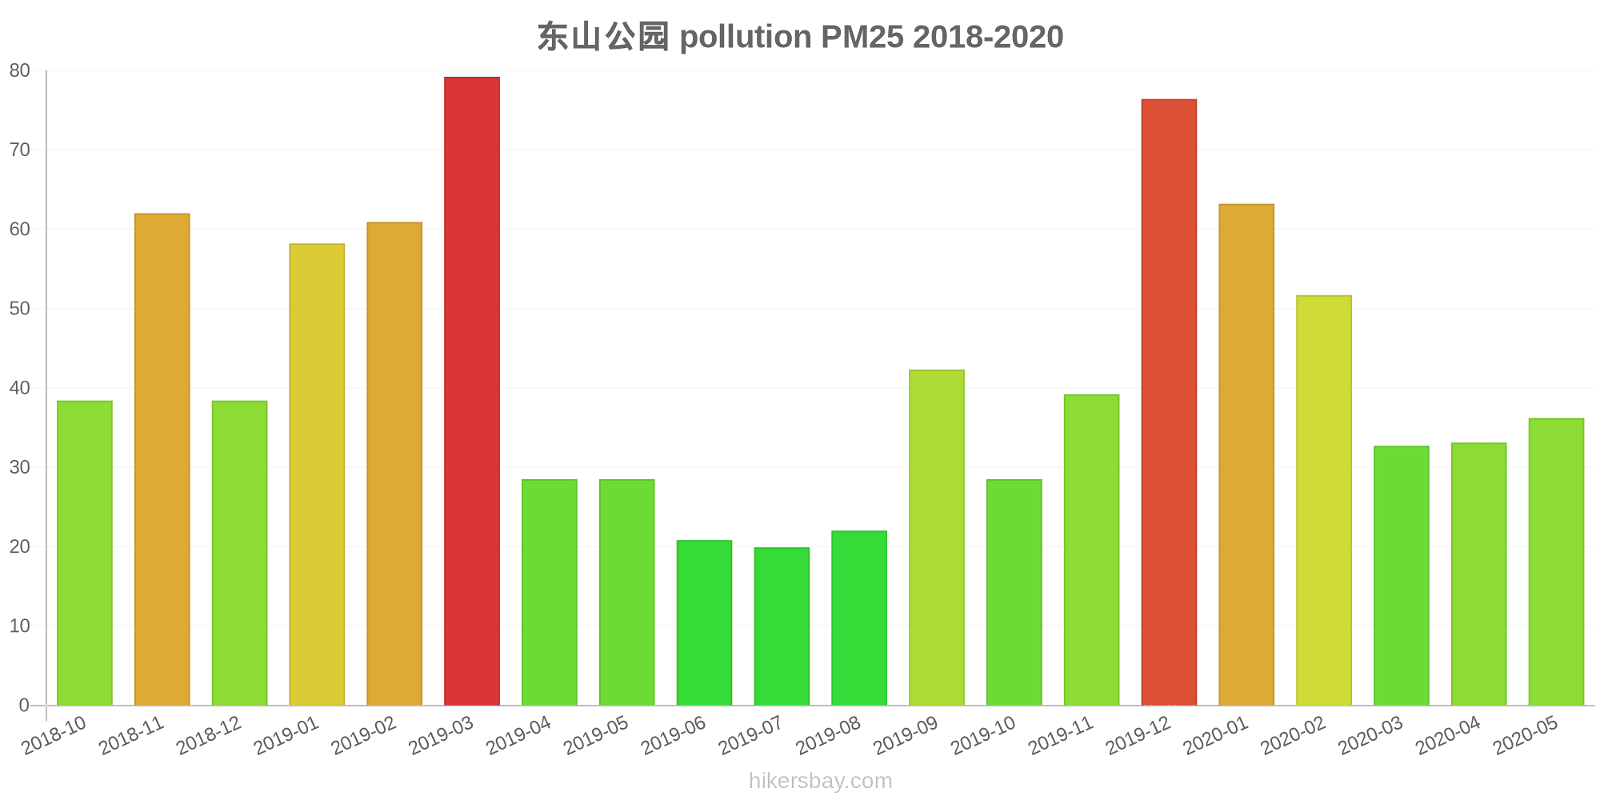
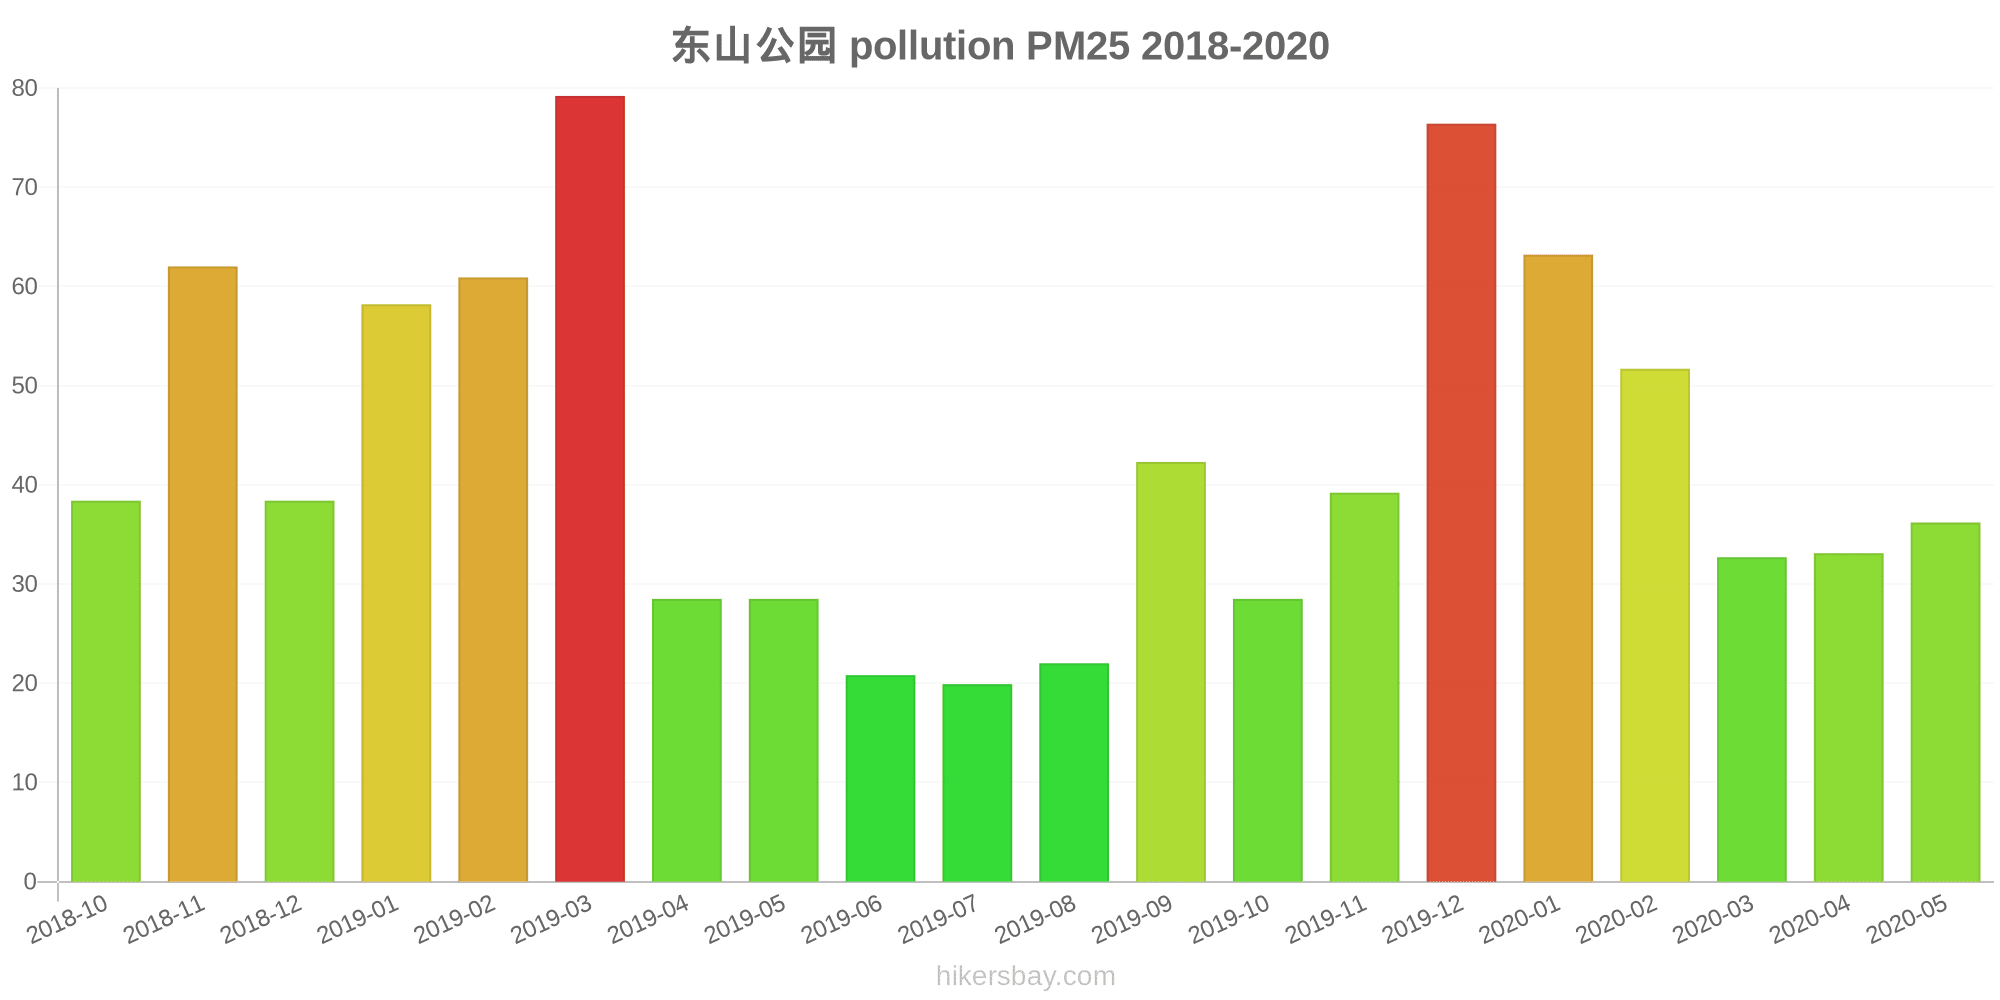
The highest PM2.5 values were recorded: 79 (March 2019).
The lowest level of particulate matter PM2.5 pollution occurs in month: July (20).
How high is the level of NO2? (nitrogen dioxide (NO2))
22 (Good)
What is the level of PM10 today in Zhangqiwan? (particulate matter (PM10) suspended dust)
The current level of particulate matter PM10 in Zhangqiwan is:
69 (Unhealthy for Sensitive Groups)
The highest PM10 values usually occur in month: 103 (March 2019).
The lowest value of particulate matter PM10 pollution in Zhangqiwan is usually recorded in: June (31).
How high is the CO level? (carbon monoxide (CO))
219 (Good)
How is the O3 level today in Zhangqiwan? (ozone (O3))
0 (Good)
What is the level of SO2 pollution? (sulfur dioxide (SO2))
8 (Good)
Current data Friday, May 27, 2022, 3:00 PM
PM2,5 61 (Unhealthy)
NO2 22 (Good)
PM10 69 (Unhealthy for Sensitive Groups)
CO 219 (Good)
O3 0 (Good)
SO2 8 (Good)
Data on air pollution from recent days in Zhangqiwan
index
2022-05-27
pm25
28
Moderate
no2
22
Good
pm10
35
Moderate
co
579
Good
o3
22
Good
so2
5
Good
data source »
Air pollution in Zhangqiwan from October 2018 to May 2020

index
2020-05
2020-04
2020-03
2020-02
2020-01
2019-12
2019-11
2019-10
2019-09
2019-08
2019-07
2019-06
2019-05
2019-04
2019-03
2019-02
2019-01
2018-12
2018-11
2018-10
pm25
36 (Unhealthy for Sensitive Groups)
33 (Moderate)
33 (Moderate)
52 (Unhealthy for Sensitive Groups)
63 (Unhealthy)
76 (Very Unhealthy)
39 (Unhealthy for Sensitive Groups)
29 (Moderate)
42 (Unhealthy for Sensitive Groups)
22 (Moderate)
20 (Moderate)
21 (Moderate)
29 (Moderate)
29 (Moderate)
79 (Very Unhealthy)
61 (Unhealthy)
58 (Unhealthy)
38 (Unhealthy for Sensitive Groups)
62 (Unhealthy)
38 (Unhealthy for Sensitive Groups)
co
619 (Good)
586 (Good)
554 (Good)
680 (Good)
936 (Good)
860 (Good)
623 (Good)
667 (Good)
817 (Good)
530 (Good)
620 (Good)
592 (Good)
586 (Good)
623 (Good)
972 (Good)
994 (Good)
1 (Good)
712 (Good)
826 (Good)
524 (Good)
no2
29 (Good)
26 (Good)
27 (Good)
15 (Good)
28 (Good)
39 (Good)
30 (Good)
18 (Good)
12 (Good)
9.8 (Good)
18 (Good)
14 (Good)
16 (Good)
22 (Good)
35 (Good)
32 (Good)
41 (Moderate)
30 (Good)
36 (Good)
25 (Good)
o3
169 (Unhealthy)
132 (Unhealthy for Sensitive Groups)
108 (Moderate)
92 (Moderate)
73 (Moderate)
65 (Good)
70 (Moderate)
94 (Moderate)
121 (Unhealthy for Sensitive Groups)
96 (Moderate)
124 (Unhealthy for Sensitive Groups)
129 (Unhealthy for Sensitive Groups)
125 (Unhealthy for Sensitive Groups)
134 (Unhealthy for Sensitive Groups)
110 (Moderate)
93 (Moderate)
74 (Moderate)
58 (Good)
67 (Good)
77 (Moderate)
pm10
78 (Unhealthy for Sensitive Groups)
63 (Unhealthy for Sensitive Groups)
67 (Unhealthy for Sensitive Groups)
74 (Unhealthy for Sensitive Groups)
79 (Unhealthy for Sensitive Groups)
100 (Unhealthy)
64 (Unhealthy for Sensitive Groups)
50 (Unhealthy for Sensitive Groups)
58 (Unhealthy for Sensitive Groups)
32 (Moderate)
34 (Moderate)
31 (Moderate)
55 (Unhealthy for Sensitive Groups)
59 (Unhealthy for Sensitive Groups)
103 (Unhealthy)
89 (Unhealthy)
87 (Unhealthy)
60 (Unhealthy for Sensitive Groups)
94 (Unhealthy)
56 (Unhealthy for Sensitive Groups)
so2
9.9 (Good)
6.9 (Good)
7 (Good)
4.5 (Good)
4.7 (Good)
6.1 (Good)
4.7 (Good)
5.7 (Good)
8.2 (Good)
4.6 (Good)
3.7 (Good)
4.3 (Good)
5.8 (Good)
9.5 (Good)
21 (Good)
35 (Good)
36 (Good)
22 (Good)
21 (Good)
8.4 (Good)
data source »
东山公园
Friday, May 27, 2022, 3:00 PM
PM2,5 61 (Unhealthy)
particulate matter (PM2.5) dust
NO2 22 (Good)
nitrogen dioxide (NO2)
PM10 69 (Unhealthy for Sensitive Groups)
particulate matter (PM10) suspended dust
CO 219 (Good)
carbon monoxide (CO)
O3 0.05 (Good)
ozone (O3)
SO2 7.7 (Good)
sulfur dioxide (SO2)
东山公园
index
2022-05-27
pm25
28
no2
22
pm10
35
co
579
o3
22
so2
4.6
东山公园
2018-10 2020-05
index
2020-05
2020-04
2020-03
2020-02
2020-01
2019-12
2019-11
2019-10
2019-09
2019-08
2019-07
2019-06
2019-05
2019-04
2019-03
2019-02
2019-01
2018-12
2018-11
2018-10
pm25
36
33
33
52
63
76
39
29
42
22
20
21
29
29
79
61
58
38
62
38
co
619
586
554
680
936
860
623
667
817
530
620
592
586
623
972
994
1
712
826
524
no2
29
26
27
15
28
39
30
18
12
9.8
18
14
16
22
35
32
41
30
36
25
o3
169
132
108
92
73
65
70
94
121
96
124
129
125
134
110
93
74
58
67
77
pm10
78
63
67
74
79
100
64
50
58
32
34
31
55
59
103
89
87
60
94
56
so2
9.9
6.9
7
4.5
4.7
6.1
4.7
5.7
8.2
4.6
3.7
4.3
5.8
9.5
21
35
36
22
21
8.4
* Pollution data source:
https://openaq.org
(ChinaAQIData)
The data is licensed under CC-By 4.0
PM2,5 61 (Unhealthy)
NO2 22 (Good)
PM10 69 (Unhealthy for Sensitive Groups)
CO 219 (Good)
O3 0 (Good)
SO2 8 (Good)
Data on air pollution from recent days in Zhangqiwan
| index | 2022-05-27 |
|---|---|
| pm25 | 28 Moderate |
| no2 | 22 Good |
| pm10 | 35 Moderate |
| co | 579 Good |
| o3 | 22 Good |
| so2 | 5 Good |

| index | 2020-05 | 2020-04 | 2020-03 | 2020-02 | 2020-01 | 2019-12 | 2019-11 | 2019-10 | 2019-09 | 2019-08 | 2019-07 | 2019-06 | 2019-05 | 2019-04 | 2019-03 | 2019-02 | 2019-01 | 2018-12 | 2018-11 | 2018-10 |
|---|---|---|---|---|---|---|---|---|---|---|---|---|---|---|---|---|---|---|---|---|
| pm25 | 36 (Unhealthy for Sensitive Groups) | 33 (Moderate) | 33 (Moderate) | 52 (Unhealthy for Sensitive Groups) | 63 (Unhealthy) | 76 (Very Unhealthy) | 39 (Unhealthy for Sensitive Groups) | 29 (Moderate) | 42 (Unhealthy for Sensitive Groups) | 22 (Moderate) | 20 (Moderate) | 21 (Moderate) | 29 (Moderate) | 29 (Moderate) | 79 (Very Unhealthy) | 61 (Unhealthy) | 58 (Unhealthy) | 38 (Unhealthy for Sensitive Groups) | 62 (Unhealthy) | 38 (Unhealthy for Sensitive Groups) |
| co | 619 (Good) | 586 (Good) | 554 (Good) | 680 (Good) | 936 (Good) | 860 (Good) | 623 (Good) | 667 (Good) | 817 (Good) | 530 (Good) | 620 (Good) | 592 (Good) | 586 (Good) | 623 (Good) | 972 (Good) | 994 (Good) | 1 (Good) | 712 (Good) | 826 (Good) | 524 (Good) |
| no2 | 29 (Good) | 26 (Good) | 27 (Good) | 15 (Good) | 28 (Good) | 39 (Good) | 30 (Good) | 18 (Good) | 12 (Good) | 9.8 (Good) | 18 (Good) | 14 (Good) | 16 (Good) | 22 (Good) | 35 (Good) | 32 (Good) | 41 (Moderate) | 30 (Good) | 36 (Good) | 25 (Good) |
| o3 | 169 (Unhealthy) | 132 (Unhealthy for Sensitive Groups) | 108 (Moderate) | 92 (Moderate) | 73 (Moderate) | 65 (Good) | 70 (Moderate) | 94 (Moderate) | 121 (Unhealthy for Sensitive Groups) | 96 (Moderate) | 124 (Unhealthy for Sensitive Groups) | 129 (Unhealthy for Sensitive Groups) | 125 (Unhealthy for Sensitive Groups) | 134 (Unhealthy for Sensitive Groups) | 110 (Moderate) | 93 (Moderate) | 74 (Moderate) | 58 (Good) | 67 (Good) | 77 (Moderate) |
| pm10 | 78 (Unhealthy for Sensitive Groups) | 63 (Unhealthy for Sensitive Groups) | 67 (Unhealthy for Sensitive Groups) | 74 (Unhealthy for Sensitive Groups) | 79 (Unhealthy for Sensitive Groups) | 100 (Unhealthy) | 64 (Unhealthy for Sensitive Groups) | 50 (Unhealthy for Sensitive Groups) | 58 (Unhealthy for Sensitive Groups) | 32 (Moderate) | 34 (Moderate) | 31 (Moderate) | 55 (Unhealthy for Sensitive Groups) | 59 (Unhealthy for Sensitive Groups) | 103 (Unhealthy) | 89 (Unhealthy) | 87 (Unhealthy) | 60 (Unhealthy for Sensitive Groups) | 94 (Unhealthy) | 56 (Unhealthy for Sensitive Groups) |
| so2 | 9.9 (Good) | 6.9 (Good) | 7 (Good) | 4.5 (Good) | 4.7 (Good) | 6.1 (Good) | 4.7 (Good) | 5.7 (Good) | 8.2 (Good) | 4.6 (Good) | 3.7 (Good) | 4.3 (Good) | 5.8 (Good) | 9.5 (Good) | 21 (Good) | 35 (Good) | 36 (Good) | 22 (Good) | 21 (Good) | 8.4 (Good) |
PM2,5 61 (Unhealthy)
particulate matter (PM2.5) dustNO2 22 (Good)
nitrogen dioxide (NO2)PM10 69 (Unhealthy for Sensitive Groups)
particulate matter (PM10) suspended dustCO 219 (Good)
carbon monoxide (CO)O3 0.05 (Good)
ozone (O3)SO2 7.7 (Good)
sulfur dioxide (SO2)东山公园
| index | 2022-05-27 |
|---|---|
| pm25 | 28 |
| no2 | 22 |
| pm10 | 35 |
| co | 579 |
| o3 | 22 |
| so2 | 4.6 |
东山公园
| index | 2020-05 | 2020-04 | 2020-03 | 2020-02 | 2020-01 | 2019-12 | 2019-11 | 2019-10 | 2019-09 | 2019-08 | 2019-07 | 2019-06 | 2019-05 | 2019-04 | 2019-03 | 2019-02 | 2019-01 | 2018-12 | 2018-11 | 2018-10 |
|---|---|---|---|---|---|---|---|---|---|---|---|---|---|---|---|---|---|---|---|---|
| pm25 | 36 | 33 | 33 | 52 | 63 | 76 | 39 | 29 | 42 | 22 | 20 | 21 | 29 | 29 | 79 | 61 | 58 | 38 | 62 | 38 |
| co | 619 | 586 | 554 | 680 | 936 | 860 | 623 | 667 | 817 | 530 | 620 | 592 | 586 | 623 | 972 | 994 | 1 | 712 | 826 | 524 |
| no2 | 29 | 26 | 27 | 15 | 28 | 39 | 30 | 18 | 12 | 9.8 | 18 | 14 | 16 | 22 | 35 | 32 | 41 | 30 | 36 | 25 |
| o3 | 169 | 132 | 108 | 92 | 73 | 65 | 70 | 94 | 121 | 96 | 124 | 129 | 125 | 134 | 110 | 93 | 74 | 58 | 67 | 77 |
| pm10 | 78 | 63 | 67 | 74 | 79 | 100 | 64 | 50 | 58 | 32 | 34 | 31 | 55 | 59 | 103 | 89 | 87 | 60 | 94 | 56 |
| so2 | 9.9 | 6.9 | 7 | 4.5 | 4.7 | 6.1 | 4.7 | 5.7 | 8.2 | 4.6 | 3.7 | 4.3 | 5.8 | 9.5 | 21 | 35 | 36 | 22 | 21 | 8.4 |