Air Pollution in Hujia Yuanzi: Real-time Air Quality Index and smog alert.
Pollution and air quality forecast for Hujia Yuanzi. Today is Tuesday, June 16, 2026. The following air pollution values have been recorded for Hujia Yuanzi:- particulate matter (PM2.5) dust - 61 (Unhealthy)
- nitrogen dioxide (NO2) - 22 (Good)
- particulate matter (PM10) suspended dust - 69 (Unhealthy for Sensitive Groups)
- carbon monoxide (CO) - 219 (Good)
- ozone (O3) - 0 (Good)
- sulfur dioxide (SO2) - 8 (Good)

What is the air quality in Hujia Yuanzi today? Is the air polluted in Hujia Yuanzi?. Is there smog?
What is the current level of PM2.5 in Hujia Yuanzi? (particulate matter (PM2.5) dust)
Today's PM2.5 level is:
61 (Unhealthy)
For comparison, the highest level of PM2.5 in Hujia Yuanzi in the last 7 days was: 28 (Friday, May 27, 2022) and the lowest: 28 (Friday, May 27, 2022).
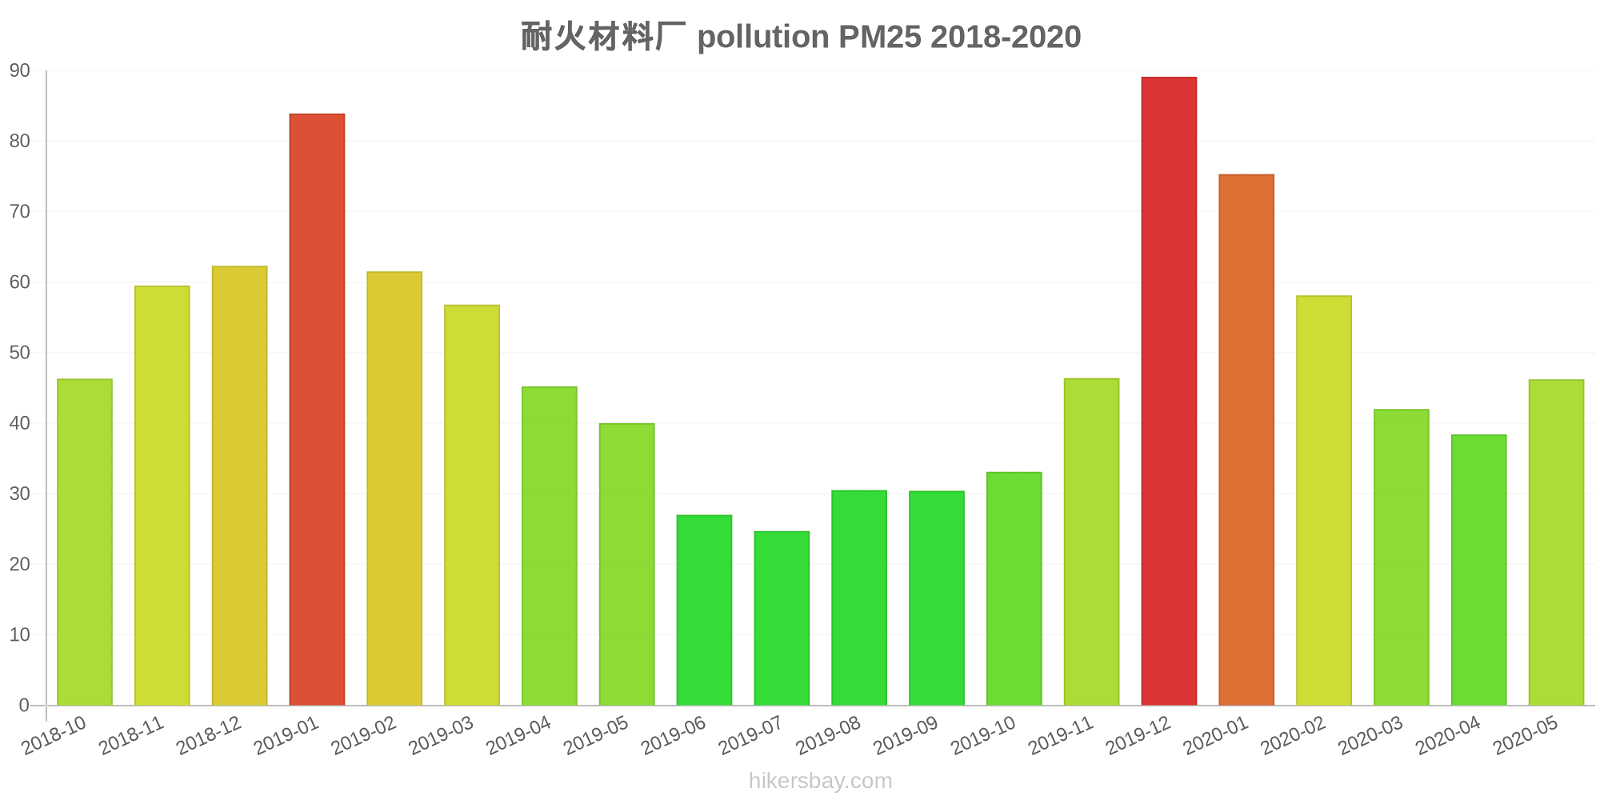
The highest PM2.5 values were recorded: 89 (December 2019).
The lowest level of particulate matter PM2.5 pollution occurs in month: July (25).
How high is the level of NO2? (nitrogen dioxide (NO2))
22 (Good)
What is the level of PM10 today in Hujia Yuanzi? (particulate matter (PM10) suspended dust)
The current level of particulate matter PM10 in Hujia Yuanzi is:
69 (Unhealthy for Sensitive Groups)
The highest PM10 values usually occur in month: 123 (December 2019).
The lowest value of particulate matter PM10 pollution in Hujia Yuanzi is usually recorded in: July (46).
How high is the CO level? (carbon monoxide (CO))
219 (Good)
How is the O3 level today in Hujia Yuanzi? (ozone (O3))
0 (Good)
What is the level of SO2 pollution? (sulfur dioxide (SO2))
8 (Good)
Current data Friday, May 27, 2022, 3:00 PM
PM2,5 61 (Unhealthy)
NO2 22 (Good)
PM10 69 (Unhealthy for Sensitive Groups)
CO 219 (Good)
O3 0 (Good)
SO2 8 (Good)
Data on air pollution from recent days in Hujia Yuanzi
index
2022-05-27
pm25
28
Moderate
no2
22
Good
pm10
35
Moderate
co
579
Good
o3
22
Good
so2
5
Good
data source »
Air pollution in Hujia Yuanzi from October 2018 to May 2020

index
2020-05
2020-04
2020-03
2020-02
2020-01
2019-12
2019-11
2019-10
2019-09
2019-08
2019-07
2019-06
2019-05
2019-04
2019-03
2019-02
2019-01
2018-12
2018-11
2018-10
pm25
46 (Unhealthy for Sensitive Groups)
38 (Unhealthy for Sensitive Groups)
42 (Unhealthy for Sensitive Groups)
58 (Unhealthy)
75 (Very Unhealthy)
89 (Very Unhealthy)
46 (Unhealthy for Sensitive Groups)
33 (Moderate)
30 (Moderate)
31 (Moderate)
25 (Moderate)
27 (Moderate)
40 (Unhealthy for Sensitive Groups)
45 (Unhealthy for Sensitive Groups)
57 (Unhealthy)
62 (Unhealthy)
84 (Very Unhealthy)
62 (Unhealthy)
60 (Unhealthy)
46 (Unhealthy for Sensitive Groups)
co
655 (Good)
611 (Good)
624 (Good)
714 (Good)
908 (Good)
802 (Good)
612 (Good)
697 (Good)
747 (Good)
751 (Good)
744 (Good)
667 (Good)
589 (Good)
651 (Good)
644 (Good)
936 (Good)
1 (Good)
745 (Good)
565 (Good)
646 (Good)
no2
32 (Good)
38 (Good)
37 (Good)
24 (Good)
37 (Good)
44 (Moderate)
35 (Good)
28 (Good)
26 (Good)
22 (Good)
27 (Good)
22 (Good)
26 (Good)
32 (Good)
39 (Good)
29 (Good)
49 (Moderate)
36 (Good)
41 (Moderate)
39 (Good)
o3
166 (Unhealthy)
133 (Unhealthy for Sensitive Groups)
94 (Moderate)
79 (Moderate)
51 (Good)
48 (Good)
55 (Good)
74 (Moderate)
87 (Moderate)
148 (Unhealthy for Sensitive Groups)
125 (Unhealthy for Sensitive Groups)
129 (Unhealthy for Sensitive Groups)
116 (Moderate)
132 (Unhealthy for Sensitive Groups)
106 (Moderate)
81 (Moderate)
64 (Good)
48 (Good)
67 (Good)
77 (Moderate)
pm10
94 (Unhealthy)
76 (Unhealthy for Sensitive Groups)
81 (Unhealthy)
81 (Unhealthy)
100 (Unhealthy)
123 (Very Unhealthy)
84 (Unhealthy)
54 (Unhealthy for Sensitive Groups)
54 (Unhealthy for Sensitive Groups)
58 (Unhealthy for Sensitive Groups)
46 (Moderate)
50 (Unhealthy for Sensitive Groups)
68 (Unhealthy for Sensitive Groups)
77 (Unhealthy for Sensitive Groups)
89 (Unhealthy)
86 (Unhealthy)
119 (Very Unhealthy)
99 (Unhealthy)
93 (Unhealthy)
76 (Unhealthy for Sensitive Groups)
so2
9.4 (Good)
7.9 (Good)
3.2 (Good)
3.4 (Good)
5.2 (Good)
5.1 (Good)
3.9 (Good)
4.7 (Good)
4.2 (Good)
5.4 (Good)
4.9 (Good)
5.2 (Good)
5.2 (Good)
8.5 (Good)
7.5 (Good)
4.7 (Good)
4 (Good)
4.4 (Good)
3.7 (Good)
4.4 (Good)
data source »
耐火材料厂
Friday, May 27, 2022, 3:00 PM
PM2,5 61 (Unhealthy)
particulate matter (PM2.5) dust
NO2 22 (Good)
nitrogen dioxide (NO2)
PM10 69 (Unhealthy for Sensitive Groups)
particulate matter (PM10) suspended dust
CO 219 (Good)
carbon monoxide (CO)
O3 0.05 (Good)
ozone (O3)
SO2 7.7 (Good)
sulfur dioxide (SO2)
耐火材料厂
index
2022-05-27
pm25
28
no2
22
pm10
35
co
579
o3
22
so2
4.6
耐火材料厂
2018-10 2020-05
index
2020-05
2020-04
2020-03
2020-02
2020-01
2019-12
2019-11
2019-10
2019-09
2019-08
2019-07
2019-06
2019-05
2019-04
2019-03
2019-02
2019-01
2018-12
2018-11
2018-10
pm25
46
38
42
58
75
89
46
33
30
31
25
27
40
45
57
62
84
62
60
46
co
655
611
624
714
908
802
612
697
747
751
744
667
589
651
644
936
1
745
565
646
no2
32
38
37
24
37
44
35
28
26
22
27
22
26
32
39
29
49
36
41
39
o3
166
133
94
79
51
48
55
74
87
148
125
129
116
132
106
81
64
48
67
77
pm10
94
76
81
81
100
123
84
54
54
58
46
50
68
77
89
86
119
99
93
76
so2
9.4
7.9
3.2
3.4
5.2
5.1
3.9
4.7
4.2
5.4
4.9
5.2
5.2
8.5
7.5
4.7
4
4.4
3.7
4.4
* Pollution data source:
https://openaq.org
(ChinaAQIData)
The data is licensed under CC-By 4.0
PM2,5 61 (Unhealthy)
NO2 22 (Good)
PM10 69 (Unhealthy for Sensitive Groups)
CO 219 (Good)
O3 0 (Good)
SO2 8 (Good)
Data on air pollution from recent days in Hujia Yuanzi
| index | 2022-05-27 |
|---|---|
| pm25 | 28 Moderate |
| no2 | 22 Good |
| pm10 | 35 Moderate |
| co | 579 Good |
| o3 | 22 Good |
| so2 | 5 Good |

| index | 2020-05 | 2020-04 | 2020-03 | 2020-02 | 2020-01 | 2019-12 | 2019-11 | 2019-10 | 2019-09 | 2019-08 | 2019-07 | 2019-06 | 2019-05 | 2019-04 | 2019-03 | 2019-02 | 2019-01 | 2018-12 | 2018-11 | 2018-10 |
|---|---|---|---|---|---|---|---|---|---|---|---|---|---|---|---|---|---|---|---|---|
| pm25 | 46 (Unhealthy for Sensitive Groups) | 38 (Unhealthy for Sensitive Groups) | 42 (Unhealthy for Sensitive Groups) | 58 (Unhealthy) | 75 (Very Unhealthy) | 89 (Very Unhealthy) | 46 (Unhealthy for Sensitive Groups) | 33 (Moderate) | 30 (Moderate) | 31 (Moderate) | 25 (Moderate) | 27 (Moderate) | 40 (Unhealthy for Sensitive Groups) | 45 (Unhealthy for Sensitive Groups) | 57 (Unhealthy) | 62 (Unhealthy) | 84 (Very Unhealthy) | 62 (Unhealthy) | 60 (Unhealthy) | 46 (Unhealthy for Sensitive Groups) |
| co | 655 (Good) | 611 (Good) | 624 (Good) | 714 (Good) | 908 (Good) | 802 (Good) | 612 (Good) | 697 (Good) | 747 (Good) | 751 (Good) | 744 (Good) | 667 (Good) | 589 (Good) | 651 (Good) | 644 (Good) | 936 (Good) | 1 (Good) | 745 (Good) | 565 (Good) | 646 (Good) |
| no2 | 32 (Good) | 38 (Good) | 37 (Good) | 24 (Good) | 37 (Good) | 44 (Moderate) | 35 (Good) | 28 (Good) | 26 (Good) | 22 (Good) | 27 (Good) | 22 (Good) | 26 (Good) | 32 (Good) | 39 (Good) | 29 (Good) | 49 (Moderate) | 36 (Good) | 41 (Moderate) | 39 (Good) |
| o3 | 166 (Unhealthy) | 133 (Unhealthy for Sensitive Groups) | 94 (Moderate) | 79 (Moderate) | 51 (Good) | 48 (Good) | 55 (Good) | 74 (Moderate) | 87 (Moderate) | 148 (Unhealthy for Sensitive Groups) | 125 (Unhealthy for Sensitive Groups) | 129 (Unhealthy for Sensitive Groups) | 116 (Moderate) | 132 (Unhealthy for Sensitive Groups) | 106 (Moderate) | 81 (Moderate) | 64 (Good) | 48 (Good) | 67 (Good) | 77 (Moderate) |
| pm10 | 94 (Unhealthy) | 76 (Unhealthy for Sensitive Groups) | 81 (Unhealthy) | 81 (Unhealthy) | 100 (Unhealthy) | 123 (Very Unhealthy) | 84 (Unhealthy) | 54 (Unhealthy for Sensitive Groups) | 54 (Unhealthy for Sensitive Groups) | 58 (Unhealthy for Sensitive Groups) | 46 (Moderate) | 50 (Unhealthy for Sensitive Groups) | 68 (Unhealthy for Sensitive Groups) | 77 (Unhealthy for Sensitive Groups) | 89 (Unhealthy) | 86 (Unhealthy) | 119 (Very Unhealthy) | 99 (Unhealthy) | 93 (Unhealthy) | 76 (Unhealthy for Sensitive Groups) |
| so2 | 9.4 (Good) | 7.9 (Good) | 3.2 (Good) | 3.4 (Good) | 5.2 (Good) | 5.1 (Good) | 3.9 (Good) | 4.7 (Good) | 4.2 (Good) | 5.4 (Good) | 4.9 (Good) | 5.2 (Good) | 5.2 (Good) | 8.5 (Good) | 7.5 (Good) | 4.7 (Good) | 4 (Good) | 4.4 (Good) | 3.7 (Good) | 4.4 (Good) |
PM2,5 61 (Unhealthy)
particulate matter (PM2.5) dustNO2 22 (Good)
nitrogen dioxide (NO2)PM10 69 (Unhealthy for Sensitive Groups)
particulate matter (PM10) suspended dustCO 219 (Good)
carbon monoxide (CO)O3 0.05 (Good)
ozone (O3)SO2 7.7 (Good)
sulfur dioxide (SO2)耐火材料厂
| index | 2022-05-27 |
|---|---|
| pm25 | 28 |
| no2 | 22 |
| pm10 | 35 |
| co | 579 |
| o3 | 22 |
| so2 | 4.6 |
耐火材料厂

| index | 2020-05 | 2020-04 | 2020-03 | 2020-02 | 2020-01 | 2019-12 | 2019-11 | 2019-10 | 2019-09 | 2019-08 | 2019-07 | 2019-06 | 2019-05 | 2019-04 | 2019-03 | 2019-02 | 2019-01 | 2018-12 | 2018-11 | 2018-10 |
|---|---|---|---|---|---|---|---|---|---|---|---|---|---|---|---|---|---|---|---|---|
| pm25 | 46 | 38 | 42 | 58 | 75 | 89 | 46 | 33 | 30 | 31 | 25 | 27 | 40 | 45 | 57 | 62 | 84 | 62 | 60 | 46 |
| co | 655 | 611 | 624 | 714 | 908 | 802 | 612 | 697 | 747 | 751 | 744 | 667 | 589 | 651 | 644 | 936 | 1 | 745 | 565 | 646 |
| no2 | 32 | 38 | 37 | 24 | 37 | 44 | 35 | 28 | 26 | 22 | 27 | 22 | 26 | 32 | 39 | 29 | 49 | 36 | 41 | 39 |
| o3 | 166 | 133 | 94 | 79 | 51 | 48 | 55 | 74 | 87 | 148 | 125 | 129 | 116 | 132 | 106 | 81 | 64 | 48 | 67 | 77 |
| pm10 | 94 | 76 | 81 | 81 | 100 | 123 | 84 | 54 | 54 | 58 | 46 | 50 | 68 | 77 | 89 | 86 | 119 | 99 | 93 | 76 |
| so2 | 9.4 | 7.9 | 3.2 | 3.4 | 5.2 | 5.1 | 3.9 | 4.7 | 4.2 | 5.4 | 4.9 | 5.2 | 5.2 | 8.5 | 7.5 | 4.7 | 4 | 4.4 | 3.7 | 4.4 |