Air Pollution in Xiyao: Real-time Air Quality Index and smog alert.
Pollution and air quality forecast for Xiyao. Today is Tuesday, June 16, 2026. The following air pollution values have been recorded for Xiyao:- particulate matter (PM2.5) dust - 61 (Unhealthy)
- nitrogen dioxide (NO2) - 22 (Good)
- particulate matter (PM10) suspended dust - 69 (Unhealthy for Sensitive Groups)
- carbon monoxide (CO) - 219 (Good)
- ozone (O3) - 0 (Good)
- sulfur dioxide (SO2) - 8 (Good)

What is the air quality in Xiyao today? Is the air polluted in Xiyao?. Is there smog?
What is the current level of PM2.5 in Xiyao? (particulate matter (PM2.5) dust)
Today's PM2.5 level is:
61 (Unhealthy)
For comparison, the highest level of PM2.5 in Xiyao in the last 7 days was: 28 (Friday, May 27, 2022) and the lowest: 28 (Friday, May 27, 2022).
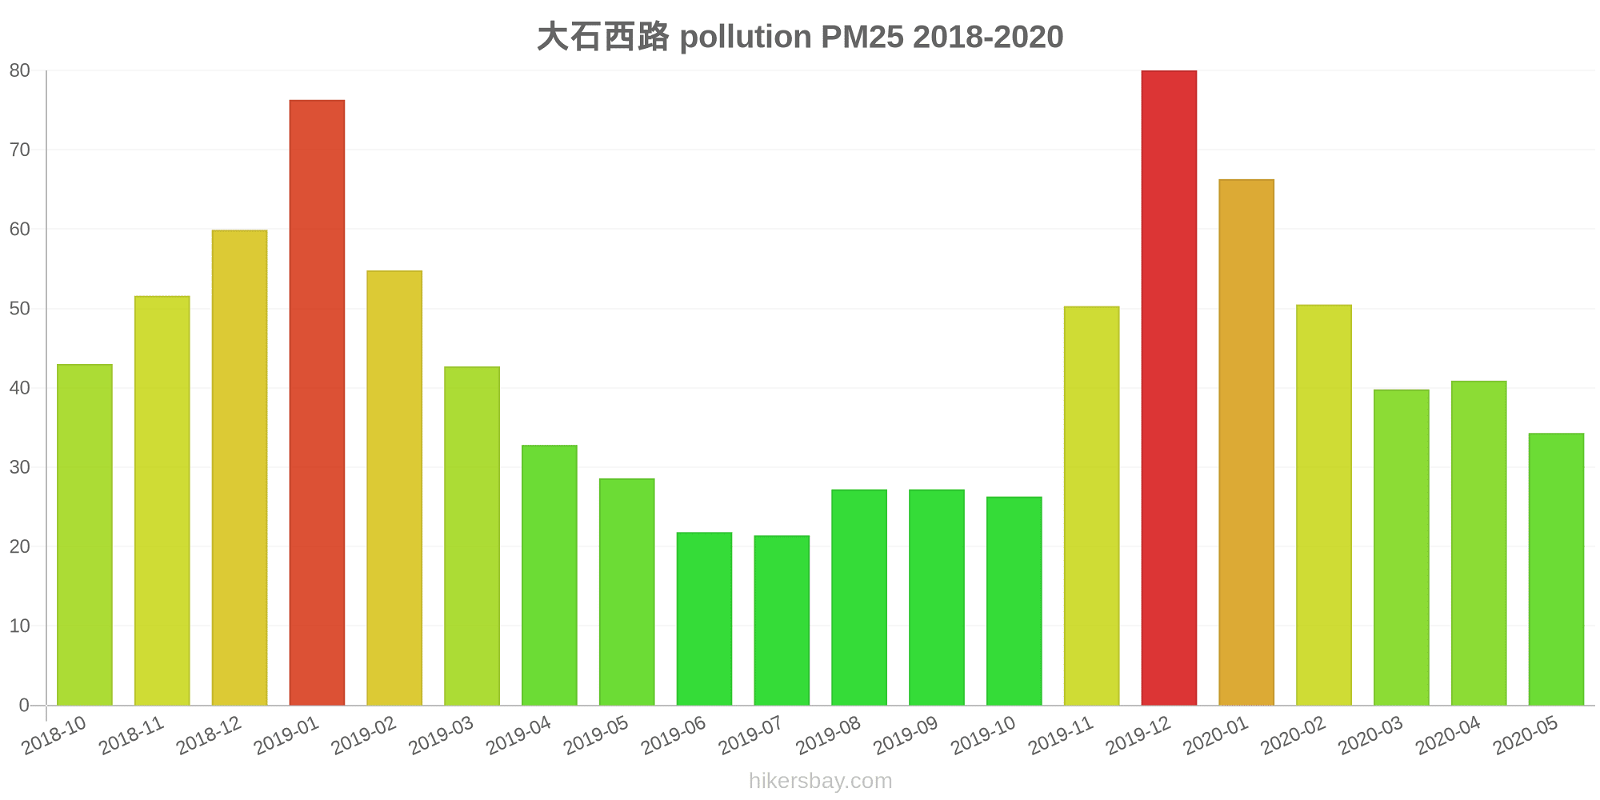
The highest PM2.5 values were recorded: 80 (December 2019).
The lowest level of particulate matter PM2.5 pollution occurs in month: July (21).
How high is the level of NO2? (nitrogen dioxide (NO2))
22 (Good)
What is the level of PM10 today in Xiyao? (particulate matter (PM10) suspended dust)
The current level of particulate matter PM10 in Xiyao is:
69 (Unhealthy for Sensitive Groups)
The highest PM10 values usually occur in month: 116 (January 2019).
The lowest value of particulate matter PM10 pollution in Xiyao is usually recorded in: July (38).
How high is the CO level? (carbon monoxide (CO))
219 (Good)
How is the O3 level today in Xiyao? (ozone (O3))
0 (Good)
What is the level of SO2 pollution? (sulfur dioxide (SO2))
8 (Good)
Current data Friday, May 27, 2022, 3:00 PM
PM2,5 61 (Unhealthy)
NO2 22 (Good)
PM10 69 (Unhealthy for Sensitive Groups)
CO 219 (Good)
O3 0 (Good)
SO2 8 (Good)
Data on air pollution from recent days in Xiyao
index
2022-05-27
pm25
28
Moderate
no2
22
Good
pm10
35
Moderate
co
579
Good
o3
22
Good
so2
5
Good
data source »
Air pollution in Xiyao from October 2018 to May 2020

index
2020-05
2020-04
2020-03
2020-02
2020-01
2019-12
2019-11
2019-10
2019-09
2019-08
2019-07
2019-06
2019-05
2019-04
2019-03
2019-02
2019-01
2018-12
2018-11
2018-10
pm25
34 (Moderate)
41 (Unhealthy for Sensitive Groups)
40 (Unhealthy for Sensitive Groups)
51 (Unhealthy for Sensitive Groups)
66 (Unhealthy)
80 (Very Unhealthy)
50 (Unhealthy for Sensitive Groups)
26 (Moderate)
27 (Moderate)
27 (Moderate)
21 (Moderate)
22 (Moderate)
29 (Moderate)
33 (Moderate)
43 (Unhealthy for Sensitive Groups)
55 (Unhealthy for Sensitive Groups)
76 (Very Unhealthy)
60 (Unhealthy)
52 (Unhealthy for Sensitive Groups)
43 (Unhealthy for Sensitive Groups)
co
654 (Good)
657 (Good)
724 (Good)
726 (Good)
1 (Good)
944 (Good)
753 (Good)
898 (Good)
944 (Good)
820 (Good)
790 (Good)
864 (Good)
789 (Good)
969 (Good)
827 (Good)
939 (Good)
1 (Good)
906 (Good)
931 (Good)
1 (Good)
no2
42 (Moderate)
40 (Moderate)
36 (Good)
22 (Good)
42 (Moderate)
55 (Moderate)
41 (Moderate)
38 (Good)
40 (Good)
37 (Good)
35 (Good)
27 (Good)
32 (Good)
45 (Moderate)
51 (Moderate)
42 (Moderate)
60 (Moderate)
52 (Moderate)
49 (Moderate)
48 (Moderate)
o3
207 (Very Unhealthy)
137 (Unhealthy for Sensitive Groups)
113 (Moderate)
97 (Moderate)
63 (Good)
56 (Good)
56 (Good)
75 (Moderate)
98 (Moderate)
189 (Very Unhealthy)
151 (Unhealthy)
166 (Unhealthy)
141 (Unhealthy for Sensitive Groups)
147 (Unhealthy for Sensitive Groups)
100 (Moderate)
70 (Moderate)
59 (Good)
35 (Good)
57 (Good)
70 (Moderate)
pm10
66 (Unhealthy for Sensitive Groups)
71 (Unhealthy for Sensitive Groups)
73 (Unhealthy for Sensitive Groups)
70 (Unhealthy for Sensitive Groups)
85 (Unhealthy)
112 (Very Unhealthy)
80 (Unhealthy)
42 (Moderate)
44 (Moderate)
47 (Moderate)
38 (Moderate)
42 (Moderate)
54 (Unhealthy for Sensitive Groups)
61 (Unhealthy for Sensitive Groups)
81 (Unhealthy)
89 (Unhealthy)
116 (Very Unhealthy)
102 (Unhealthy)
87 (Unhealthy)
73 (Unhealthy for Sensitive Groups)
so2
5.8 (Good)
6.3 (Good)
8.1 (Good)
7.5 (Good)
7.5 (Good)
8 (Good)
6.5 (Good)
5.6 (Good)
5.2 (Good)
4.9 (Good)
4.7 (Good)
7.1 (Good)
6.7 (Good)
7.7 (Good)
7.4 (Good)
5.6 (Good)
6.3 (Good)
6.8 (Good)
8 (Good)
7.5 (Good)
data source »
大石西路
Friday, May 27, 2022, 3:00 PM
PM2,5 61 (Unhealthy)
particulate matter (PM2.5) dust
NO2 22 (Good)
nitrogen dioxide (NO2)
PM10 69 (Unhealthy for Sensitive Groups)
particulate matter (PM10) suspended dust
CO 219 (Good)
carbon monoxide (CO)
O3 0.05 (Good)
ozone (O3)
SO2 7.7 (Good)
sulfur dioxide (SO2)
大石西路
index
2022-05-27
pm25
28
no2
22
pm10
35
co
579
o3
22
so2
4.6
大石西路
2018-10 2020-05
index
2020-05
2020-04
2020-03
2020-02
2020-01
2019-12
2019-11
2019-10
2019-09
2019-08
2019-07
2019-06
2019-05
2019-04
2019-03
2019-02
2019-01
2018-12
2018-11
2018-10
pm25
34
41
40
51
66
80
50
26
27
27
21
22
29
33
43
55
76
60
52
43
co
654
657
724
726
1
944
753
898
944
820
790
864
789
969
827
939
1
906
931
1
no2
42
40
36
22
42
55
41
38
40
37
35
27
32
45
51
42
60
52
49
48
o3
207
137
113
97
63
56
56
75
98
189
151
166
141
147
100
70
59
35
57
70
pm10
66
71
73
70
85
112
80
42
44
47
38
42
54
61
81
89
116
102
87
73
so2
5.8
6.3
8.1
7.5
7.5
8
6.5
5.6
5.2
4.9
4.7
7.1
6.7
7.7
7.4
5.6
6.3
6.8
8
7.5
* Pollution data source:
https://openaq.org
(ChinaAQIData)
The data is licensed under CC-By 4.0
PM2,5 61 (Unhealthy)
NO2 22 (Good)
PM10 69 (Unhealthy for Sensitive Groups)
CO 219 (Good)
O3 0 (Good)
SO2 8 (Good)
Data on air pollution from recent days in Xiyao
| index | 2022-05-27 |
|---|---|
| pm25 | 28 Moderate |
| no2 | 22 Good |
| pm10 | 35 Moderate |
| co | 579 Good |
| o3 | 22 Good |
| so2 | 5 Good |

| index | 2020-05 | 2020-04 | 2020-03 | 2020-02 | 2020-01 | 2019-12 | 2019-11 | 2019-10 | 2019-09 | 2019-08 | 2019-07 | 2019-06 | 2019-05 | 2019-04 | 2019-03 | 2019-02 | 2019-01 | 2018-12 | 2018-11 | 2018-10 |
|---|---|---|---|---|---|---|---|---|---|---|---|---|---|---|---|---|---|---|---|---|
| pm25 | 34 (Moderate) | 41 (Unhealthy for Sensitive Groups) | 40 (Unhealthy for Sensitive Groups) | 51 (Unhealthy for Sensitive Groups) | 66 (Unhealthy) | 80 (Very Unhealthy) | 50 (Unhealthy for Sensitive Groups) | 26 (Moderate) | 27 (Moderate) | 27 (Moderate) | 21 (Moderate) | 22 (Moderate) | 29 (Moderate) | 33 (Moderate) | 43 (Unhealthy for Sensitive Groups) | 55 (Unhealthy for Sensitive Groups) | 76 (Very Unhealthy) | 60 (Unhealthy) | 52 (Unhealthy for Sensitive Groups) | 43 (Unhealthy for Sensitive Groups) |
| co | 654 (Good) | 657 (Good) | 724 (Good) | 726 (Good) | 1 (Good) | 944 (Good) | 753 (Good) | 898 (Good) | 944 (Good) | 820 (Good) | 790 (Good) | 864 (Good) | 789 (Good) | 969 (Good) | 827 (Good) | 939 (Good) | 1 (Good) | 906 (Good) | 931 (Good) | 1 (Good) |
| no2 | 42 (Moderate) | 40 (Moderate) | 36 (Good) | 22 (Good) | 42 (Moderate) | 55 (Moderate) | 41 (Moderate) | 38 (Good) | 40 (Good) | 37 (Good) | 35 (Good) | 27 (Good) | 32 (Good) | 45 (Moderate) | 51 (Moderate) | 42 (Moderate) | 60 (Moderate) | 52 (Moderate) | 49 (Moderate) | 48 (Moderate) |
| o3 | 207 (Very Unhealthy) | 137 (Unhealthy for Sensitive Groups) | 113 (Moderate) | 97 (Moderate) | 63 (Good) | 56 (Good) | 56 (Good) | 75 (Moderate) | 98 (Moderate) | 189 (Very Unhealthy) | 151 (Unhealthy) | 166 (Unhealthy) | 141 (Unhealthy for Sensitive Groups) | 147 (Unhealthy for Sensitive Groups) | 100 (Moderate) | 70 (Moderate) | 59 (Good) | 35 (Good) | 57 (Good) | 70 (Moderate) |
| pm10 | 66 (Unhealthy for Sensitive Groups) | 71 (Unhealthy for Sensitive Groups) | 73 (Unhealthy for Sensitive Groups) | 70 (Unhealthy for Sensitive Groups) | 85 (Unhealthy) | 112 (Very Unhealthy) | 80 (Unhealthy) | 42 (Moderate) | 44 (Moderate) | 47 (Moderate) | 38 (Moderate) | 42 (Moderate) | 54 (Unhealthy for Sensitive Groups) | 61 (Unhealthy for Sensitive Groups) | 81 (Unhealthy) | 89 (Unhealthy) | 116 (Very Unhealthy) | 102 (Unhealthy) | 87 (Unhealthy) | 73 (Unhealthy for Sensitive Groups) |
| so2 | 5.8 (Good) | 6.3 (Good) | 8.1 (Good) | 7.5 (Good) | 7.5 (Good) | 8 (Good) | 6.5 (Good) | 5.6 (Good) | 5.2 (Good) | 4.9 (Good) | 4.7 (Good) | 7.1 (Good) | 6.7 (Good) | 7.7 (Good) | 7.4 (Good) | 5.6 (Good) | 6.3 (Good) | 6.8 (Good) | 8 (Good) | 7.5 (Good) |
PM2,5 61 (Unhealthy)
particulate matter (PM2.5) dustNO2 22 (Good)
nitrogen dioxide (NO2)PM10 69 (Unhealthy for Sensitive Groups)
particulate matter (PM10) suspended dustCO 219 (Good)
carbon monoxide (CO)O3 0.05 (Good)
ozone (O3)SO2 7.7 (Good)
sulfur dioxide (SO2)大石西路
| index | 2022-05-27 |
|---|---|
| pm25 | 28 |
| no2 | 22 |
| pm10 | 35 |
| co | 579 |
| o3 | 22 |
| so2 | 4.6 |
大石西路

| index | 2020-05 | 2020-04 | 2020-03 | 2020-02 | 2020-01 | 2019-12 | 2019-11 | 2019-10 | 2019-09 | 2019-08 | 2019-07 | 2019-06 | 2019-05 | 2019-04 | 2019-03 | 2019-02 | 2019-01 | 2018-12 | 2018-11 | 2018-10 |
|---|---|---|---|---|---|---|---|---|---|---|---|---|---|---|---|---|---|---|---|---|
| pm25 | 34 | 41 | 40 | 51 | 66 | 80 | 50 | 26 | 27 | 27 | 21 | 22 | 29 | 33 | 43 | 55 | 76 | 60 | 52 | 43 |
| co | 654 | 657 | 724 | 726 | 1 | 944 | 753 | 898 | 944 | 820 | 790 | 864 | 789 | 969 | 827 | 939 | 1 | 906 | 931 | 1 |
| no2 | 42 | 40 | 36 | 22 | 42 | 55 | 41 | 38 | 40 | 37 | 35 | 27 | 32 | 45 | 51 | 42 | 60 | 52 | 49 | 48 |
| o3 | 207 | 137 | 113 | 97 | 63 | 56 | 56 | 75 | 98 | 189 | 151 | 166 | 141 | 147 | 100 | 70 | 59 | 35 | 57 | 70 |
| pm10 | 66 | 71 | 73 | 70 | 85 | 112 | 80 | 42 | 44 | 47 | 38 | 42 | 54 | 61 | 81 | 89 | 116 | 102 | 87 | 73 |
| so2 | 5.8 | 6.3 | 8.1 | 7.5 | 7.5 | 8 | 6.5 | 5.6 | 5.2 | 4.9 | 4.7 | 7.1 | 6.7 | 7.7 | 7.4 | 5.6 | 6.3 | 6.8 | 8 | 7.5 |