Air Pollution in Lingyansi: Real-time Air Quality Index and smog alert.
Pollution and air quality forecast for Lingyansi. Today is Tuesday, June 16, 2026. The following air pollution values have been recorded for Lingyansi:- particulate matter (PM2.5) dust - 61 (Unhealthy)
- nitrogen dioxide (NO2) - 22 (Good)
- particulate matter (PM10) suspended dust - 69 (Unhealthy for Sensitive Groups)
- carbon monoxide (CO) - 219 (Good)
- ozone (O3) - 0 (Good)
- sulfur dioxide (SO2) - 8 (Good)

What is the air quality in Lingyansi today? Is the air polluted in Lingyansi?. Is there smog?
What is the current level of PM2.5 in Lingyansi? (particulate matter (PM2.5) dust)
Today's PM2.5 level is:
61 (Unhealthy)
For comparison, the highest level of PM2.5 in Lingyansi in the last 7 days was: 28 (Friday, May 27, 2022) and the lowest: 28 (Friday, May 27, 2022).
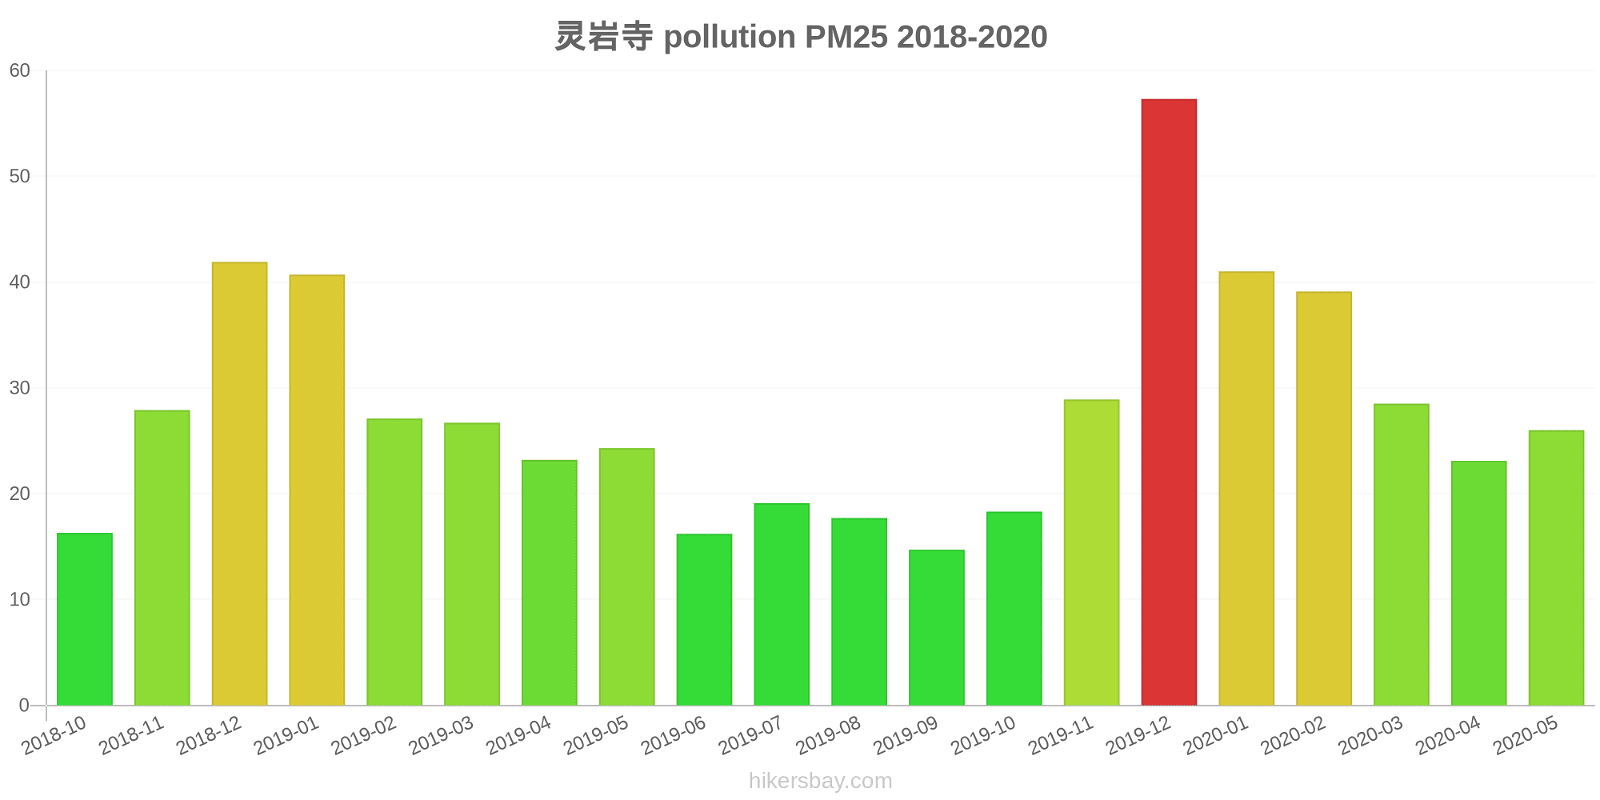
The highest PM2.5 values were recorded: 57 (December 2019).
The lowest level of particulate matter PM2.5 pollution occurs in month: September (15).
How high is the level of NO2? (nitrogen dioxide (NO2))
22 (Good)
What is the level of PM10 today in Lingyansi? (particulate matter (PM10) suspended dust)
The current level of particulate matter PM10 in Lingyansi is:
69 (Unhealthy for Sensitive Groups)
The highest PM10 values usually occur in month: 80 (December 2019).
The lowest value of particulate matter PM10 pollution in Lingyansi is usually recorded in: September (24).
How high is the CO level? (carbon monoxide (CO))
219 (Good)
How is the O3 level today in Lingyansi? (ozone (O3))
0 (Good)
What is the level of SO2 pollution? (sulfur dioxide (SO2))
8 (Good)
Current data Friday, May 27, 2022, 3:00 PM
PM2,5 61 (Unhealthy)
NO2 22 (Good)
PM10 69 (Unhealthy for Sensitive Groups)
CO 219 (Good)
O3 0 (Good)
SO2 8 (Good)
Data on air pollution from recent days in Lingyansi
index
2022-05-27
pm25
28
Moderate
no2
22
Good
pm10
35
Moderate
co
579
Good
o3
22
Good
so2
5
Good
data source »
Air pollution in Lingyansi from October 2018 to May 2020

index
2020-05
2020-04
2020-03
2020-02
2020-01
2019-12
2019-11
2019-10
2019-09
2019-08
2019-07
2019-06
2019-05
2019-04
2019-03
2019-02
2019-01
2018-12
2018-11
2018-10
pm25
26 (Moderate)
23 (Moderate)
29 (Moderate)
39 (Unhealthy for Sensitive Groups)
41 (Unhealthy for Sensitive Groups)
57 (Unhealthy)
29 (Moderate)
18 (Moderate)
15 (Moderate)
18 (Moderate)
19 (Moderate)
16 (Moderate)
24 (Moderate)
23 (Moderate)
27 (Moderate)
27 (Moderate)
41 (Unhealthy for Sensitive Groups)
42 (Unhealthy for Sensitive Groups)
28 (Moderate)
16 (Moderate)
co
432 (Good)
408 (Good)
399 (Good)
473 (Good)
734 (Good)
689 (Good)
561 (Good)
517 (Good)
321 (Good)
417 (Good)
370 (Good)
289 (Good)
344 (Good)
412 (Good)
372 (Good)
728 (Good)
676 (Good)
680 (Good)
397 (Good)
446 (Good)
no2
12 (Good)
13 (Good)
14 (Good)
8.2 (Good)
16 (Good)
30 (Good)
19 (Good)
13 (Good)
8.9 (Good)
8 (Good)
10 (Good)
9 (Good)
14 (Good)
14 (Good)
17 (Good)
11 (Good)
17 (Good)
29 (Good)
23 (Good)
16 (Good)
o3
176 (Unhealthy)
139 (Unhealthy for Sensitive Groups)
126 (Unhealthy for Sensitive Groups)
99 (Moderate)
86 (Moderate)
80 (Moderate)
73 (Moderate)
102 (Moderate)
110 (Moderate)
157 (Unhealthy)
137 (Unhealthy for Sensitive Groups)
146 (Unhealthy for Sensitive Groups)
134 (Unhealthy for Sensitive Groups)
145 (Unhealthy for Sensitive Groups)
116 (Moderate)
91 (Moderate)
85 (Moderate)
59 (Good)
91 (Moderate)
104 (Moderate)
pm10
41 (Moderate)
36 (Moderate)
44 (Moderate)
55 (Unhealthy for Sensitive Groups)
55 (Unhealthy for Sensitive Groups)
80 (Unhealthy for Sensitive Groups)
43 (Moderate)
26 (Moderate)
24 (Moderate)
27 (Moderate)
30 (Moderate)
26 (Moderate)
36 (Moderate)
38 (Moderate)
48 (Moderate)
49 (Moderate)
72 (Unhealthy for Sensitive Groups)
70 (Unhealthy for Sensitive Groups)
51 (Unhealthy for Sensitive Groups)
31 (Moderate)
so2
16 (Good)
9 (Good)
12 (Good)
11 (Good)
10 (Good)
9.9 (Good)
5.2 (Good)
8.6 (Good)
7.7 (Good)
12 (Good)
9 (Good)
9.8 (Good)
11 (Good)
12 (Good)
9.7 (Good)
8.4 (Good)
9.1 (Good)
6.3 (Good)
4.6 (Good)
6.4 (Good)
data source »
灵岩寺
Friday, May 27, 2022, 3:00 PM
PM2,5 61 (Unhealthy)
particulate matter (PM2.5) dust
NO2 22 (Good)
nitrogen dioxide (NO2)
PM10 69 (Unhealthy for Sensitive Groups)
particulate matter (PM10) suspended dust
CO 219 (Good)
carbon monoxide (CO)
O3 0.05 (Good)
ozone (O3)
SO2 7.7 (Good)
sulfur dioxide (SO2)
灵岩寺
index
2022-05-27
pm25
28
no2
22
pm10
35
co
579
o3
22
so2
4.6
灵岩寺
2018-10 2020-05
index
2020-05
2020-04
2020-03
2020-02
2020-01
2019-12
2019-11
2019-10
2019-09
2019-08
2019-07
2019-06
2019-05
2019-04
2019-03
2019-02
2019-01
2018-12
2018-11
2018-10
pm25
26
23
29
39
41
57
29
18
15
18
19
16
24
23
27
27
41
42
28
16
co
432
408
399
473
734
689
561
517
321
417
370
289
344
412
372
728
676
680
397
446
no2
12
13
14
8.2
16
30
19
13
8.9
8
10
9
14
14
17
11
17
29
23
16
o3
176
139
126
99
86
80
73
102
110
157
137
146
134
145
116
91
85
59
91
104
pm10
41
36
44
55
55
80
43
26
24
27
30
26
36
38
48
49
72
70
51
31
so2
16
9
12
11
10
9.9
5.2
8.6
7.7
12
9
9.8
11
12
9.7
8.4
9.1
6.3
4.6
6.4
* Pollution data source:
https://openaq.org
(ChinaAQIData)
The data is licensed under CC-By 4.0
PM2,5 61 (Unhealthy)
NO2 22 (Good)
PM10 69 (Unhealthy for Sensitive Groups)
CO 219 (Good)
O3 0 (Good)
SO2 8 (Good)
Data on air pollution from recent days in Lingyansi
| index | 2022-05-27 |
|---|---|
| pm25 | 28 Moderate |
| no2 | 22 Good |
| pm10 | 35 Moderate |
| co | 579 Good |
| o3 | 22 Good |
| so2 | 5 Good |

| index | 2020-05 | 2020-04 | 2020-03 | 2020-02 | 2020-01 | 2019-12 | 2019-11 | 2019-10 | 2019-09 | 2019-08 | 2019-07 | 2019-06 | 2019-05 | 2019-04 | 2019-03 | 2019-02 | 2019-01 | 2018-12 | 2018-11 | 2018-10 |
|---|---|---|---|---|---|---|---|---|---|---|---|---|---|---|---|---|---|---|---|---|
| pm25 | 26 (Moderate) | 23 (Moderate) | 29 (Moderate) | 39 (Unhealthy for Sensitive Groups) | 41 (Unhealthy for Sensitive Groups) | 57 (Unhealthy) | 29 (Moderate) | 18 (Moderate) | 15 (Moderate) | 18 (Moderate) | 19 (Moderate) | 16 (Moderate) | 24 (Moderate) | 23 (Moderate) | 27 (Moderate) | 27 (Moderate) | 41 (Unhealthy for Sensitive Groups) | 42 (Unhealthy for Sensitive Groups) | 28 (Moderate) | 16 (Moderate) |
| co | 432 (Good) | 408 (Good) | 399 (Good) | 473 (Good) | 734 (Good) | 689 (Good) | 561 (Good) | 517 (Good) | 321 (Good) | 417 (Good) | 370 (Good) | 289 (Good) | 344 (Good) | 412 (Good) | 372 (Good) | 728 (Good) | 676 (Good) | 680 (Good) | 397 (Good) | 446 (Good) |
| no2 | 12 (Good) | 13 (Good) | 14 (Good) | 8.2 (Good) | 16 (Good) | 30 (Good) | 19 (Good) | 13 (Good) | 8.9 (Good) | 8 (Good) | 10 (Good) | 9 (Good) | 14 (Good) | 14 (Good) | 17 (Good) | 11 (Good) | 17 (Good) | 29 (Good) | 23 (Good) | 16 (Good) |
| o3 | 176 (Unhealthy) | 139 (Unhealthy for Sensitive Groups) | 126 (Unhealthy for Sensitive Groups) | 99 (Moderate) | 86 (Moderate) | 80 (Moderate) | 73 (Moderate) | 102 (Moderate) | 110 (Moderate) | 157 (Unhealthy) | 137 (Unhealthy for Sensitive Groups) | 146 (Unhealthy for Sensitive Groups) | 134 (Unhealthy for Sensitive Groups) | 145 (Unhealthy for Sensitive Groups) | 116 (Moderate) | 91 (Moderate) | 85 (Moderate) | 59 (Good) | 91 (Moderate) | 104 (Moderate) |
| pm10 | 41 (Moderate) | 36 (Moderate) | 44 (Moderate) | 55 (Unhealthy for Sensitive Groups) | 55 (Unhealthy for Sensitive Groups) | 80 (Unhealthy for Sensitive Groups) | 43 (Moderate) | 26 (Moderate) | 24 (Moderate) | 27 (Moderate) | 30 (Moderate) | 26 (Moderate) | 36 (Moderate) | 38 (Moderate) | 48 (Moderate) | 49 (Moderate) | 72 (Unhealthy for Sensitive Groups) | 70 (Unhealthy for Sensitive Groups) | 51 (Unhealthy for Sensitive Groups) | 31 (Moderate) |
| so2 | 16 (Good) | 9 (Good) | 12 (Good) | 11 (Good) | 10 (Good) | 9.9 (Good) | 5.2 (Good) | 8.6 (Good) | 7.7 (Good) | 12 (Good) | 9 (Good) | 9.8 (Good) | 11 (Good) | 12 (Good) | 9.7 (Good) | 8.4 (Good) | 9.1 (Good) | 6.3 (Good) | 4.6 (Good) | 6.4 (Good) |
PM2,5 61 (Unhealthy)
particulate matter (PM2.5) dustNO2 22 (Good)
nitrogen dioxide (NO2)PM10 69 (Unhealthy for Sensitive Groups)
particulate matter (PM10) suspended dustCO 219 (Good)
carbon monoxide (CO)O3 0.05 (Good)
ozone (O3)SO2 7.7 (Good)
sulfur dioxide (SO2)灵岩寺
| index | 2022-05-27 |
|---|---|
| pm25 | 28 |
| no2 | 22 |
| pm10 | 35 |
| co | 579 |
| o3 | 22 |
| so2 | 4.6 |
灵岩寺

| index | 2020-05 | 2020-04 | 2020-03 | 2020-02 | 2020-01 | 2019-12 | 2019-11 | 2019-10 | 2019-09 | 2019-08 | 2019-07 | 2019-06 | 2019-05 | 2019-04 | 2019-03 | 2019-02 | 2019-01 | 2018-12 | 2018-11 | 2018-10 |
|---|---|---|---|---|---|---|---|---|---|---|---|---|---|---|---|---|---|---|---|---|
| pm25 | 26 | 23 | 29 | 39 | 41 | 57 | 29 | 18 | 15 | 18 | 19 | 16 | 24 | 23 | 27 | 27 | 41 | 42 | 28 | 16 |
| co | 432 | 408 | 399 | 473 | 734 | 689 | 561 | 517 | 321 | 417 | 370 | 289 | 344 | 412 | 372 | 728 | 676 | 680 | 397 | 446 |
| no2 | 12 | 13 | 14 | 8.2 | 16 | 30 | 19 | 13 | 8.9 | 8 | 10 | 9 | 14 | 14 | 17 | 11 | 17 | 29 | 23 | 16 |
| o3 | 176 | 139 | 126 | 99 | 86 | 80 | 73 | 102 | 110 | 157 | 137 | 146 | 134 | 145 | 116 | 91 | 85 | 59 | 91 | 104 |
| pm10 | 41 | 36 | 44 | 55 | 55 | 80 | 43 | 26 | 24 | 27 | 30 | 26 | 36 | 38 | 48 | 49 | 72 | 70 | 51 | 31 |
| so2 | 16 | 9 | 12 | 11 | 10 | 9.9 | 5.2 | 8.6 | 7.7 | 12 | 9 | 9.8 | 11 | 12 | 9.7 | 8.4 | 9.1 | 6.3 | 4.6 | 6.4 |