Air Pollution in Shuangzhuang: Real-time Air Quality Index and smog alert.
Pollution and air quality forecast for Shuangzhuang. Today is Tuesday, June 16, 2026. The following air pollution values have been recorded for Shuangzhuang:- particulate matter (PM10) suspended dust - 179 (Very bad Hazardous)
- particulate matter (PM2.5) dust - 35 (Unhealthy for Sensitive Groups)
- ozone (O3) - 0 (Good)
- nitrogen dioxide (NO2) - 0 (Good)
- sulfur dioxide (SO2) - 0 (Good)

What is the air quality in Shuangzhuang today? Is the air polluted in Shuangzhuang?. Is there smog?
What is the level of PM10 today in Shuangzhuang? (particulate matter (PM10) suspended dust)
The current level of particulate matter PM10 in Shuangzhuang is:
179 (Very bad Hazardous)
The highest PM10 values usually occur in month: 124 (November 2018).
The lowest value of particulate matter PM10 pollution in Shuangzhuang is usually recorded in: August (36).
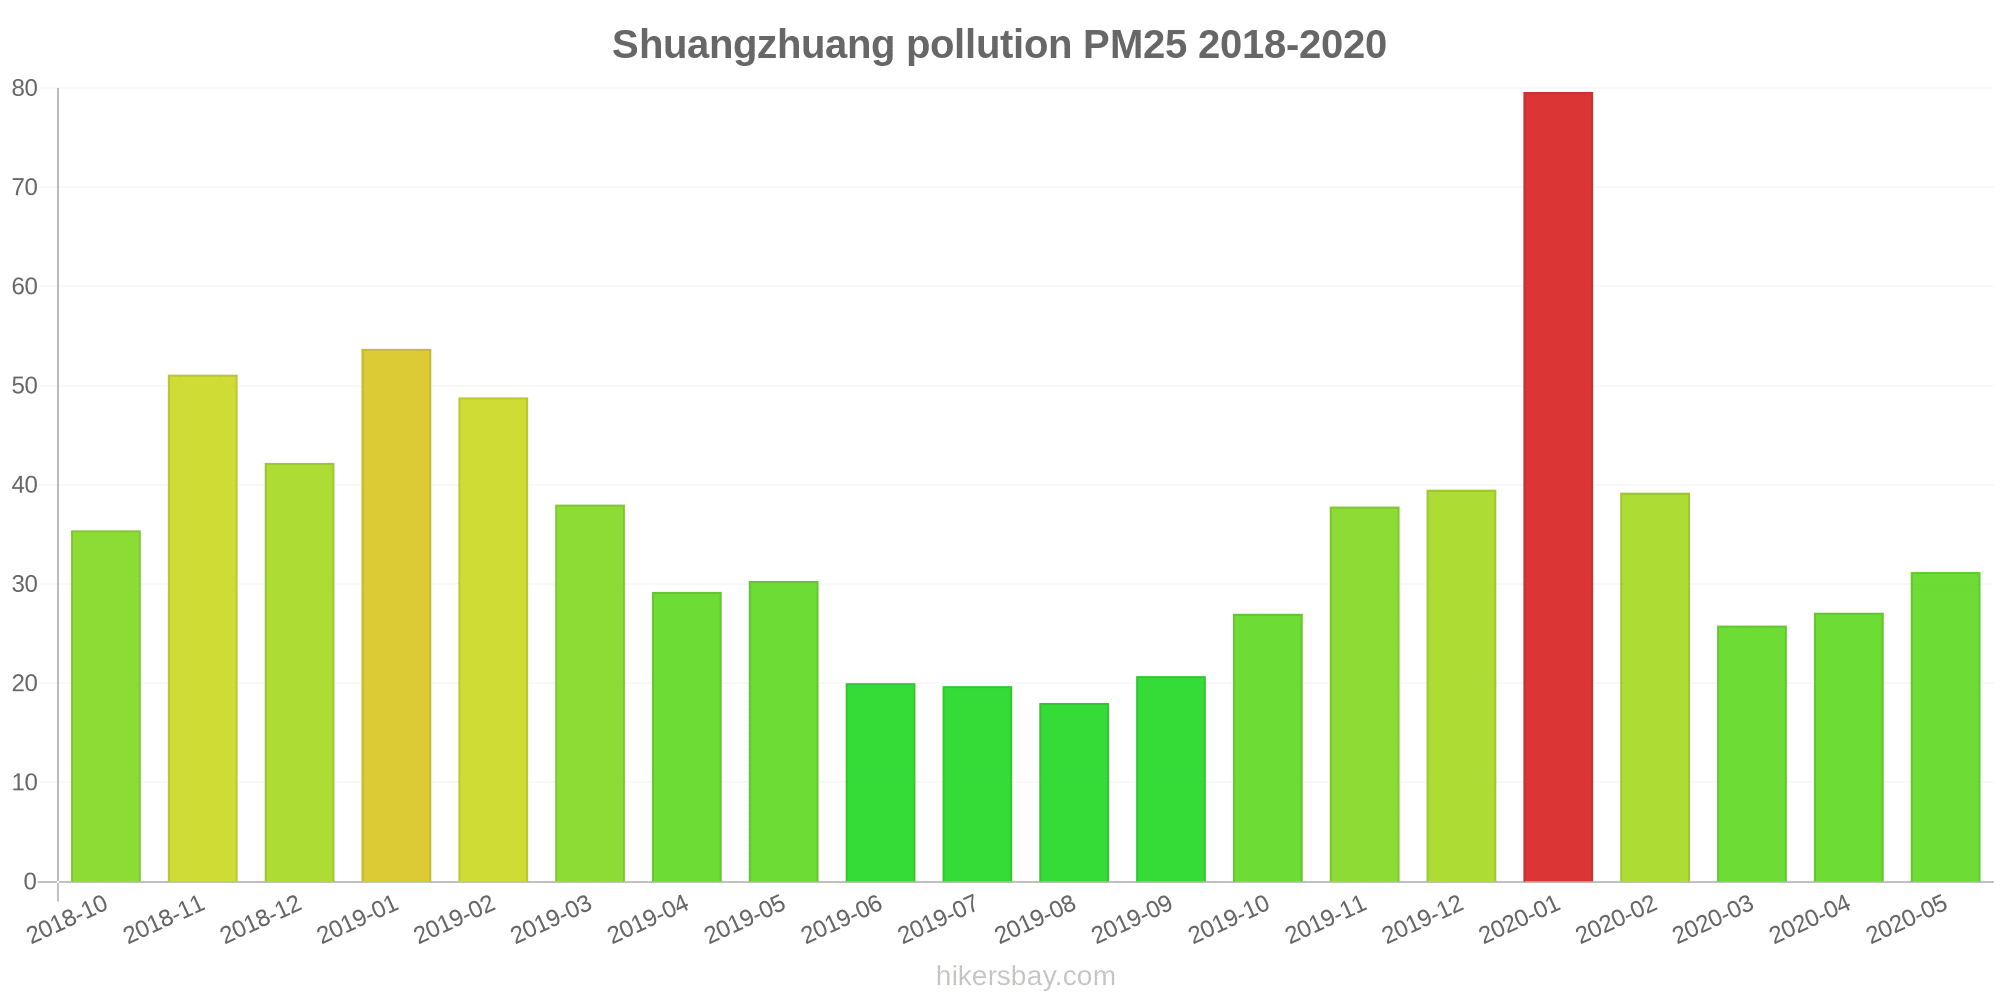
What is the current level of PM2.5 in Shuangzhuang? (particulate matter (PM2.5) dust)
Today's PM2.5 level is:
35 (Unhealthy for Sensitive Groups)
For comparison, the highest level of PM2.5 in Shuangzhuang in the last 7 days was: 56 (Friday, May 27, 2022) and the lowest: 56 (Friday, May 27, 2022).
The highest PM2.5 values were recorded: 80 (January 2020).
The lowest level of particulate matter PM2.5 pollution occurs in month: August (18).
How is the O3 level today in Shuangzhuang? (ozone (O3))
0 (Good)
How high is the level of NO2? (nitrogen dioxide (NO2))
0 (Good)
What is the level of SO2 pollution? (sulfur dioxide (SO2))
0 (Good)
Current data Friday, May 27, 2022, 12:00 PM
PM10 179 (Very bad Hazardous)
PM2,5 35 (Unhealthy for Sensitive Groups)
O3 0 (Good)
NO2 0 (Good)
SO2 0 (Good)
Data on air pollution from recent days in Shuangzhuang
index
2022-05-27
pm10
56
Unhealthy for Sensitive Groups
pm25
56
Unhealthy
o3
0
Good
no2
0
Good
so2
0
Good
data source »
Air pollution in Shuangzhuang from October 2018 to May 2020

index
2020-05
2020-04
2020-03
2020-02
2020-01
2019-12
2019-11
2019-10
2019-09
2019-08
2019-07
2019-06
2019-05
2019-04
2019-03
2019-02
2019-01
2018-12
2018-11
2018-10
pm25
31 (Moderate)
27 (Moderate)
26 (Moderate)
39 (Unhealthy for Sensitive Groups)
80 (Very Unhealthy)
40 (Unhealthy for Sensitive Groups)
38 (Unhealthy for Sensitive Groups)
27 (Moderate)
21 (Moderate)
18 (Moderate)
20 (Moderate)
20 (Moderate)
30 (Moderate)
29 (Moderate)
38 (Unhealthy for Sensitive Groups)
49 (Unhealthy for Sensitive Groups)
54 (Unhealthy for Sensitive Groups)
42 (Unhealthy for Sensitive Groups)
51 (Unhealthy for Sensitive Groups)
35 (Unhealthy for Sensitive Groups)
co
518 (Good)
503 (Good)
563 (Good)
823 (Good)
1 (Good)
1 (Good)
883 (Good)
729 (Good)
723 (Good)
586 (Good)
548 (Good)
714 (Good)
588 (Good)
679 (Good)
901 (Good)
1 (Good)
1 (Good)
1 (Good)
1 (Good)
1 (Good)
no2
29 (Good)
35 (Good)
29 (Good)
31 (Good)
50 (Moderate)
46 (Moderate)
44 (Moderate)
40 (Moderate)
37 (Good)
26 (Good)
27 (Good)
26 (Good)
28 (Good)
31 (Good)
38 (Good)
35 (Good)
52 (Moderate)
41 (Moderate)
56 (Moderate)
42 (Moderate)
o3
139 (Unhealthy for Sensitive Groups)
131 (Unhealthy for Sensitive Groups)
112 (Moderate)
105 (Moderate)
65 (Good)
68 (Good)
71 (Moderate)
89 (Moderate)
125 (Unhealthy for Sensitive Groups)
135 (Unhealthy for Sensitive Groups)
143 (Unhealthy for Sensitive Groups)
144 (Unhealthy for Sensitive Groups)
131 (Unhealthy for Sensitive Groups)
124 (Unhealthy for Sensitive Groups)
102 (Moderate)
95 (Moderate)
52 (Good)
46 (Good)
57 (Good)
85 (Moderate)
pm10
88 (Unhealthy)
64 (Unhealthy for Sensitive Groups)
78 (Unhealthy for Sensitive Groups)
87 (Unhealthy)
111 (Very Unhealthy)
71 (Unhealthy for Sensitive Groups)
70 (Unhealthy for Sensitive Groups)
53 (Unhealthy for Sensitive Groups)
36 (Moderate)
36 (Moderate)
42 (Moderate)
40 (Moderate)
96 (Unhealthy)
87 (Unhealthy)
77 (Unhealthy for Sensitive Groups)
86 (Unhealthy)
93 (Unhealthy)
101 (Unhealthy)
124 (Very Unhealthy)
70 (Unhealthy for Sensitive Groups)
so2
11 (Good)
13 (Good)
15 (Good)
25 (Good)
23 (Good)
18 (Good)
16 (Good)
12 (Good)
9.6 (Good)
11 (Good)
10 (Good)
11 (Good)
9.2 (Good)
11 (Good)
18 (Good)
25 (Good)
35 (Good)
25 (Good)
22 (Good)
9 (Good)
data source »
上海东路
Friday, May 27, 2022, 12:00 PM
PM10 179 (Very bad Hazardous)
particulate matter (PM10) suspended dust
PM2,5 35 (Unhealthy for Sensitive Groups)
particulate matter (PM2.5) dust
O3 0.04 (Good)
ozone (O3)
NO2 0 (Good)
nitrogen dioxide (NO2)
SO2 0 (Good)
sulfur dioxide (SO2)
上海东路
index
2022-05-27
pm10
56
pm25
56
o3
0.03
no2
0
so2
0
上海东路
2018-10 2020-05

index
2020-05
2020-04
2020-03
2020-02
2020-01
2019-12
2019-11
2019-10
2019-09
2019-08
2019-07
2019-06
2019-05
2019-04
2019-03
2019-02
2019-01
2018-12
2018-11
2018-10
pm25
31
27
26
39
80
40
38
27
21
18
20
20
30
29
38
49
54
42
51
35
co
518
503
563
823
1
1
883
729
723
586
548
714
588
679
901
1
1
1
1
1
no2
29
35
29
31
50
46
44
40
37
26
27
26
28
31
38
35
52
41
56
42
o3
139
131
112
105
65
68
71
89
125
135
143
144
131
124
102
95
52
46
57
85
pm10
88
64
78
87
111
71
70
53
36
36
42
40
96
87
77
86
93
101
124
70
so2
11
13
15
25
23
18
16
12
9.6
11
10
11
9.2
11
18
25
35
25
22
9
* Pollution data source:
https://openaq.org
(ChinaAQIData)
The data is licensed under CC-By 4.0
PM10 179 (Very bad Hazardous)
PM2,5 35 (Unhealthy for Sensitive Groups)
O3 0 (Good)
NO2 0 (Good)
SO2 0 (Good)
Data on air pollution from recent days in Shuangzhuang
| index | 2022-05-27 |
|---|---|
| pm10 | 56 Unhealthy for Sensitive Groups |
| pm25 | 56 Unhealthy |
| o3 | 0 Good |
| no2 | 0 Good |
| so2 | 0 Good |
| index | 2020-05 | 2020-04 | 2020-03 | 2020-02 | 2020-01 | 2019-12 | 2019-11 | 2019-10 | 2019-09 | 2019-08 | 2019-07 | 2019-06 | 2019-05 | 2019-04 | 2019-03 | 2019-02 | 2019-01 | 2018-12 | 2018-11 | 2018-10 |
|---|---|---|---|---|---|---|---|---|---|---|---|---|---|---|---|---|---|---|---|---|
| pm25 | 31 (Moderate) | 27 (Moderate) | 26 (Moderate) | 39 (Unhealthy for Sensitive Groups) | 80 (Very Unhealthy) | 40 (Unhealthy for Sensitive Groups) | 38 (Unhealthy for Sensitive Groups) | 27 (Moderate) | 21 (Moderate) | 18 (Moderate) | 20 (Moderate) | 20 (Moderate) | 30 (Moderate) | 29 (Moderate) | 38 (Unhealthy for Sensitive Groups) | 49 (Unhealthy for Sensitive Groups) | 54 (Unhealthy for Sensitive Groups) | 42 (Unhealthy for Sensitive Groups) | 51 (Unhealthy for Sensitive Groups) | 35 (Unhealthy for Sensitive Groups) |
| co | 518 (Good) | 503 (Good) | 563 (Good) | 823 (Good) | 1 (Good) | 1 (Good) | 883 (Good) | 729 (Good) | 723 (Good) | 586 (Good) | 548 (Good) | 714 (Good) | 588 (Good) | 679 (Good) | 901 (Good) | 1 (Good) | 1 (Good) | 1 (Good) | 1 (Good) | 1 (Good) |
| no2 | 29 (Good) | 35 (Good) | 29 (Good) | 31 (Good) | 50 (Moderate) | 46 (Moderate) | 44 (Moderate) | 40 (Moderate) | 37 (Good) | 26 (Good) | 27 (Good) | 26 (Good) | 28 (Good) | 31 (Good) | 38 (Good) | 35 (Good) | 52 (Moderate) | 41 (Moderate) | 56 (Moderate) | 42 (Moderate) |
| o3 | 139 (Unhealthy for Sensitive Groups) | 131 (Unhealthy for Sensitive Groups) | 112 (Moderate) | 105 (Moderate) | 65 (Good) | 68 (Good) | 71 (Moderate) | 89 (Moderate) | 125 (Unhealthy for Sensitive Groups) | 135 (Unhealthy for Sensitive Groups) | 143 (Unhealthy for Sensitive Groups) | 144 (Unhealthy for Sensitive Groups) | 131 (Unhealthy for Sensitive Groups) | 124 (Unhealthy for Sensitive Groups) | 102 (Moderate) | 95 (Moderate) | 52 (Good) | 46 (Good) | 57 (Good) | 85 (Moderate) |
| pm10 | 88 (Unhealthy) | 64 (Unhealthy for Sensitive Groups) | 78 (Unhealthy for Sensitive Groups) | 87 (Unhealthy) | 111 (Very Unhealthy) | 71 (Unhealthy for Sensitive Groups) | 70 (Unhealthy for Sensitive Groups) | 53 (Unhealthy for Sensitive Groups) | 36 (Moderate) | 36 (Moderate) | 42 (Moderate) | 40 (Moderate) | 96 (Unhealthy) | 87 (Unhealthy) | 77 (Unhealthy for Sensitive Groups) | 86 (Unhealthy) | 93 (Unhealthy) | 101 (Unhealthy) | 124 (Very Unhealthy) | 70 (Unhealthy for Sensitive Groups) |
| so2 | 11 (Good) | 13 (Good) | 15 (Good) | 25 (Good) | 23 (Good) | 18 (Good) | 16 (Good) | 12 (Good) | 9.6 (Good) | 11 (Good) | 10 (Good) | 11 (Good) | 9.2 (Good) | 11 (Good) | 18 (Good) | 25 (Good) | 35 (Good) | 25 (Good) | 22 (Good) | 9 (Good) |
PM10 179 (Very bad Hazardous)
particulate matter (PM10) suspended dustPM2,5 35 (Unhealthy for Sensitive Groups)
particulate matter (PM2.5) dustO3 0.04 (Good)
ozone (O3)NO2 0 (Good)
nitrogen dioxide (NO2)SO2 0 (Good)
sulfur dioxide (SO2)上海东路
| index | 2022-05-27 |
|---|---|
| pm10 | 56 |
| pm25 | 56 |
| o3 | 0.03 |
| no2 | 0 |
| so2 | 0 |
上海东路

| index | 2020-05 | 2020-04 | 2020-03 | 2020-02 | 2020-01 | 2019-12 | 2019-11 | 2019-10 | 2019-09 | 2019-08 | 2019-07 | 2019-06 | 2019-05 | 2019-04 | 2019-03 | 2019-02 | 2019-01 | 2018-12 | 2018-11 | 2018-10 |
|---|---|---|---|---|---|---|---|---|---|---|---|---|---|---|---|---|---|---|---|---|
| pm25 | 31 | 27 | 26 | 39 | 80 | 40 | 38 | 27 | 21 | 18 | 20 | 20 | 30 | 29 | 38 | 49 | 54 | 42 | 51 | 35 |
| co | 518 | 503 | 563 | 823 | 1 | 1 | 883 | 729 | 723 | 586 | 548 | 714 | 588 | 679 | 901 | 1 | 1 | 1 | 1 | 1 |
| no2 | 29 | 35 | 29 | 31 | 50 | 46 | 44 | 40 | 37 | 26 | 27 | 26 | 28 | 31 | 38 | 35 | 52 | 41 | 56 | 42 |
| o3 | 139 | 131 | 112 | 105 | 65 | 68 | 71 | 89 | 125 | 135 | 143 | 144 | 131 | 124 | 102 | 95 | 52 | 46 | 57 | 85 |
| pm10 | 88 | 64 | 78 | 87 | 111 | 71 | 70 | 53 | 36 | 36 | 42 | 40 | 96 | 87 | 77 | 86 | 93 | 101 | 124 | 70 |
| so2 | 11 | 13 | 15 | 25 | 23 | 18 | 16 | 12 | 9.6 | 11 | 10 | 11 | 9.2 | 11 | 18 | 25 | 35 | 25 | 22 | 9 |