Air Pollution in Lijialou: Real-time Air Quality Index and smog alert.
Pollution and air quality forecast for Lijialou. Today is Tuesday, June 16, 2026. The following air pollution values have been recorded for Lijialou:- particulate matter (PM10) suspended dust - 179 (Very bad Hazardous)
- particulate matter (PM2.5) dust - 35 (Unhealthy for Sensitive Groups)
- ozone (O3) - 0 (Good)
- nitrogen dioxide (NO2) - 0 (Good)
- sulfur dioxide (SO2) - 0 (Good)

What is the air quality in Lijialou today? Is the air polluted in Lijialou?. Is there smog?
What is the level of PM10 today in Lijialou? (particulate matter (PM10) suspended dust)
The current level of particulate matter PM10 in Lijialou is:
179 (Very bad Hazardous)
The highest PM10 values usually occur in month: 180 (May 2020).
The lowest value of particulate matter PM10 pollution in Lijialou is usually recorded in: August (44).
What is the current level of PM2.5 in Lijialou? (particulate matter (PM2.5) dust)
Today's PM2.5 level is:
35 (Unhealthy for Sensitive Groups)
For comparison, the highest level of PM2.5 in Lijialou in the last 7 days was: 56 (Friday, May 27, 2022) and the lowest: 56 (Friday, May 27, 2022).
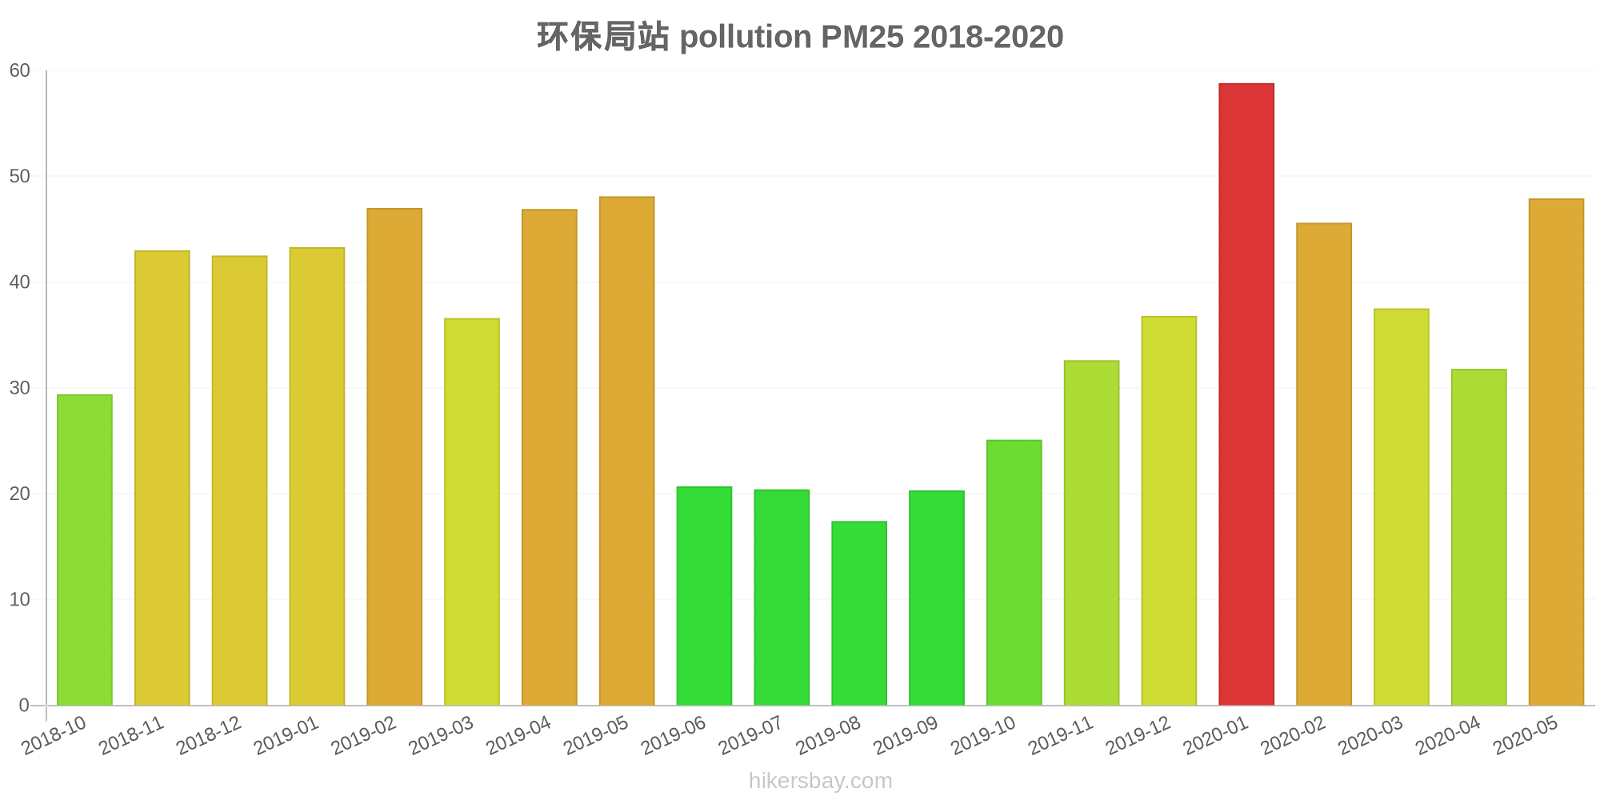
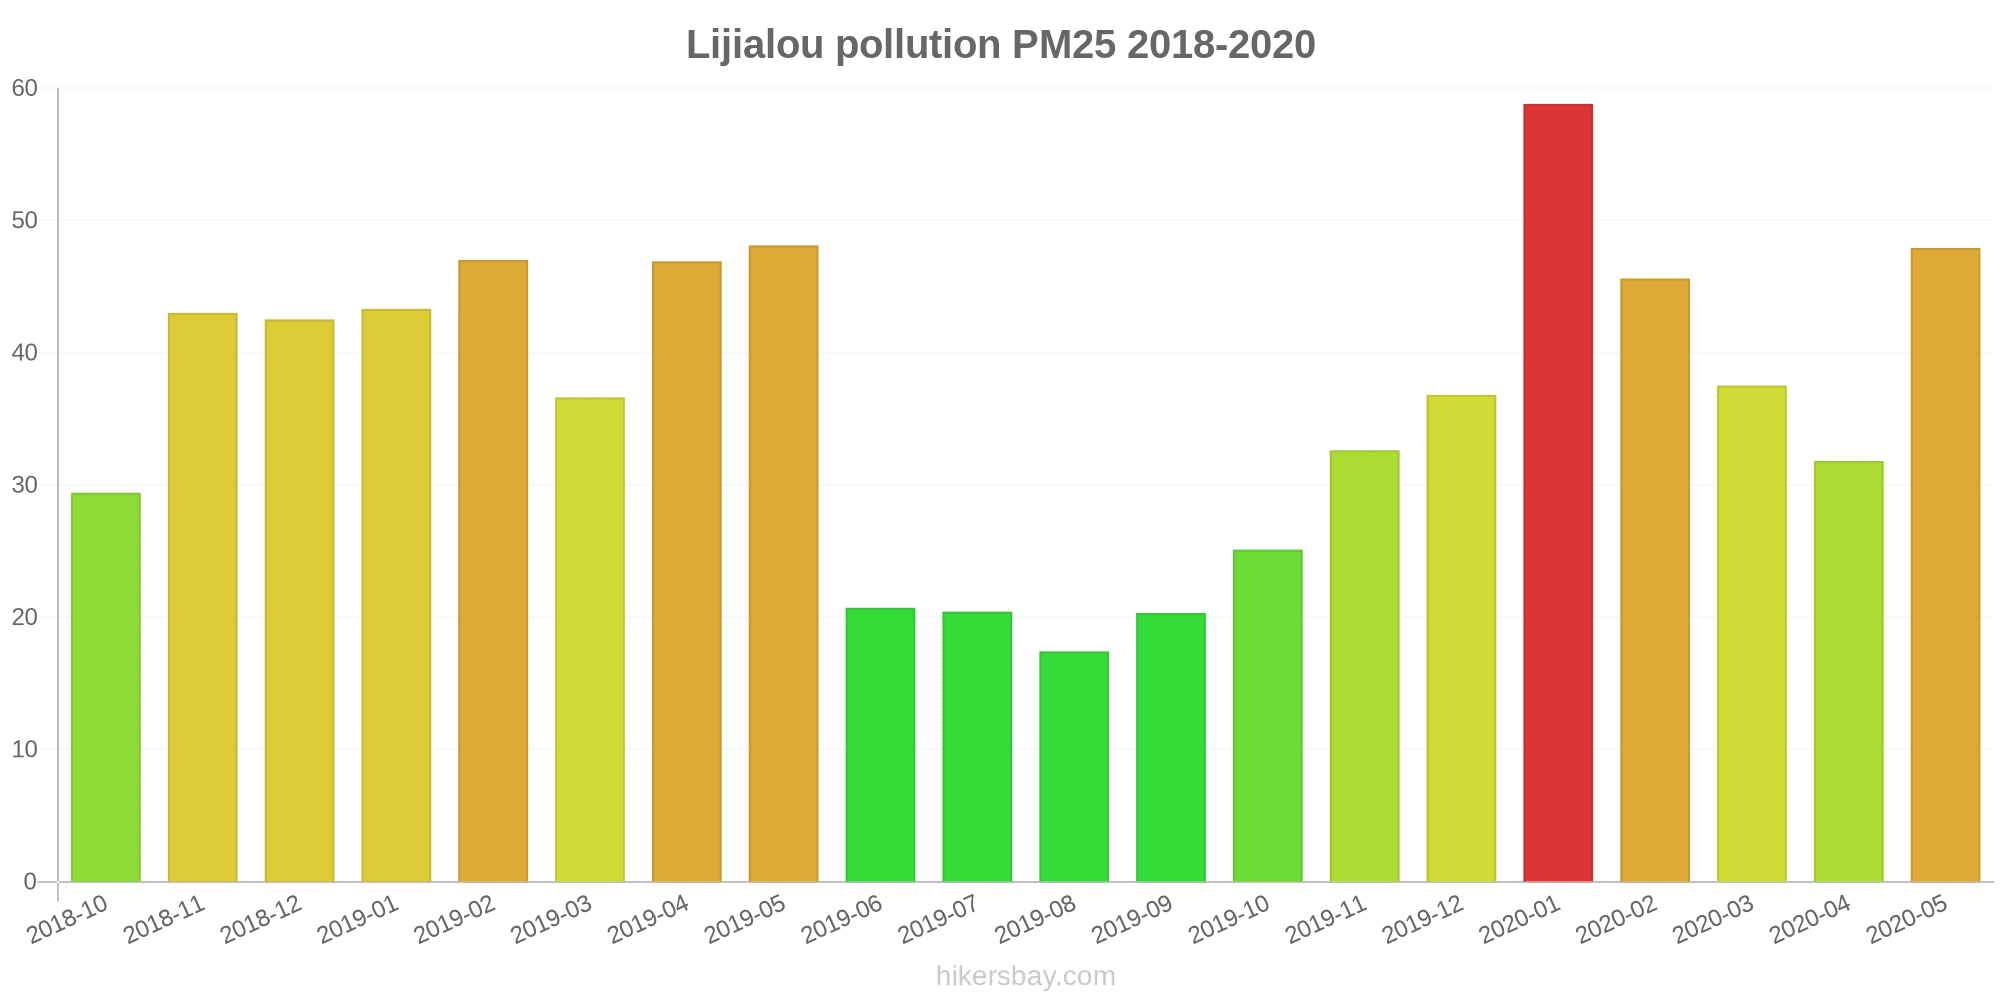
The highest PM2.5 values were recorded: 59 (January 2020).
The lowest level of particulate matter PM2.5 pollution occurs in month: August (17).
How is the O3 level today in Lijialou? (ozone (O3))
0 (Good)
How high is the level of NO2? (nitrogen dioxide (NO2))
0 (Good)
What is the level of SO2 pollution? (sulfur dioxide (SO2))
0 (Good)
Current data Friday, May 27, 2022, 12:00 PM
PM10 179 (Very bad Hazardous)
PM2,5 35 (Unhealthy for Sensitive Groups)
O3 0 (Good)
NO2 0 (Good)
SO2 0 (Good)
Data on air pollution from recent days in Lijialou
index
2022-05-27
pm10
56
Unhealthy for Sensitive Groups
pm25
56
Unhealthy
o3
0
Good
no2
0
Good
so2
0
Good
data source »
Air pollution in Lijialou from October 2018 to May 2020

index
2020-05
2020-04
2020-03
2020-02
2020-01
2019-12
2019-11
2019-10
2019-09
2019-08
2019-07
2019-06
2019-05
2019-04
2019-03
2019-02
2019-01
2018-12
2018-11
2018-10
pm25
48 (Unhealthy for Sensitive Groups)
32 (Moderate)
38 (Unhealthy for Sensitive Groups)
46 (Unhealthy for Sensitive Groups)
59 (Unhealthy)
37 (Unhealthy for Sensitive Groups)
33 (Moderate)
25 (Moderate)
20 (Moderate)
17 (Moderate)
20 (Moderate)
21 (Moderate)
48 (Unhealthy for Sensitive Groups)
47 (Unhealthy for Sensitive Groups)
37 (Unhealthy for Sensitive Groups)
47 (Unhealthy for Sensitive Groups)
43 (Unhealthy for Sensitive Groups)
43 (Unhealthy for Sensitive Groups)
43 (Unhealthy for Sensitive Groups)
29 (Moderate)
co
360 (Good)
467 (Good)
454 (Good)
659 (Good)
804 (Good)
658 (Good)
568 (Good)
637 (Good)
681 (Good)
733 (Good)
578 (Good)
598 (Good)
431 (Good)
475 (Good)
652 (Good)
747 (Good)
830 (Good)
591 (Good)
623 (Good)
685 (Good)
no2
21 (Good)
29 (Good)
23 (Good)
22 (Good)
32 (Good)
39 (Good)
32 (Good)
28 (Good)
25 (Good)
26 (Good)
22 (Good)
21 (Good)
16 (Good)
21 (Good)
31 (Good)
23 (Good)
32 (Good)
32 (Good)
34 (Good)
28 (Good)
o3
134 (Unhealthy for Sensitive Groups)
128 (Unhealthy for Sensitive Groups)
108 (Moderate)
100 (Moderate)
91 (Moderate)
78 (Moderate)
84 (Moderate)
92 (Moderate)
126 (Unhealthy for Sensitive Groups)
140 (Unhealthy for Sensitive Groups)
146 (Unhealthy for Sensitive Groups)
138 (Unhealthy for Sensitive Groups)
122 (Unhealthy for Sensitive Groups)
116 (Moderate)
100 (Moderate)
90 (Moderate)
64 (Good)
62 (Good)
79 (Moderate)
95 (Moderate)
pm10
180 (Very bad Hazardous)
94 (Unhealthy)
123 (Very Unhealthy)
108 (Unhealthy)
80 (Unhealthy)
71 (Unhealthy for Sensitive Groups)
76 (Unhealthy for Sensitive Groups)
70 (Unhealthy for Sensitive Groups)
52 (Unhealthy for Sensitive Groups)
44 (Moderate)
54 (Unhealthy for Sensitive Groups)
47 (Moderate)
130 (Very Unhealthy)
133 (Very Unhealthy)
90 (Unhealthy)
105 (Unhealthy)
76 (Unhealthy for Sensitive Groups)
117 (Very Unhealthy)
136 (Very Unhealthy)
67 (Unhealthy for Sensitive Groups)
so2
9.7 (Good)
14 (Good)
11 (Good)
12 (Good)
14 (Good)
19 (Good)
15 (Good)
11 (Good)
9.9 (Good)
12 (Good)
8.7 (Good)
7.9 (Good)
8.5 (Good)
9.6 (Good)
14 (Good)
14 (Good)
17 (Good)
22 (Good)
17 (Good)
13 (Good)
data source »
环保局站
Friday, May 27, 2022, 12:00 PM
PM10 179 (Very bad Hazardous)
particulate matter (PM10) suspended dust
PM2,5 35 (Unhealthy for Sensitive Groups)
particulate matter (PM2.5) dust
O3 0.04 (Good)
ozone (O3)
NO2 0 (Good)
nitrogen dioxide (NO2)
SO2 0 (Good)
sulfur dioxide (SO2)
环保局站
index
2022-05-27
pm10
56
pm25
56
o3
0.03
no2
0
so2
0
环保局站
2018-10 2020-05
index
2020-05
2020-04
2020-03
2020-02
2020-01
2019-12
2019-11
2019-10
2019-09
2019-08
2019-07
2019-06
2019-05
2019-04
2019-03
2019-02
2019-01
2018-12
2018-11
2018-10
pm25
48
32
38
46
59
37
33
25
20
17
20
21
48
47
37
47
43
43
43
29
co
360
467
454
659
804
658
568
637
681
733
578
598
431
475
652
747
830
591
623
685
no2
21
29
23
22
32
39
32
28
25
26
22
21
16
21
31
23
32
32
34
28
o3
134
128
108
100
91
78
84
92
126
140
146
138
122
116
100
90
64
62
79
95
pm10
180
94
123
108
80
71
76
70
52
44
54
47
130
133
90
105
76
117
136
67
so2
9.7
14
11
12
14
19
15
11
9.9
12
8.7
7.9
8.5
9.6
14
14
17
22
17
13
* Pollution data source:
https://openaq.org
(ChinaAQIData)
The data is licensed under CC-By 4.0
PM10 179 (Very bad Hazardous)
PM2,5 35 (Unhealthy for Sensitive Groups)
O3 0 (Good)
NO2 0 (Good)
SO2 0 (Good)
Data on air pollution from recent days in Lijialou
| index | 2022-05-27 |
|---|---|
| pm10 | 56 Unhealthy for Sensitive Groups |
| pm25 | 56 Unhealthy |
| o3 | 0 Good |
| no2 | 0 Good |
| so2 | 0 Good |
| index | 2020-05 | 2020-04 | 2020-03 | 2020-02 | 2020-01 | 2019-12 | 2019-11 | 2019-10 | 2019-09 | 2019-08 | 2019-07 | 2019-06 | 2019-05 | 2019-04 | 2019-03 | 2019-02 | 2019-01 | 2018-12 | 2018-11 | 2018-10 |
|---|---|---|---|---|---|---|---|---|---|---|---|---|---|---|---|---|---|---|---|---|
| pm25 | 48 (Unhealthy for Sensitive Groups) | 32 (Moderate) | 38 (Unhealthy for Sensitive Groups) | 46 (Unhealthy for Sensitive Groups) | 59 (Unhealthy) | 37 (Unhealthy for Sensitive Groups) | 33 (Moderate) | 25 (Moderate) | 20 (Moderate) | 17 (Moderate) | 20 (Moderate) | 21 (Moderate) | 48 (Unhealthy for Sensitive Groups) | 47 (Unhealthy for Sensitive Groups) | 37 (Unhealthy for Sensitive Groups) | 47 (Unhealthy for Sensitive Groups) | 43 (Unhealthy for Sensitive Groups) | 43 (Unhealthy for Sensitive Groups) | 43 (Unhealthy for Sensitive Groups) | 29 (Moderate) |
| co | 360 (Good) | 467 (Good) | 454 (Good) | 659 (Good) | 804 (Good) | 658 (Good) | 568 (Good) | 637 (Good) | 681 (Good) | 733 (Good) | 578 (Good) | 598 (Good) | 431 (Good) | 475 (Good) | 652 (Good) | 747 (Good) | 830 (Good) | 591 (Good) | 623 (Good) | 685 (Good) |
| no2 | 21 (Good) | 29 (Good) | 23 (Good) | 22 (Good) | 32 (Good) | 39 (Good) | 32 (Good) | 28 (Good) | 25 (Good) | 26 (Good) | 22 (Good) | 21 (Good) | 16 (Good) | 21 (Good) | 31 (Good) | 23 (Good) | 32 (Good) | 32 (Good) | 34 (Good) | 28 (Good) |
| o3 | 134 (Unhealthy for Sensitive Groups) | 128 (Unhealthy for Sensitive Groups) | 108 (Moderate) | 100 (Moderate) | 91 (Moderate) | 78 (Moderate) | 84 (Moderate) | 92 (Moderate) | 126 (Unhealthy for Sensitive Groups) | 140 (Unhealthy for Sensitive Groups) | 146 (Unhealthy for Sensitive Groups) | 138 (Unhealthy for Sensitive Groups) | 122 (Unhealthy for Sensitive Groups) | 116 (Moderate) | 100 (Moderate) | 90 (Moderate) | 64 (Good) | 62 (Good) | 79 (Moderate) | 95 (Moderate) |
| pm10 | 180 (Very bad Hazardous) | 94 (Unhealthy) | 123 (Very Unhealthy) | 108 (Unhealthy) | 80 (Unhealthy) | 71 (Unhealthy for Sensitive Groups) | 76 (Unhealthy for Sensitive Groups) | 70 (Unhealthy for Sensitive Groups) | 52 (Unhealthy for Sensitive Groups) | 44 (Moderate) | 54 (Unhealthy for Sensitive Groups) | 47 (Moderate) | 130 (Very Unhealthy) | 133 (Very Unhealthy) | 90 (Unhealthy) | 105 (Unhealthy) | 76 (Unhealthy for Sensitive Groups) | 117 (Very Unhealthy) | 136 (Very Unhealthy) | 67 (Unhealthy for Sensitive Groups) |
| so2 | 9.7 (Good) | 14 (Good) | 11 (Good) | 12 (Good) | 14 (Good) | 19 (Good) | 15 (Good) | 11 (Good) | 9.9 (Good) | 12 (Good) | 8.7 (Good) | 7.9 (Good) | 8.5 (Good) | 9.6 (Good) | 14 (Good) | 14 (Good) | 17 (Good) | 22 (Good) | 17 (Good) | 13 (Good) |
PM10 179 (Very bad Hazardous)
particulate matter (PM10) suspended dustPM2,5 35 (Unhealthy for Sensitive Groups)
particulate matter (PM2.5) dustO3 0.04 (Good)
ozone (O3)NO2 0 (Good)
nitrogen dioxide (NO2)SO2 0 (Good)
sulfur dioxide (SO2)环保局站
| index | 2022-05-27 |
|---|---|
| pm10 | 56 |
| pm25 | 56 |
| o3 | 0.03 |
| no2 | 0 |
| so2 | 0 |
环保局站

| index | 2020-05 | 2020-04 | 2020-03 | 2020-02 | 2020-01 | 2019-12 | 2019-11 | 2019-10 | 2019-09 | 2019-08 | 2019-07 | 2019-06 | 2019-05 | 2019-04 | 2019-03 | 2019-02 | 2019-01 | 2018-12 | 2018-11 | 2018-10 |
|---|---|---|---|---|---|---|---|---|---|---|---|---|---|---|---|---|---|---|---|---|
| pm25 | 48 | 32 | 38 | 46 | 59 | 37 | 33 | 25 | 20 | 17 | 20 | 21 | 48 | 47 | 37 | 47 | 43 | 43 | 43 | 29 |
| co | 360 | 467 | 454 | 659 | 804 | 658 | 568 | 637 | 681 | 733 | 578 | 598 | 431 | 475 | 652 | 747 | 830 | 591 | 623 | 685 |
| no2 | 21 | 29 | 23 | 22 | 32 | 39 | 32 | 28 | 25 | 26 | 22 | 21 | 16 | 21 | 31 | 23 | 32 | 32 | 34 | 28 |
| o3 | 134 | 128 | 108 | 100 | 91 | 78 | 84 | 92 | 126 | 140 | 146 | 138 | 122 | 116 | 100 | 90 | 64 | 62 | 79 | 95 |
| pm10 | 180 | 94 | 123 | 108 | 80 | 71 | 76 | 70 | 52 | 44 | 54 | 47 | 130 | 133 | 90 | 105 | 76 | 117 | 136 | 67 |
| so2 | 9.7 | 14 | 11 | 12 | 14 | 19 | 15 | 11 | 9.9 | 12 | 8.7 | 7.9 | 8.5 | 9.6 | 14 | 14 | 17 | 22 | 17 | 13 |