Air Pollution in Sanzhan Shisandui: Real-time Air Quality Index and smog alert.
Pollution and air quality forecast for Sanzhan Shisandui. Today is Wednesday, June 17, 2026. The following air pollution values have been recorded for Sanzhan Shisandui:- particulate matter (PM10) suspended dust - 179 (Very bad Hazardous)
- particulate matter (PM2.5) dust - 35 (Unhealthy for Sensitive Groups)
- ozone (O3) - 0 (Good)
- nitrogen dioxide (NO2) - 0 (Good)
- sulfur dioxide (SO2) - 0 (Good)

What is the air quality in Sanzhan Shisandui today? Is the air polluted in Sanzhan Shisandui?. Is there smog?
What is the level of PM10 today in Sanzhan Shisandui? (particulate matter (PM10) suspended dust)
The current level of particulate matter PM10 in Sanzhan Shisandui is:
179 (Very bad Hazardous)
The highest PM10 values usually occur in month: 148 (January 2020).
The lowest value of particulate matter PM10 pollution in Sanzhan Shisandui is usually recorded in: September (48).
What is the current level of PM2.5 in Sanzhan Shisandui? (particulate matter (PM2.5) dust)
Today's PM2.5 level is:
35 (Unhealthy for Sensitive Groups)
For comparison, the highest level of PM2.5 in Sanzhan Shisandui in the last 7 days was: 56 (Friday, May 27, 2022) and the lowest: 56 (Friday, May 27, 2022).
The highest PM2.5 values were recorded: 112 (January 2020).
The lowest level of particulate matter PM2.5 pollution occurs in month: August (18).
How is the O3 level today in Sanzhan Shisandui? (ozone (O3))
0 (Good)
How high is the level of NO2? (nitrogen dioxide (NO2))
0 (Good)
What is the level of SO2 pollution? (sulfur dioxide (SO2))
0 (Good)
Current data Friday, May 27, 2022, 12:00 PM
PM10 179 (Very bad Hazardous)
PM2,5 35 (Unhealthy for Sensitive Groups)
O3 0 (Good)
NO2 0 (Good)
SO2 0 (Good)
Data on air pollution from recent days in Sanzhan Shisandui
index
2022-05-27
pm10
56
Unhealthy for Sensitive Groups
pm25
56
Unhealthy
o3
0
Good
no2
0
Good
so2
0
Good
data source »
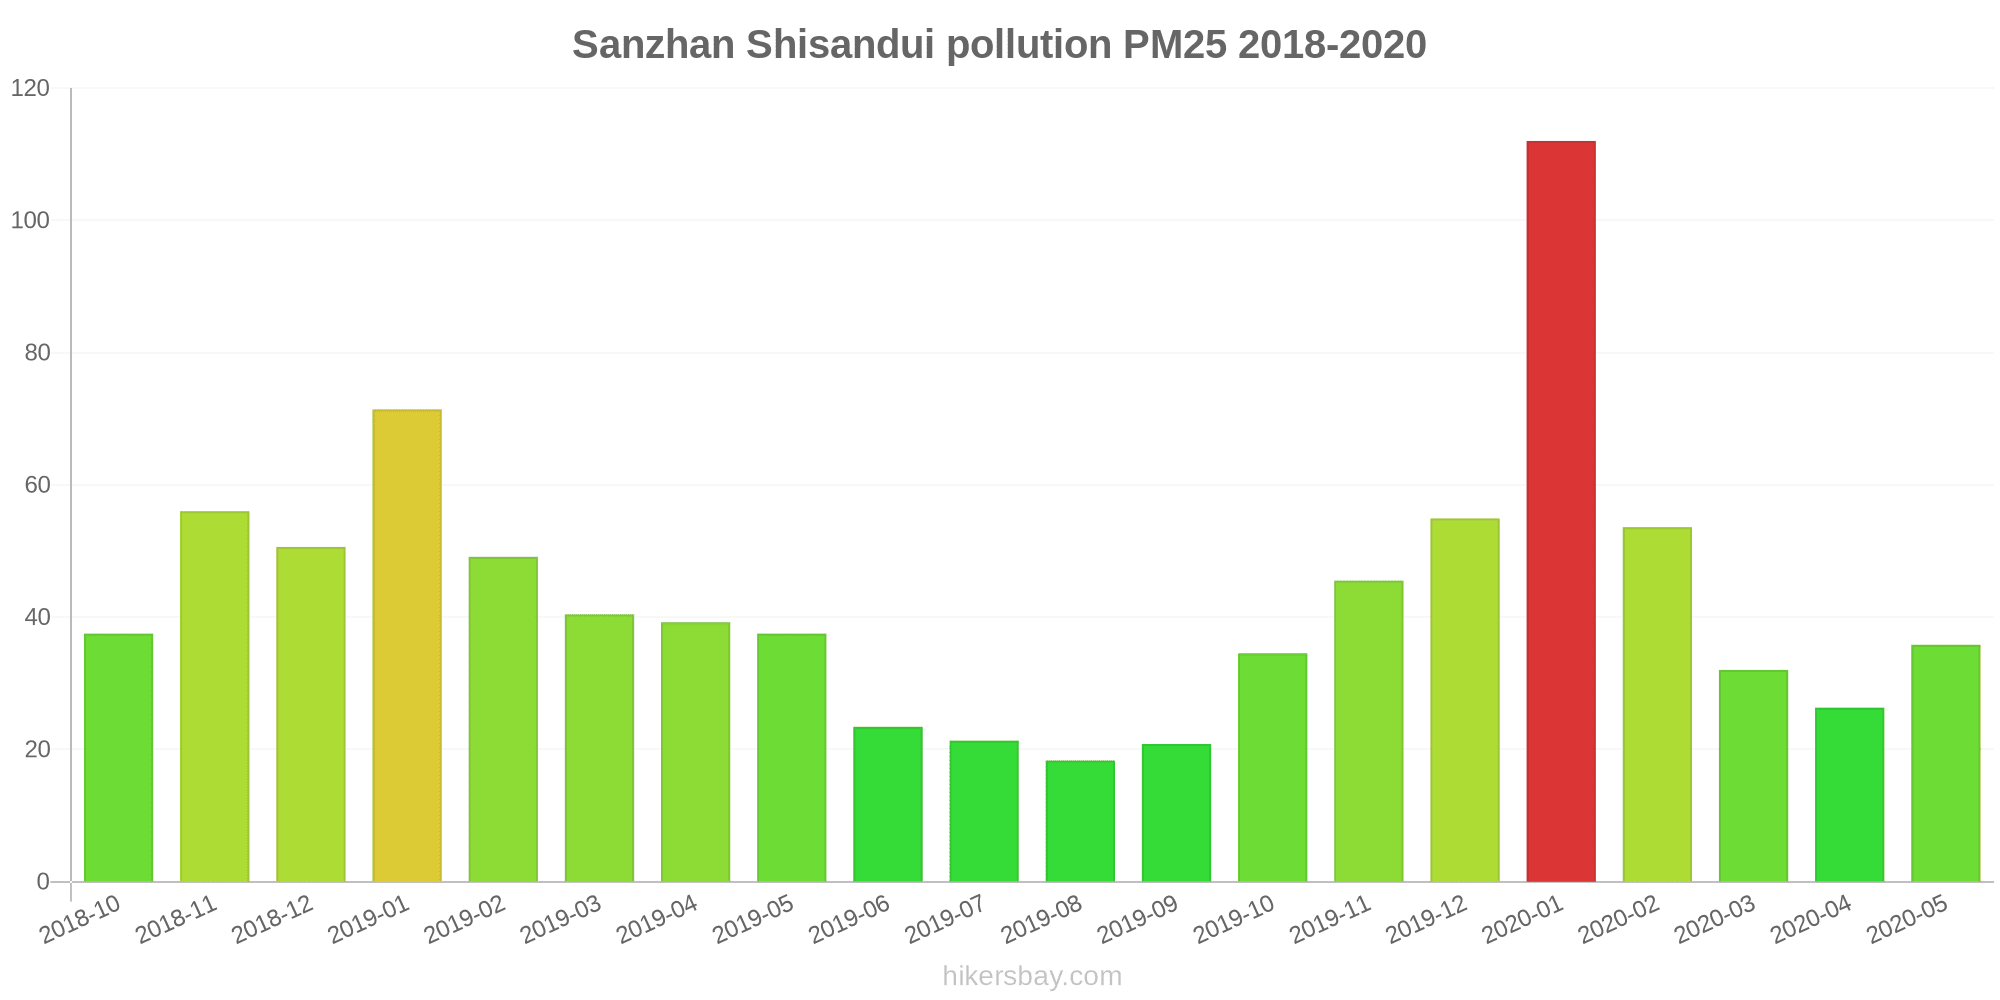
Air pollution in Sanzhan Shisandui from October 2018 to May 2020

index
2020-05
2020-04
2020-03
2020-02
2020-01
2019-12
2019-11
2019-10
2019-09
2019-08
2019-07
2019-06
2019-05
2019-04
2019-03
2019-02
2019-01
2018-12
2018-11
2018-10
pm25
36 (Unhealthy for Sensitive Groups)
26 (Moderate)
32 (Moderate)
54 (Unhealthy for Sensitive Groups)
112 (Very bad Hazardous)
55 (Unhealthy for Sensitive Groups)
46 (Unhealthy for Sensitive Groups)
35 (Moderate)
21 (Moderate)
18 (Moderate)
21 (Moderate)
23 (Moderate)
38 (Unhealthy for Sensitive Groups)
39 (Unhealthy for Sensitive Groups)
40 (Unhealthy for Sensitive Groups)
49 (Unhealthy for Sensitive Groups)
71 (Unhealthy)
51 (Unhealthy for Sensitive Groups)
56 (Unhealthy)
38 (Unhealthy for Sensitive Groups)
co
372 (Good)
492 (Good)
783 (Good)
1 (Good)
1 (Good)
1 (Good)
1 (Good)
863 (Good)
674 (Good)
724 (Good)
695 (Good)
653 (Good)
654 (Good)
974 (Good)
1 (Good)
1 (Good)
2 (Good)
1 (Good)
1 (Good)
910 (Good)
no2
25 (Good)
35 (Good)
36 (Good)
31 (Good)
41 (Moderate)
44 (Moderate)
37 (Good)
31 (Good)
24 (Good)
19 (Good)
23 (Good)
24 (Good)
22 (Good)
24 (Good)
32 (Good)
34 (Good)
43 (Moderate)
38 (Good)
44 (Moderate)
32 (Good)
o3
138 (Unhealthy for Sensitive Groups)
136 (Unhealthy for Sensitive Groups)
110 (Moderate)
113 (Moderate)
77 (Moderate)
72 (Moderate)
78 (Moderate)
104 (Moderate)
162 (Unhealthy)
168 (Unhealthy)
167 (Unhealthy)
151 (Unhealthy)
136 (Unhealthy for Sensitive Groups)
146 (Unhealthy for Sensitive Groups)
122 (Unhealthy for Sensitive Groups)
114 (Moderate)
67 (Good)
58 (Good)
74 (Moderate)
104 (Moderate)
pm10
115 (Very Unhealthy)
78 (Unhealthy for Sensitive Groups)
105 (Unhealthy)
124 (Very Unhealthy)
148 (Very Unhealthy)
98 (Unhealthy)
98 (Unhealthy)
77 (Unhealthy for Sensitive Groups)
48 (Moderate)
49 (Moderate)
62 (Unhealthy for Sensitive Groups)
49 (Moderate)
121 (Very Unhealthy)
123 (Very Unhealthy)
104 (Unhealthy)
113 (Very Unhealthy)
134 (Very Unhealthy)
123 (Very Unhealthy)
131 (Very Unhealthy)
80 (Unhealthy for Sensitive Groups)
so2
12 (Good)
21 (Good)
19 (Good)
27 (Good)
20 (Good)
21 (Good)
20 (Good)
13 (Good)
12 (Good)
13 (Good)
11 (Good)
12 (Good)
14 (Good)
20 (Good)
21 (Good)
30 (Good)
48 (Good)
44 (Good)
31 (Good)
24 (Good)
data source »
沙湖旅游区
Friday, May 27, 2022, 12:00 PM
PM10 179 (Very bad Hazardous)
particulate matter (PM10) suspended dust
PM2,5 35 (Unhealthy for Sensitive Groups)
particulate matter (PM2.5) dust
O3 0.04 (Good)
ozone (O3)
NO2 0 (Good)
nitrogen dioxide (NO2)
SO2 0 (Good)
sulfur dioxide (SO2)
沙湖旅游区
index
2022-05-27
pm10
56
pm25
56
o3
0.03
no2
0
so2
0
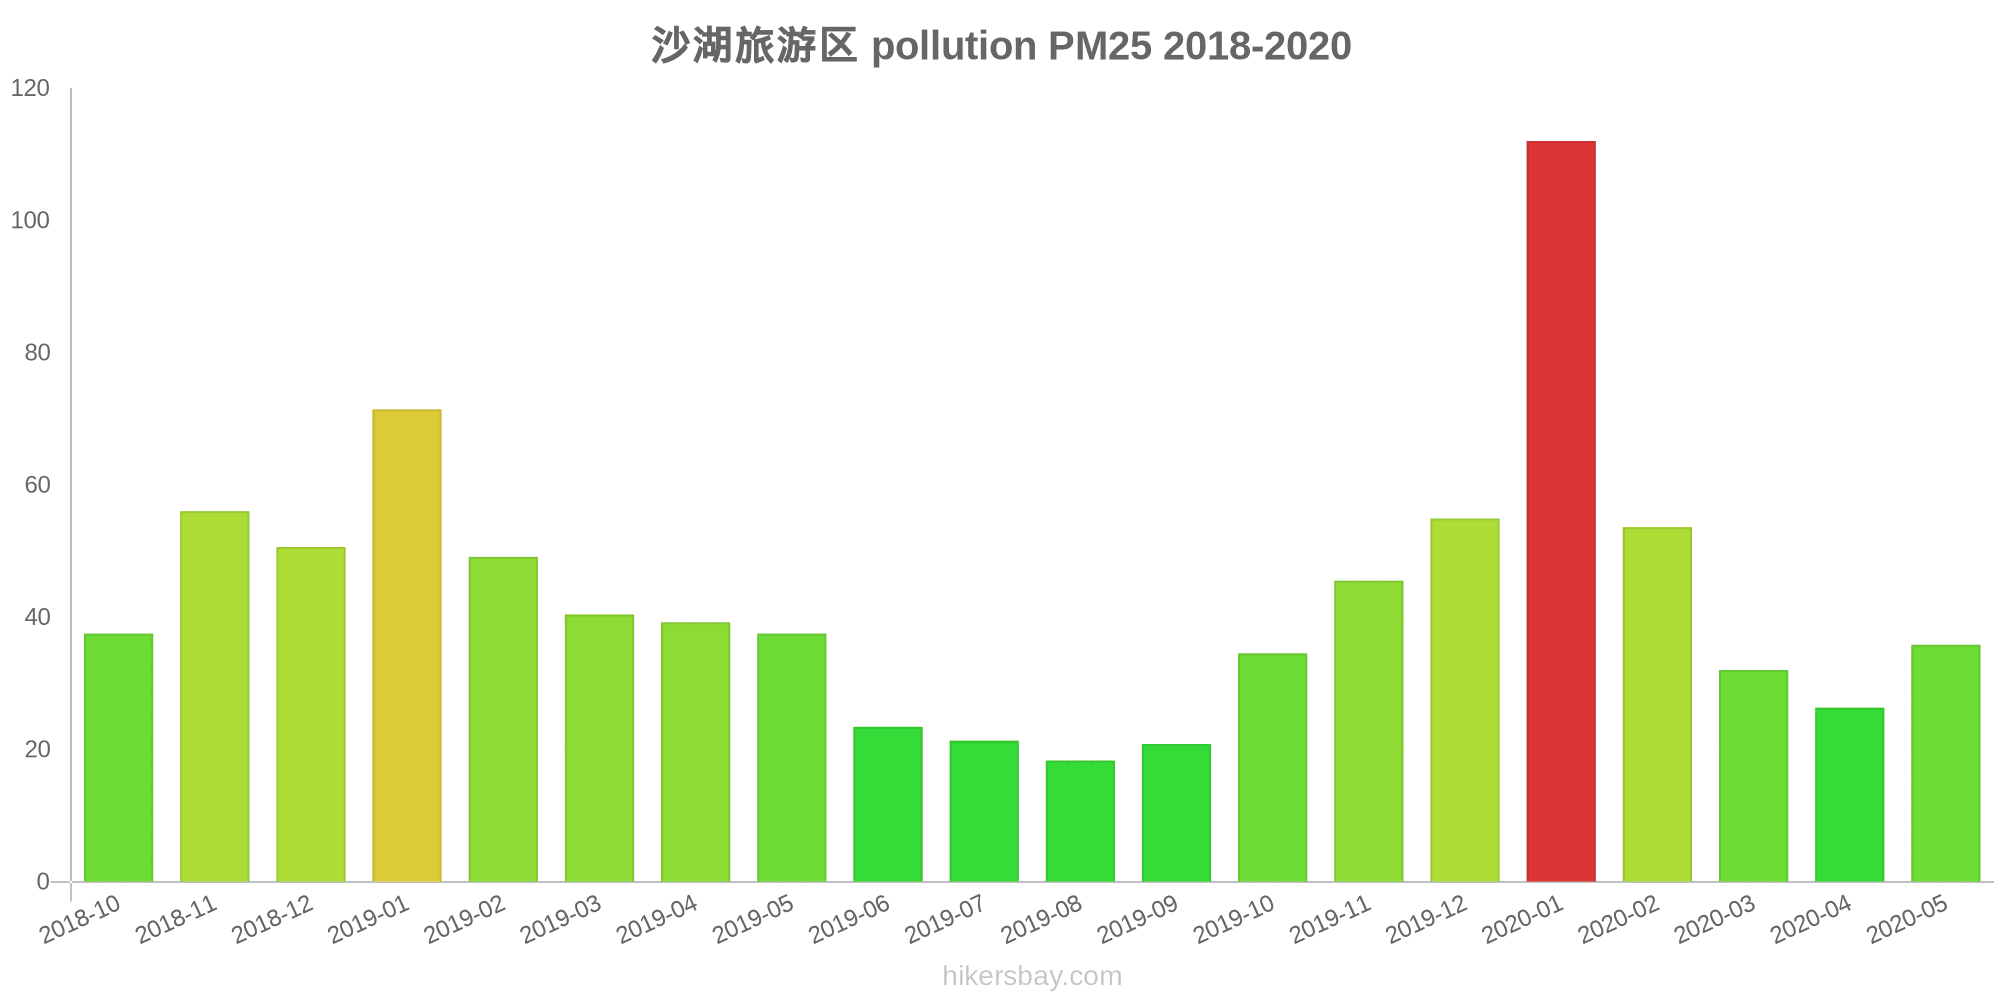
沙湖旅游区
2018-10 2020-05

index
2020-05
2020-04
2020-03
2020-02
2020-01
2019-12
2019-11
2019-10
2019-09
2019-08
2019-07
2019-06
2019-05
2019-04
2019-03
2019-02
2019-01
2018-12
2018-11
2018-10
pm25
36
26
32
54
112
55
46
35
21
18
21
23
38
39
40
49
71
51
56
38
co
372
492
783
1
1
1
1
863
674
724
695
653
654
974
1
1
2
1
1
910
no2
25
35
36
31
41
44
37
31
24
19
23
24
22
24
32
34
43
38
44
32
o3
138
136
110
113
77
72
78
104
162
168
167
151
136
146
122
114
67
58
74
104
pm10
115
78
105
124
148
98
98
77
48
49
62
49
121
123
104
113
134
123
131
80
so2
12
21
19
27
20
21
20
13
12
13
11
12
14
20
21
30
48
44
31
24
* Pollution data source:
https://openaq.org
(ChinaAQIData)
The data is licensed under CC-By 4.0
PM10 179 (Very bad Hazardous)
PM2,5 35 (Unhealthy for Sensitive Groups)
O3 0 (Good)
NO2 0 (Good)
SO2 0 (Good)
Data on air pollution from recent days in Sanzhan Shisandui
| index | 2022-05-27 |
|---|---|
| pm10 | 56 Unhealthy for Sensitive Groups |
| pm25 | 56 Unhealthy |
| o3 | 0 Good |
| no2 | 0 Good |
| so2 | 0 Good |
| index | 2020-05 | 2020-04 | 2020-03 | 2020-02 | 2020-01 | 2019-12 | 2019-11 | 2019-10 | 2019-09 | 2019-08 | 2019-07 | 2019-06 | 2019-05 | 2019-04 | 2019-03 | 2019-02 | 2019-01 | 2018-12 | 2018-11 | 2018-10 |
|---|---|---|---|---|---|---|---|---|---|---|---|---|---|---|---|---|---|---|---|---|
| pm25 | 36 (Unhealthy for Sensitive Groups) | 26 (Moderate) | 32 (Moderate) | 54 (Unhealthy for Sensitive Groups) | 112 (Very bad Hazardous) | 55 (Unhealthy for Sensitive Groups) | 46 (Unhealthy for Sensitive Groups) | 35 (Moderate) | 21 (Moderate) | 18 (Moderate) | 21 (Moderate) | 23 (Moderate) | 38 (Unhealthy for Sensitive Groups) | 39 (Unhealthy for Sensitive Groups) | 40 (Unhealthy for Sensitive Groups) | 49 (Unhealthy for Sensitive Groups) | 71 (Unhealthy) | 51 (Unhealthy for Sensitive Groups) | 56 (Unhealthy) | 38 (Unhealthy for Sensitive Groups) |
| co | 372 (Good) | 492 (Good) | 783 (Good) | 1 (Good) | 1 (Good) | 1 (Good) | 1 (Good) | 863 (Good) | 674 (Good) | 724 (Good) | 695 (Good) | 653 (Good) | 654 (Good) | 974 (Good) | 1 (Good) | 1 (Good) | 2 (Good) | 1 (Good) | 1 (Good) | 910 (Good) |
| no2 | 25 (Good) | 35 (Good) | 36 (Good) | 31 (Good) | 41 (Moderate) | 44 (Moderate) | 37 (Good) | 31 (Good) | 24 (Good) | 19 (Good) | 23 (Good) | 24 (Good) | 22 (Good) | 24 (Good) | 32 (Good) | 34 (Good) | 43 (Moderate) | 38 (Good) | 44 (Moderate) | 32 (Good) |
| o3 | 138 (Unhealthy for Sensitive Groups) | 136 (Unhealthy for Sensitive Groups) | 110 (Moderate) | 113 (Moderate) | 77 (Moderate) | 72 (Moderate) | 78 (Moderate) | 104 (Moderate) | 162 (Unhealthy) | 168 (Unhealthy) | 167 (Unhealthy) | 151 (Unhealthy) | 136 (Unhealthy for Sensitive Groups) | 146 (Unhealthy for Sensitive Groups) | 122 (Unhealthy for Sensitive Groups) | 114 (Moderate) | 67 (Good) | 58 (Good) | 74 (Moderate) | 104 (Moderate) |
| pm10 | 115 (Very Unhealthy) | 78 (Unhealthy for Sensitive Groups) | 105 (Unhealthy) | 124 (Very Unhealthy) | 148 (Very Unhealthy) | 98 (Unhealthy) | 98 (Unhealthy) | 77 (Unhealthy for Sensitive Groups) | 48 (Moderate) | 49 (Moderate) | 62 (Unhealthy for Sensitive Groups) | 49 (Moderate) | 121 (Very Unhealthy) | 123 (Very Unhealthy) | 104 (Unhealthy) | 113 (Very Unhealthy) | 134 (Very Unhealthy) | 123 (Very Unhealthy) | 131 (Very Unhealthy) | 80 (Unhealthy for Sensitive Groups) |
| so2 | 12 (Good) | 21 (Good) | 19 (Good) | 27 (Good) | 20 (Good) | 21 (Good) | 20 (Good) | 13 (Good) | 12 (Good) | 13 (Good) | 11 (Good) | 12 (Good) | 14 (Good) | 20 (Good) | 21 (Good) | 30 (Good) | 48 (Good) | 44 (Good) | 31 (Good) | 24 (Good) |
PM10 179 (Very bad Hazardous)
particulate matter (PM10) suspended dustPM2,5 35 (Unhealthy for Sensitive Groups)
particulate matter (PM2.5) dustO3 0.04 (Good)
ozone (O3)NO2 0 (Good)
nitrogen dioxide (NO2)SO2 0 (Good)
sulfur dioxide (SO2)沙湖旅游区
| index | 2022-05-27 |
|---|---|
| pm10 | 56 |
| pm25 | 56 |
| o3 | 0.03 |
| no2 | 0 |
| so2 | 0 |
沙湖旅游区
| index | 2020-05 | 2020-04 | 2020-03 | 2020-02 | 2020-01 | 2019-12 | 2019-11 | 2019-10 | 2019-09 | 2019-08 | 2019-07 | 2019-06 | 2019-05 | 2019-04 | 2019-03 | 2019-02 | 2019-01 | 2018-12 | 2018-11 | 2018-10 |
|---|---|---|---|---|---|---|---|---|---|---|---|---|---|---|---|---|---|---|---|---|
| pm25 | 36 | 26 | 32 | 54 | 112 | 55 | 46 | 35 | 21 | 18 | 21 | 23 | 38 | 39 | 40 | 49 | 71 | 51 | 56 | 38 |
| co | 372 | 492 | 783 | 1 | 1 | 1 | 1 | 863 | 674 | 724 | 695 | 653 | 654 | 974 | 1 | 1 | 2 | 1 | 1 | 910 |
| no2 | 25 | 35 | 36 | 31 | 41 | 44 | 37 | 31 | 24 | 19 | 23 | 24 | 22 | 24 | 32 | 34 | 43 | 38 | 44 | 32 |
| o3 | 138 | 136 | 110 | 113 | 77 | 72 | 78 | 104 | 162 | 168 | 167 | 151 | 136 | 146 | 122 | 114 | 67 | 58 | 74 | 104 |
| pm10 | 115 | 78 | 105 | 124 | 148 | 98 | 98 | 77 | 48 | 49 | 62 | 49 | 121 | 123 | 104 | 113 | 134 | 123 | 131 | 80 |
| so2 | 12 | 21 | 19 | 27 | 20 | 21 | 20 | 13 | 12 | 13 | 11 | 12 | 14 | 20 | 21 | 30 | 48 | 44 | 31 | 24 |