Air Pollution in Yingbeicun: Real-time Air Quality Index and smog alert.
Pollution and air quality forecast for Yingbeicun. Today is Tuesday, June 16, 2026. The following air pollution values have been recorded for Yingbeicun:- particulate matter (PM10) suspended dust - 179 (Very bad Hazardous)
- particulate matter (PM2.5) dust - 35 (Unhealthy for Sensitive Groups)
- ozone (O3) - 0 (Good)
- nitrogen dioxide (NO2) - 0 (Good)
- sulfur dioxide (SO2) - 0 (Good)

What is the air quality in Yingbeicun today? Is the air polluted in Yingbeicun?. Is there smog?
What is the level of PM10 today in Yingbeicun? (particulate matter (PM10) suspended dust)
The current level of particulate matter PM10 in Yingbeicun is:
179 (Very bad Hazardous)
The highest PM10 values usually occur in month: 142 (November 2018).
The lowest value of particulate matter PM10 pollution in Yingbeicun is usually recorded in: August (49).
What is the current level of PM2.5 in Yingbeicun? (particulate matter (PM2.5) dust)
Today's PM2.5 level is:
35 (Unhealthy for Sensitive Groups)
For comparison, the highest level of PM2.5 in Yingbeicun in the last 7 days was: 56 (Friday, May 27, 2022) and the lowest: 56 (Friday, May 27, 2022).
The highest PM2.5 values were recorded: 93 (January 2020).
The lowest level of particulate matter PM2.5 pollution occurs in month: August (15).
How is the O3 level today in Yingbeicun? (ozone (O3))
0 (Good)
How high is the level of NO2? (nitrogen dioxide (NO2))
0 (Good)
What is the level of SO2 pollution? (sulfur dioxide (SO2))
0 (Good)
Current data Friday, May 27, 2022, 12:00 PM
PM10 179 (Very bad Hazardous)
PM2,5 35 (Unhealthy for Sensitive Groups)
O3 0 (Good)
NO2 0 (Good)
SO2 0 (Good)
Data on air pollution from recent days in Yingbeicun
index
2022-05-27
pm10
56
Unhealthy for Sensitive Groups
pm25
56
Unhealthy
o3
0
Good
no2
0
Good
so2
0
Good
data source »
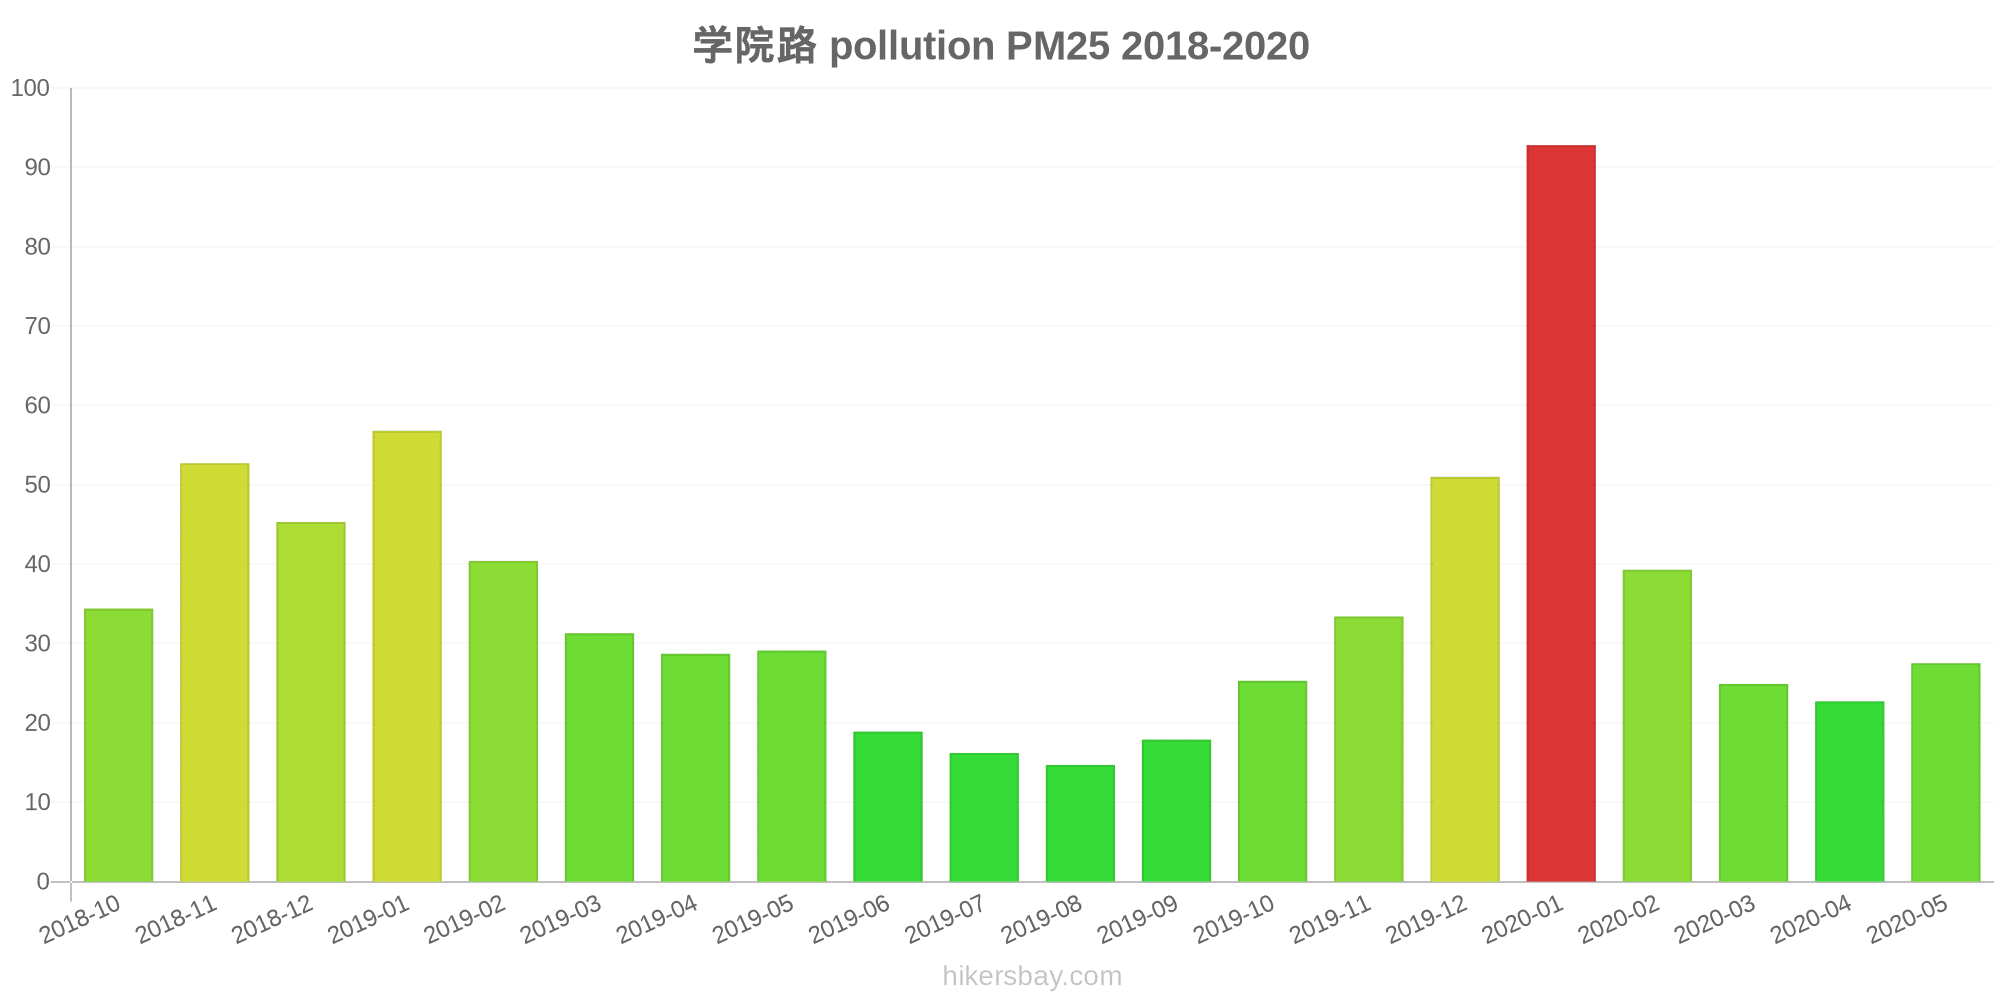
Air pollution in Yingbeicun from October 2018 to May 2020

index
2020-05
2020-04
2020-03
2020-02
2020-01
2019-12
2019-11
2019-10
2019-09
2019-08
2019-07
2019-06
2019-05
2019-04
2019-03
2019-02
2019-01
2018-12
2018-11
2018-10
pm25
28 (Moderate)
23 (Moderate)
25 (Moderate)
39 (Unhealthy for Sensitive Groups)
93 (Very Unhealthy)
51 (Unhealthy for Sensitive Groups)
33 (Moderate)
25 (Moderate)
18 (Moderate)
15 (Moderate)
16 (Moderate)
19 (Moderate)
29 (Moderate)
29 (Moderate)
31 (Moderate)
40 (Unhealthy for Sensitive Groups)
57 (Unhealthy)
45 (Unhealthy for Sensitive Groups)
53 (Unhealthy for Sensitive Groups)
34 (Moderate)
co
516 (Good)
637 (Good)
687 (Good)
1 (Good)
1 (Good)
1 (Good)
1 (Good)
782 (Good)
519 (Good)
723 (Good)
657 (Good)
565 (Good)
450 (Good)
766 (Good)
969 (Good)
1 (Good)
1 (Good)
1 (Good)
1 (Good)
1 (Good)
no2
27 (Good)
32 (Good)
27 (Good)
31 (Good)
52 (Moderate)
53 (Moderate)
47 (Moderate)
41 (Moderate)
39 (Good)
29 (Good)
27 (Good)
27 (Good)
30 (Good)
35 (Good)
46 (Moderate)
42 (Moderate)
61 (Moderate)
47 (Moderate)
58 (Moderate)
40 (Good)
o3
129 (Unhealthy for Sensitive Groups)
126 (Unhealthy for Sensitive Groups)
111 (Moderate)
100 (Moderate)
71 (Moderate)
70 (Moderate)
75 (Moderate)
98 (Moderate)
145 (Unhealthy for Sensitive Groups)
166 (Unhealthy)
146 (Unhealthy for Sensitive Groups)
154 (Unhealthy)
143 (Unhealthy for Sensitive Groups)
143 (Unhealthy for Sensitive Groups)
112 (Moderate)
99 (Moderate)
65 (Good)
60 (Good)
76 (Moderate)
94 (Moderate)
pm10
109 (Unhealthy)
80 (Unhealthy)
92 (Unhealthy)
98 (Unhealthy)
138 (Very Unhealthy)
96 (Unhealthy)
92 (Unhealthy)
67 (Unhealthy for Sensitive Groups)
51 (Unhealthy for Sensitive Groups)
49 (Moderate)
54 (Unhealthy for Sensitive Groups)
51 (Unhealthy for Sensitive Groups)
107 (Unhealthy)
93 (Unhealthy)
89 (Unhealthy)
93 (Unhealthy)
110 (Very Unhealthy)
122 (Very Unhealthy)
142 (Very Unhealthy)
81 (Unhealthy)
so2
13 (Good)
13 (Good)
15 (Good)
24 (Good)
23 (Good)
21 (Good)
18 (Good)
12 (Good)
8.5 (Good)
9.7 (Good)
8.6 (Good)
8.1 (Good)
8.8 (Good)
11 (Good)
16 (Good)
24 (Good)
38 (Good)
35 (Good)
29 (Good)
14 (Good)
data source »
学院路
Friday, May 27, 2022, 12:00 PM
PM10 179 (Very bad Hazardous)
particulate matter (PM10) suspended dust
PM2,5 35 (Unhealthy for Sensitive Groups)
particulate matter (PM2.5) dust
O3 0.04 (Good)
ozone (O3)
NO2 0 (Good)
nitrogen dioxide (NO2)
SO2 0 (Good)
sulfur dioxide (SO2)
学院路
index
2022-05-27
pm10
56
pm25
56
o3
0.03
no2
0
so2
0
学院路
2018-10 2020-05

index
2020-05
2020-04
2020-03
2020-02
2020-01
2019-12
2019-11
2019-10
2019-09
2019-08
2019-07
2019-06
2019-05
2019-04
2019-03
2019-02
2019-01
2018-12
2018-11
2018-10
pm25
28
23
25
39
93
51
33
25
18
15
16
19
29
29
31
40
57
45
53
34
co
516
637
687
1
1
1
1
782
519
723
657
565
450
766
969
1
1
1
1
1
no2
27
32
27
31
52
53
47
41
39
29
27
27
30
35
46
42
61
47
58
40
o3
129
126
111
100
71
70
75
98
145
166
146
154
143
143
112
99
65
60
76
94
pm10
109
80
92
98
138
96
92
67
51
49
54
51
107
93
89
93
110
122
142
81
so2
13
13
15
24
23
21
18
12
8.5
9.7
8.6
8.1
8.8
11
16
24
38
35
29
14
* Pollution data source:
https://openaq.org
(ChinaAQIData)
The data is licensed under CC-By 4.0
PM10 179 (Very bad Hazardous)
PM2,5 35 (Unhealthy for Sensitive Groups)
O3 0 (Good)
NO2 0 (Good)
SO2 0 (Good)
Data on air pollution from recent days in Yingbeicun
| index | 2022-05-27 |
|---|---|
| pm10 | 56 Unhealthy for Sensitive Groups |
| pm25 | 56 Unhealthy |
| o3 | 0 Good |
| no2 | 0 Good |
| so2 | 0 Good |

| index | 2020-05 | 2020-04 | 2020-03 | 2020-02 | 2020-01 | 2019-12 | 2019-11 | 2019-10 | 2019-09 | 2019-08 | 2019-07 | 2019-06 | 2019-05 | 2019-04 | 2019-03 | 2019-02 | 2019-01 | 2018-12 | 2018-11 | 2018-10 |
|---|---|---|---|---|---|---|---|---|---|---|---|---|---|---|---|---|---|---|---|---|
| pm25 | 28 (Moderate) | 23 (Moderate) | 25 (Moderate) | 39 (Unhealthy for Sensitive Groups) | 93 (Very Unhealthy) | 51 (Unhealthy for Sensitive Groups) | 33 (Moderate) | 25 (Moderate) | 18 (Moderate) | 15 (Moderate) | 16 (Moderate) | 19 (Moderate) | 29 (Moderate) | 29 (Moderate) | 31 (Moderate) | 40 (Unhealthy for Sensitive Groups) | 57 (Unhealthy) | 45 (Unhealthy for Sensitive Groups) | 53 (Unhealthy for Sensitive Groups) | 34 (Moderate) |
| co | 516 (Good) | 637 (Good) | 687 (Good) | 1 (Good) | 1 (Good) | 1 (Good) | 1 (Good) | 782 (Good) | 519 (Good) | 723 (Good) | 657 (Good) | 565 (Good) | 450 (Good) | 766 (Good) | 969 (Good) | 1 (Good) | 1 (Good) | 1 (Good) | 1 (Good) | 1 (Good) |
| no2 | 27 (Good) | 32 (Good) | 27 (Good) | 31 (Good) | 52 (Moderate) | 53 (Moderate) | 47 (Moderate) | 41 (Moderate) | 39 (Good) | 29 (Good) | 27 (Good) | 27 (Good) | 30 (Good) | 35 (Good) | 46 (Moderate) | 42 (Moderate) | 61 (Moderate) | 47 (Moderate) | 58 (Moderate) | 40 (Good) |
| o3 | 129 (Unhealthy for Sensitive Groups) | 126 (Unhealthy for Sensitive Groups) | 111 (Moderate) | 100 (Moderate) | 71 (Moderate) | 70 (Moderate) | 75 (Moderate) | 98 (Moderate) | 145 (Unhealthy for Sensitive Groups) | 166 (Unhealthy) | 146 (Unhealthy for Sensitive Groups) | 154 (Unhealthy) | 143 (Unhealthy for Sensitive Groups) | 143 (Unhealthy for Sensitive Groups) | 112 (Moderate) | 99 (Moderate) | 65 (Good) | 60 (Good) | 76 (Moderate) | 94 (Moderate) |
| pm10 | 109 (Unhealthy) | 80 (Unhealthy) | 92 (Unhealthy) | 98 (Unhealthy) | 138 (Very Unhealthy) | 96 (Unhealthy) | 92 (Unhealthy) | 67 (Unhealthy for Sensitive Groups) | 51 (Unhealthy for Sensitive Groups) | 49 (Moderate) | 54 (Unhealthy for Sensitive Groups) | 51 (Unhealthy for Sensitive Groups) | 107 (Unhealthy) | 93 (Unhealthy) | 89 (Unhealthy) | 93 (Unhealthy) | 110 (Very Unhealthy) | 122 (Very Unhealthy) | 142 (Very Unhealthy) | 81 (Unhealthy) |
| so2 | 13 (Good) | 13 (Good) | 15 (Good) | 24 (Good) | 23 (Good) | 21 (Good) | 18 (Good) | 12 (Good) | 8.5 (Good) | 9.7 (Good) | 8.6 (Good) | 8.1 (Good) | 8.8 (Good) | 11 (Good) | 16 (Good) | 24 (Good) | 38 (Good) | 35 (Good) | 29 (Good) | 14 (Good) |
PM10 179 (Very bad Hazardous)
particulate matter (PM10) suspended dustPM2,5 35 (Unhealthy for Sensitive Groups)
particulate matter (PM2.5) dustO3 0.04 (Good)
ozone (O3)NO2 0 (Good)
nitrogen dioxide (NO2)SO2 0 (Good)
sulfur dioxide (SO2)学院路
| index | 2022-05-27 |
|---|---|
| pm10 | 56 |
| pm25 | 56 |
| o3 | 0.03 |
| no2 | 0 |
| so2 | 0 |
学院路
| index | 2020-05 | 2020-04 | 2020-03 | 2020-02 | 2020-01 | 2019-12 | 2019-11 | 2019-10 | 2019-09 | 2019-08 | 2019-07 | 2019-06 | 2019-05 | 2019-04 | 2019-03 | 2019-02 | 2019-01 | 2018-12 | 2018-11 | 2018-10 |
|---|---|---|---|---|---|---|---|---|---|---|---|---|---|---|---|---|---|---|---|---|
| pm25 | 28 | 23 | 25 | 39 | 93 | 51 | 33 | 25 | 18 | 15 | 16 | 19 | 29 | 29 | 31 | 40 | 57 | 45 | 53 | 34 |
| co | 516 | 637 | 687 | 1 | 1 | 1 | 1 | 782 | 519 | 723 | 657 | 565 | 450 | 766 | 969 | 1 | 1 | 1 | 1 | 1 |
| no2 | 27 | 32 | 27 | 31 | 52 | 53 | 47 | 41 | 39 | 29 | 27 | 27 | 30 | 35 | 46 | 42 | 61 | 47 | 58 | 40 |
| o3 | 129 | 126 | 111 | 100 | 71 | 70 | 75 | 98 | 145 | 166 | 146 | 154 | 143 | 143 | 112 | 99 | 65 | 60 | 76 | 94 |
| pm10 | 109 | 80 | 92 | 98 | 138 | 96 | 92 | 67 | 51 | 49 | 54 | 51 | 107 | 93 | 89 | 93 | 110 | 122 | 142 | 81 |
| so2 | 13 | 13 | 15 | 24 | 23 | 21 | 18 | 12 | 8.5 | 9.7 | 8.6 | 8.1 | 8.8 | 11 | 16 | 24 | 38 | 35 | 29 | 14 |