Air Pollution in Wulitai: Real-time Air Quality Index and smog alert.
Pollution and air quality forecast for Wulitai. Today is Tuesday, June 16, 2026. The following air pollution values have been recorded for Wulitai:- particulate matter (PM10) suspended dust - 179 (Very bad Hazardous)
- particulate matter (PM2.5) dust - 35 (Unhealthy for Sensitive Groups)
- ozone (O3) - 0 (Good)
- nitrogen dioxide (NO2) - 0 (Good)
- sulfur dioxide (SO2) - 0 (Good)

What is the air quality in Wulitai today? Is the air polluted in Wulitai?. Is there smog?
What is the level of PM10 today in Wulitai? (particulate matter (PM10) suspended dust)
The current level of particulate matter PM10 in Wulitai is:
179 (Very bad Hazardous)
The highest PM10 values usually occur in month: 146 (January 2020).
The lowest value of particulate matter PM10 pollution in Wulitai is usually recorded in: August (42).
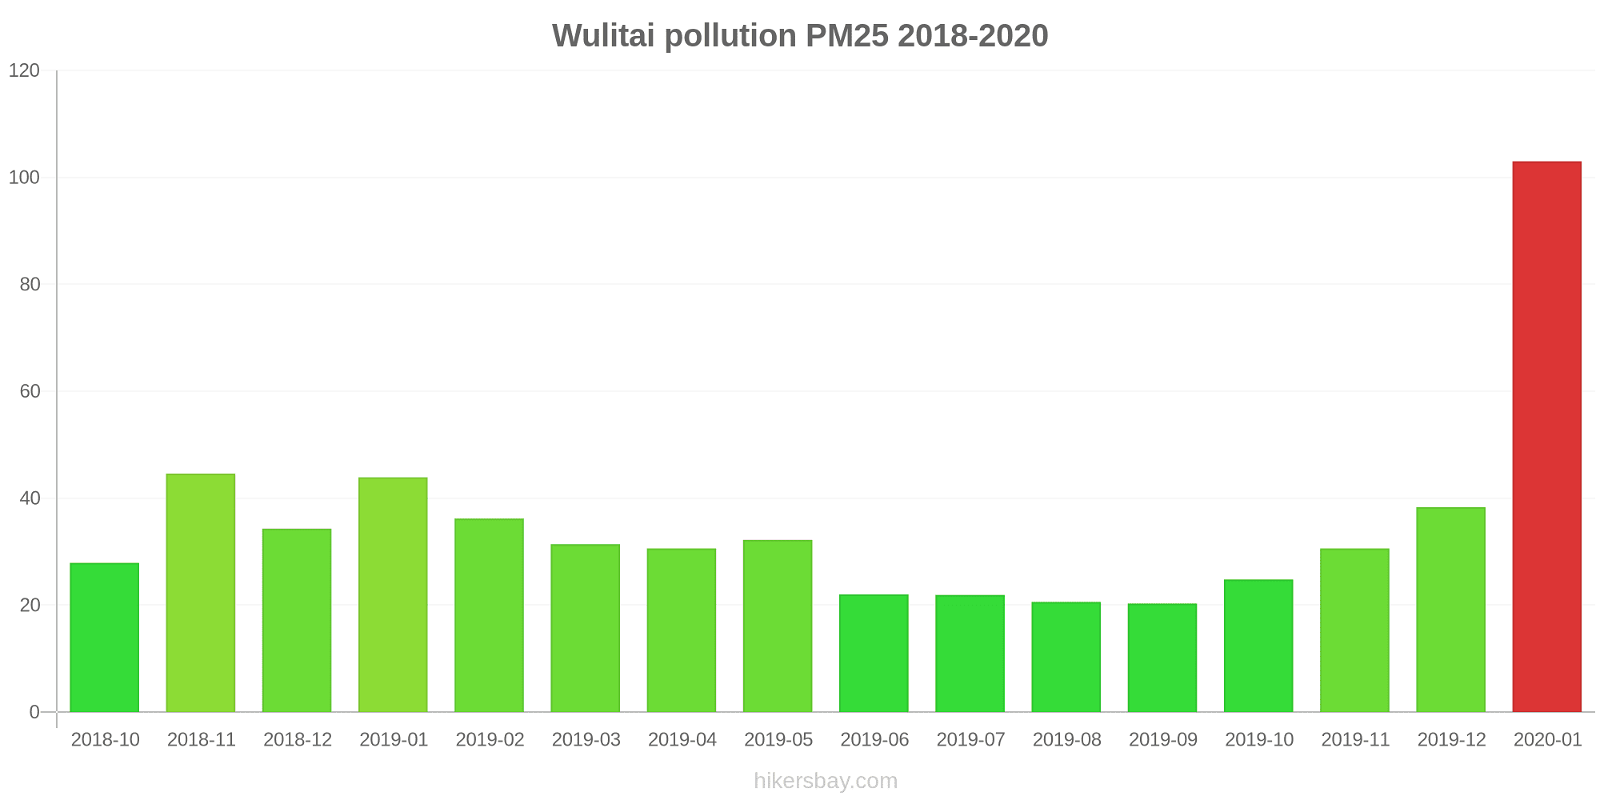
What is the current level of PM2.5 in Wulitai? (particulate matter (PM2.5) dust)
Today's PM2.5 level is:
35 (Unhealthy for Sensitive Groups)
For comparison, the highest level of PM2.5 in Wulitai in the last 7 days was: 56 (Friday, May 27, 2022) and the lowest: 56 (Friday, May 27, 2022).
The highest PM2.5 values were recorded: 103 (January 2020).
The lowest level of particulate matter PM2.5 pollution occurs in month: September (20).
How is the O3 level today in Wulitai? (ozone (O3))
0 (Good)
How high is the level of NO2? (nitrogen dioxide (NO2))
0 (Good)
What is the level of SO2 pollution? (sulfur dioxide (SO2))
0 (Good)
Current data Friday, May 27, 2022, 12:00 PM
PM10 179 (Very bad Hazardous)
PM2,5 35 (Unhealthy for Sensitive Groups)
O3 0 (Good)
NO2 0 (Good)
SO2 0 (Good)
Data on air pollution from recent days in Wulitai
index
2022-05-27
pm10
56
Unhealthy for Sensitive Groups
pm25
56
Unhealthy
o3
0
Good
no2
0
Good
so2
0
Good
data source »
Air pollution in Wulitai from October 2018 to January 2020
index
2020-01
2019-12
2019-11
2019-10
2019-09
2019-08
2019-07
2019-06
2019-05
2019-04
2019-03
2019-02
2019-01
2018-12
2018-11
2018-10
pm25
103 (Very Unhealthy)
38 (Unhealthy for Sensitive Groups)
31 (Moderate)
25 (Moderate)
20 (Moderate)
21 (Moderate)
22 (Moderate)
22 (Moderate)
32 (Moderate)
31 (Moderate)
31 (Moderate)
36 (Unhealthy for Sensitive Groups)
44 (Unhealthy for Sensitive Groups)
34 (Moderate)
45 (Unhealthy for Sensitive Groups)
28 (Moderate)
co
2 (Good)
1 (Good)
826 (Good)
621 (Good)
528 (Good)
488 (Good)
496 (Good)
710 (Good)
583 (Good)
695 (Good)
892 (Good)
1 (Good)
1 (Good)
1 (Good)
1 (Good)
909 (Good)
no2
59 (Moderate)
53 (Moderate)
48 (Moderate)
41 (Moderate)
33 (Good)
24 (Good)
25 (Good)
23 (Good)
25 (Good)
30 (Good)
38 (Good)
37 (Good)
50 (Moderate)
41 (Moderate)
53 (Moderate)
37 (Good)
o3
55 (Good)
68 (Good)
74 (Moderate)
92 (Moderate)
136 (Unhealthy for Sensitive Groups)
151 (Unhealthy)
154 (Unhealthy)
142 (Unhealthy for Sensitive Groups)
134 (Unhealthy for Sensitive Groups)
134 (Unhealthy for Sensitive Groups)
109 (Moderate)
90 (Moderate)
59 (Good)
56 (Good)
66 (Good)
88 (Moderate)
pm10
146 (Very Unhealthy)
80 (Unhealthy for Sensitive Groups)
78 (Unhealthy for Sensitive Groups)
61 (Unhealthy for Sensitive Groups)
45 (Moderate)
42 (Moderate)
49 (Moderate)
50 (Moderate)
115 (Very Unhealthy)
88 (Unhealthy)
78 (Unhealthy for Sensitive Groups)
94 (Unhealthy)
109 (Unhealthy)
107 (Unhealthy)
126 (Very Unhealthy)
77 (Unhealthy for Sensitive Groups)
so2
22 (Good)
20 (Good)
16 (Good)
9.5 (Good)
6 (Good)
7.5 (Good)
6.9 (Good)
7.4 (Good)
8.5 (Good)
11 (Good)
16 (Good)
21 (Good)
32 (Good)
25 (Good)
22 (Good)
14 (Good)
data source »
水乡路(直管站)
Friday, May 27, 2022, 12:00 PM
PM10 179 (Very bad Hazardous)
particulate matter (PM10) suspended dust
PM2,5 35 (Unhealthy for Sensitive Groups)
particulate matter (PM2.5) dust
O3 0.04 (Good)
ozone (O3)
NO2 0 (Good)
nitrogen dioxide (NO2)
SO2 0 (Good)
sulfur dioxide (SO2)
水乡路(直管站)
index
2022-05-27
pm10
56
pm25
56
o3
0.03
no2
0
so2
0
水乡路(直管站)
2018-10 2020-01

index
2020-01
2019-12
2019-11
2019-10
2019-09
2019-08
2019-07
2019-06
2019-05
2019-04
2019-03
2019-02
2019-01
2018-12
2018-11
2018-10
pm25
103
38
31
25
20
21
22
22
32
31
31
36
44
34
45
28
co
2
1
826
621
528
488
496
710
583
695
892
1
1
1
1
909
no2
59
53
48
41
33
24
25
23
25
30
38
37
50
41
53
37
o3
55
68
74
92
136
151
154
142
134
134
109
90
59
56
66
88
pm10
146
80
78
61
45
42
49
50
115
88
78
94
109
107
126
77
so2
22
20
16
9.5
6
7.5
6.9
7.4
8.5
11
16
21
32
25
22
14
* Pollution data source:
https://openaq.org
()
The data is licensed under CC-By 4.0
PM10 179 (Very bad Hazardous)
PM2,5 35 (Unhealthy for Sensitive Groups)
O3 0 (Good)
NO2 0 (Good)
SO2 0 (Good)
Data on air pollution from recent days in Wulitai
| index | 2022-05-27 |
|---|---|
| pm10 | 56 Unhealthy for Sensitive Groups |
| pm25 | 56 Unhealthy |
| o3 | 0 Good |
| no2 | 0 Good |
| so2 | 0 Good |

| index | 2020-01 | 2019-12 | 2019-11 | 2019-10 | 2019-09 | 2019-08 | 2019-07 | 2019-06 | 2019-05 | 2019-04 | 2019-03 | 2019-02 | 2019-01 | 2018-12 | 2018-11 | 2018-10 |
|---|---|---|---|---|---|---|---|---|---|---|---|---|---|---|---|---|
| pm25 | 103 (Very Unhealthy) | 38 (Unhealthy for Sensitive Groups) | 31 (Moderate) | 25 (Moderate) | 20 (Moderate) | 21 (Moderate) | 22 (Moderate) | 22 (Moderate) | 32 (Moderate) | 31 (Moderate) | 31 (Moderate) | 36 (Unhealthy for Sensitive Groups) | 44 (Unhealthy for Sensitive Groups) | 34 (Moderate) | 45 (Unhealthy for Sensitive Groups) | 28 (Moderate) |
| co | 2 (Good) | 1 (Good) | 826 (Good) | 621 (Good) | 528 (Good) | 488 (Good) | 496 (Good) | 710 (Good) | 583 (Good) | 695 (Good) | 892 (Good) | 1 (Good) | 1 (Good) | 1 (Good) | 1 (Good) | 909 (Good) |
| no2 | 59 (Moderate) | 53 (Moderate) | 48 (Moderate) | 41 (Moderate) | 33 (Good) | 24 (Good) | 25 (Good) | 23 (Good) | 25 (Good) | 30 (Good) | 38 (Good) | 37 (Good) | 50 (Moderate) | 41 (Moderate) | 53 (Moderate) | 37 (Good) |
| o3 | 55 (Good) | 68 (Good) | 74 (Moderate) | 92 (Moderate) | 136 (Unhealthy for Sensitive Groups) | 151 (Unhealthy) | 154 (Unhealthy) | 142 (Unhealthy for Sensitive Groups) | 134 (Unhealthy for Sensitive Groups) | 134 (Unhealthy for Sensitive Groups) | 109 (Moderate) | 90 (Moderate) | 59 (Good) | 56 (Good) | 66 (Good) | 88 (Moderate) |
| pm10 | 146 (Very Unhealthy) | 80 (Unhealthy for Sensitive Groups) | 78 (Unhealthy for Sensitive Groups) | 61 (Unhealthy for Sensitive Groups) | 45 (Moderate) | 42 (Moderate) | 49 (Moderate) | 50 (Moderate) | 115 (Very Unhealthy) | 88 (Unhealthy) | 78 (Unhealthy for Sensitive Groups) | 94 (Unhealthy) | 109 (Unhealthy) | 107 (Unhealthy) | 126 (Very Unhealthy) | 77 (Unhealthy for Sensitive Groups) |
| so2 | 22 (Good) | 20 (Good) | 16 (Good) | 9.5 (Good) | 6 (Good) | 7.5 (Good) | 6.9 (Good) | 7.4 (Good) | 8.5 (Good) | 11 (Good) | 16 (Good) | 21 (Good) | 32 (Good) | 25 (Good) | 22 (Good) | 14 (Good) |
PM10 179 (Very bad Hazardous)
particulate matter (PM10) suspended dustPM2,5 35 (Unhealthy for Sensitive Groups)
particulate matter (PM2.5) dustO3 0.04 (Good)
ozone (O3)NO2 0 (Good)
nitrogen dioxide (NO2)SO2 0 (Good)
sulfur dioxide (SO2)水乡路(直管站)
| index | 2022-05-27 |
|---|---|
| pm10 | 56 |
| pm25 | 56 |
| o3 | 0.03 |
| no2 | 0 |
| so2 | 0 |
水乡路(直管站)

| index | 2020-01 | 2019-12 | 2019-11 | 2019-10 | 2019-09 | 2019-08 | 2019-07 | 2019-06 | 2019-05 | 2019-04 | 2019-03 | 2019-02 | 2019-01 | 2018-12 | 2018-11 | 2018-10 |
|---|---|---|---|---|---|---|---|---|---|---|---|---|---|---|---|---|
| pm25 | 103 | 38 | 31 | 25 | 20 | 21 | 22 | 22 | 32 | 31 | 31 | 36 | 44 | 34 | 45 | 28 |
| co | 2 | 1 | 826 | 621 | 528 | 488 | 496 | 710 | 583 | 695 | 892 | 1 | 1 | 1 | 1 | 909 |
| no2 | 59 | 53 | 48 | 41 | 33 | 24 | 25 | 23 | 25 | 30 | 38 | 37 | 50 | 41 | 53 | 37 |
| o3 | 55 | 68 | 74 | 92 | 136 | 151 | 154 | 142 | 134 | 134 | 109 | 90 | 59 | 56 | 66 | 88 |
| pm10 | 146 | 80 | 78 | 61 | 45 | 42 | 49 | 50 | 115 | 88 | 78 | 94 | 109 | 107 | 126 | 77 |
| so2 | 22 | 20 | 16 | 9.5 | 6 | 7.5 | 6.9 | 7.4 | 8.5 | 11 | 16 | 21 | 32 | 25 | 22 | 14 |