Air Pollution in Diyao Ziba: Real-time Air Quality Index and smog alert.
Pollution and air quality forecast for Diyao Ziba. Today is Tuesday, June 16, 2026. The following air pollution values have been recorded for Diyao Ziba:- particulate matter (PM10) suspended dust - 179 (Very bad Hazardous)
- particulate matter (PM2.5) dust - 35 (Unhealthy for Sensitive Groups)
- ozone (O3) - 0 (Good)
- nitrogen dioxide (NO2) - 0 (Good)
- sulfur dioxide (SO2) - 0 (Good)

What is the air quality in Diyao Ziba today? Is the air polluted in Diyao Ziba?. Is there smog?
What is the level of PM10 today in Diyao Ziba? (particulate matter (PM10) suspended dust)
The current level of particulate matter PM10 in Diyao Ziba is:
179 (Very bad Hazardous)
The highest PM10 values usually occur in month: 152 (November 2018).
The lowest value of particulate matter PM10 pollution in Diyao Ziba is usually recorded in: August (47).
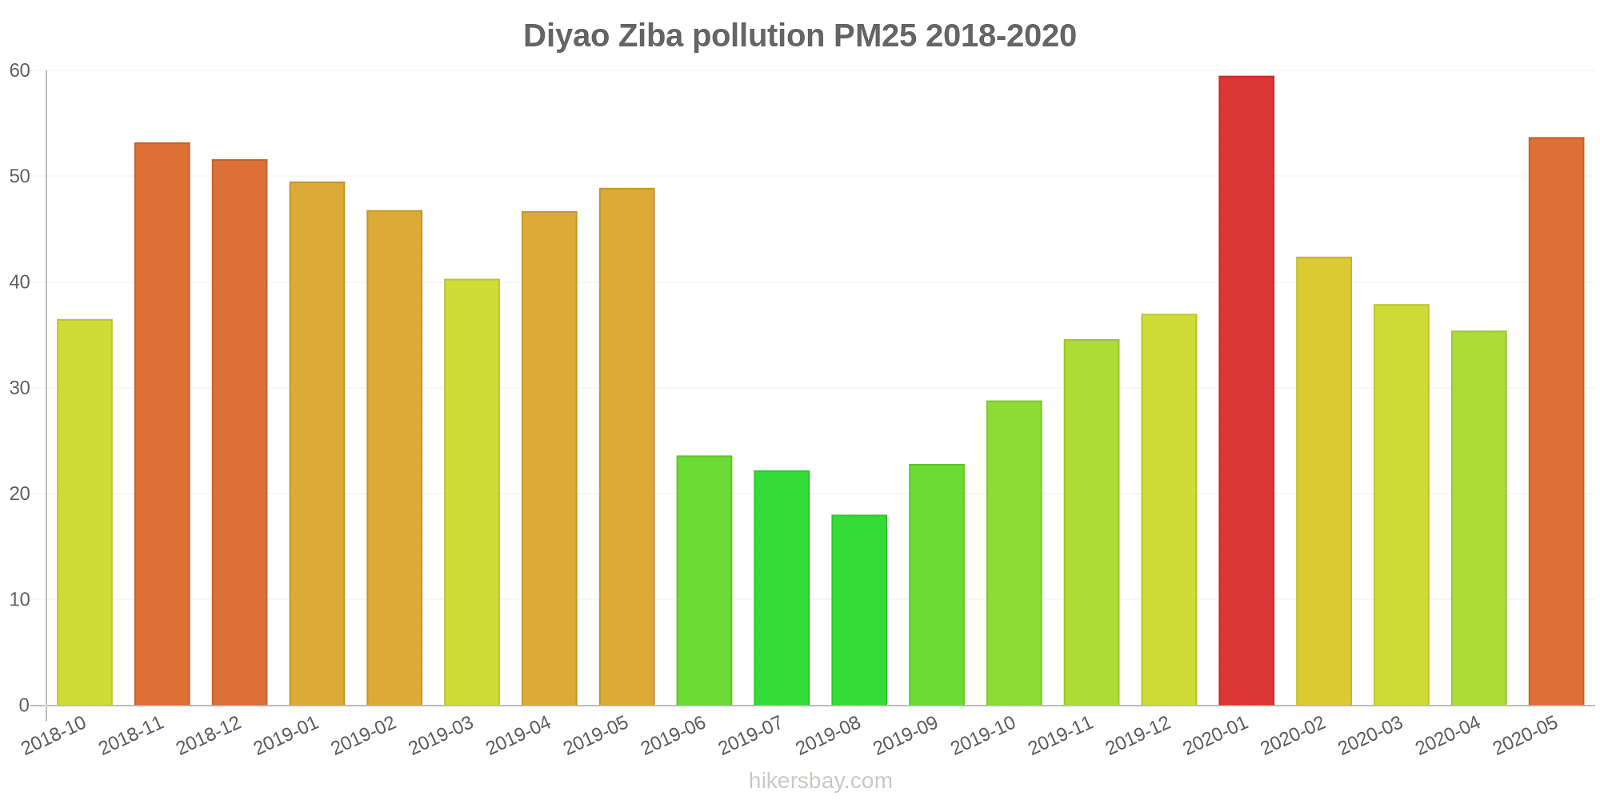
What is the current level of PM2.5 in Diyao Ziba? (particulate matter (PM2.5) dust)
Today's PM2.5 level is:
35 (Unhealthy for Sensitive Groups)
For comparison, the highest level of PM2.5 in Diyao Ziba in the last 7 days was: 56 (Friday, May 27, 2022) and the lowest: 56 (Friday, May 27, 2022).
The highest PM2.5 values were recorded: 60 (January 2020).
The lowest level of particulate matter PM2.5 pollution occurs in month: August (18).
How is the O3 level today in Diyao Ziba? (ozone (O3))
0 (Good)
How high is the level of NO2? (nitrogen dioxide (NO2))
0 (Good)
What is the level of SO2 pollution? (sulfur dioxide (SO2))
0 (Good)
Current data Friday, May 27, 2022, 12:00 PM
PM10 179 (Very bad Hazardous)
PM2,5 35 (Unhealthy for Sensitive Groups)
O3 0 (Good)
NO2 0 (Good)
SO2 0 (Good)
Data on air pollution from recent days in Diyao Ziba
index
2022-05-27
pm10
56
Unhealthy for Sensitive Groups
pm25
56
Unhealthy
o3
0
Good
no2
0
Good
so2
0
Good
data source »
Air pollution in Diyao Ziba from October 2018 to May 2020
index
2020-05
2020-04
2020-03
2020-02
2020-01
2019-12
2019-11
2019-10
2019-09
2019-08
2019-07
2019-06
2019-05
2019-04
2019-03
2019-02
2019-01
2018-12
2018-11
2018-10
pm25
54 (Unhealthy for Sensitive Groups)
35 (Unhealthy for Sensitive Groups)
38 (Unhealthy for Sensitive Groups)
42 (Unhealthy for Sensitive Groups)
60 (Unhealthy)
37 (Unhealthy for Sensitive Groups)
35 (Moderate)
29 (Moderate)
23 (Moderate)
18 (Moderate)
22 (Moderate)
24 (Moderate)
49 (Unhealthy for Sensitive Groups)
47 (Unhealthy for Sensitive Groups)
40 (Unhealthy for Sensitive Groups)
47 (Unhealthy for Sensitive Groups)
50 (Unhealthy for Sensitive Groups)
52 (Unhealthy for Sensitive Groups)
53 (Unhealthy for Sensitive Groups)
37 (Unhealthy for Sensitive Groups)
co
417 (Good)
509 (Good)
555 (Good)
793 (Good)
1 (Good)
892 (Good)
718 (Good)
731 (Good)
694 (Good)
720 (Good)
634 (Good)
636 (Good)
609 (Good)
491 (Good)
744 (Good)
854 (Good)
1 (Good)
924 (Good)
738 (Good)
736 (Good)
no2
19 (Good)
24 (Good)
21 (Good)
23 (Good)
32 (Good)
38 (Good)
34 (Good)
30 (Good)
25 (Good)
23 (Good)
22 (Good)
21 (Good)
17 (Good)
22 (Good)
30 (Good)
25 (Good)
30 (Good)
31 (Good)
33 (Good)
25 (Good)
o3
131 (Unhealthy for Sensitive Groups)
127 (Unhealthy for Sensitive Groups)
108 (Moderate)
99 (Moderate)
89 (Moderate)
77 (Moderate)
88 (Moderate)
91 (Moderate)
124 (Unhealthy for Sensitive Groups)
142 (Unhealthy for Sensitive Groups)
151 (Unhealthy)
144 (Unhealthy for Sensitive Groups)
137 (Unhealthy for Sensitive Groups)
140 (Unhealthy for Sensitive Groups)
118 (Moderate)
100 (Moderate)
82 (Moderate)
70 (Moderate)
83 (Moderate)
94 (Moderate)
pm10
146 (Very Unhealthy)
93 (Unhealthy)
122 (Very Unhealthy)
110 (Very Unhealthy)
81 (Unhealthy)
74 (Unhealthy for Sensitive Groups)
79 (Unhealthy for Sensitive Groups)
76 (Unhealthy for Sensitive Groups)
55 (Unhealthy for Sensitive Groups)
47 (Moderate)
65 (Unhealthy for Sensitive Groups)
56 (Unhealthy for Sensitive Groups)
147 (Very Unhealthy)
151 (Very bad Hazardous)
102 (Unhealthy)
119 (Very Unhealthy)
86 (Unhealthy)
131 (Very Unhealthy)
152 (Very bad Hazardous)
80 (Unhealthy)
so2
10 (Good)
14 (Good)
13 (Good)
14 (Good)
16 (Good)
25 (Good)
18 (Good)
14 (Good)
12 (Good)
15 (Good)
11 (Good)
11 (Good)
11 (Good)
13 (Good)
20 (Good)
19 (Good)
21 (Good)
21 (Good)
18 (Good)
16 (Good)
data source »
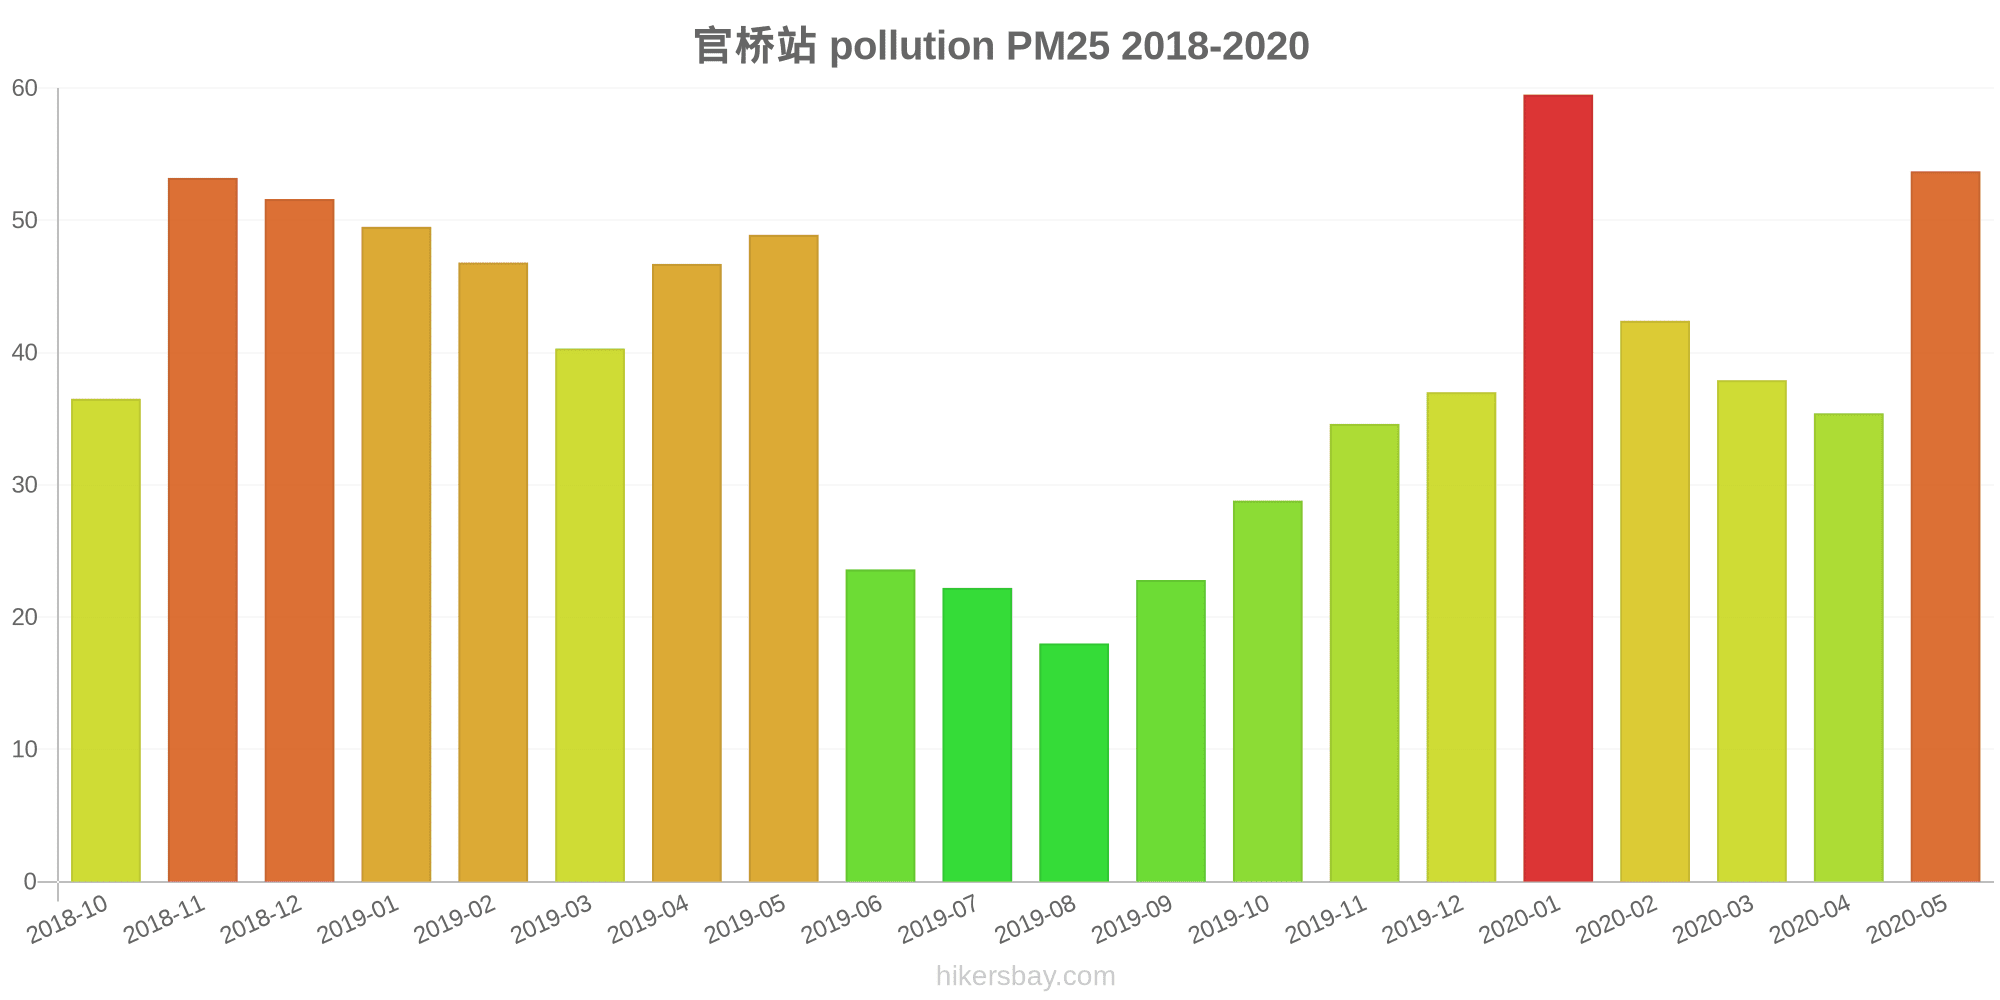
官桥站
Friday, May 27, 2022, 12:00 PM
PM10 179 (Very bad Hazardous)
particulate matter (PM10) suspended dust
PM2,5 35 (Unhealthy for Sensitive Groups)
particulate matter (PM2.5) dust
O3 0.04 (Good)
ozone (O3)
NO2 0 (Good)
nitrogen dioxide (NO2)
SO2 0 (Good)
sulfur dioxide (SO2)
官桥站
index
2022-05-27
pm10
56
pm25
56
o3
0.03
no2
0
so2
0
官桥站
2018-10 2020-05

index
2020-05
2020-04
2020-03
2020-02
2020-01
2019-12
2019-11
2019-10
2019-09
2019-08
2019-07
2019-06
2019-05
2019-04
2019-03
2019-02
2019-01
2018-12
2018-11
2018-10
pm25
54
35
38
42
60
37
35
29
23
18
22
24
49
47
40
47
50
52
53
37
co
417
509
555
793
1
892
718
731
694
720
634
636
609
491
744
854
1
924
738
736
no2
19
24
21
23
32
38
34
30
25
23
22
21
17
22
30
25
30
31
33
25
o3
131
127
108
99
89
77
88
91
124
142
151
144
137
140
118
100
82
70
83
94
pm10
146
93
122
110
81
74
79
76
55
47
65
56
147
151
102
119
86
131
152
80
so2
10
14
13
14
16
25
18
14
12
15
11
11
11
13
20
19
21
21
18
16
* Pollution data source:
https://openaq.org
(ChinaAQIData)
The data is licensed under CC-By 4.0
PM10 179 (Very bad Hazardous)
PM2,5 35 (Unhealthy for Sensitive Groups)
O3 0 (Good)
NO2 0 (Good)
SO2 0 (Good)
Data on air pollution from recent days in Diyao Ziba
| index | 2022-05-27 |
|---|---|
| pm10 | 56 Unhealthy for Sensitive Groups |
| pm25 | 56 Unhealthy |
| o3 | 0 Good |
| no2 | 0 Good |
| so2 | 0 Good |

| index | 2020-05 | 2020-04 | 2020-03 | 2020-02 | 2020-01 | 2019-12 | 2019-11 | 2019-10 | 2019-09 | 2019-08 | 2019-07 | 2019-06 | 2019-05 | 2019-04 | 2019-03 | 2019-02 | 2019-01 | 2018-12 | 2018-11 | 2018-10 |
|---|---|---|---|---|---|---|---|---|---|---|---|---|---|---|---|---|---|---|---|---|
| pm25 | 54 (Unhealthy for Sensitive Groups) | 35 (Unhealthy for Sensitive Groups) | 38 (Unhealthy for Sensitive Groups) | 42 (Unhealthy for Sensitive Groups) | 60 (Unhealthy) | 37 (Unhealthy for Sensitive Groups) | 35 (Moderate) | 29 (Moderate) | 23 (Moderate) | 18 (Moderate) | 22 (Moderate) | 24 (Moderate) | 49 (Unhealthy for Sensitive Groups) | 47 (Unhealthy for Sensitive Groups) | 40 (Unhealthy for Sensitive Groups) | 47 (Unhealthy for Sensitive Groups) | 50 (Unhealthy for Sensitive Groups) | 52 (Unhealthy for Sensitive Groups) | 53 (Unhealthy for Sensitive Groups) | 37 (Unhealthy for Sensitive Groups) |
| co | 417 (Good) | 509 (Good) | 555 (Good) | 793 (Good) | 1 (Good) | 892 (Good) | 718 (Good) | 731 (Good) | 694 (Good) | 720 (Good) | 634 (Good) | 636 (Good) | 609 (Good) | 491 (Good) | 744 (Good) | 854 (Good) | 1 (Good) | 924 (Good) | 738 (Good) | 736 (Good) |
| no2 | 19 (Good) | 24 (Good) | 21 (Good) | 23 (Good) | 32 (Good) | 38 (Good) | 34 (Good) | 30 (Good) | 25 (Good) | 23 (Good) | 22 (Good) | 21 (Good) | 17 (Good) | 22 (Good) | 30 (Good) | 25 (Good) | 30 (Good) | 31 (Good) | 33 (Good) | 25 (Good) |
| o3 | 131 (Unhealthy for Sensitive Groups) | 127 (Unhealthy for Sensitive Groups) | 108 (Moderate) | 99 (Moderate) | 89 (Moderate) | 77 (Moderate) | 88 (Moderate) | 91 (Moderate) | 124 (Unhealthy for Sensitive Groups) | 142 (Unhealthy for Sensitive Groups) | 151 (Unhealthy) | 144 (Unhealthy for Sensitive Groups) | 137 (Unhealthy for Sensitive Groups) | 140 (Unhealthy for Sensitive Groups) | 118 (Moderate) | 100 (Moderate) | 82 (Moderate) | 70 (Moderate) | 83 (Moderate) | 94 (Moderate) |
| pm10 | 146 (Very Unhealthy) | 93 (Unhealthy) | 122 (Very Unhealthy) | 110 (Very Unhealthy) | 81 (Unhealthy) | 74 (Unhealthy for Sensitive Groups) | 79 (Unhealthy for Sensitive Groups) | 76 (Unhealthy for Sensitive Groups) | 55 (Unhealthy for Sensitive Groups) | 47 (Moderate) | 65 (Unhealthy for Sensitive Groups) | 56 (Unhealthy for Sensitive Groups) | 147 (Very Unhealthy) | 151 (Very bad Hazardous) | 102 (Unhealthy) | 119 (Very Unhealthy) | 86 (Unhealthy) | 131 (Very Unhealthy) | 152 (Very bad Hazardous) | 80 (Unhealthy) |
| so2 | 10 (Good) | 14 (Good) | 13 (Good) | 14 (Good) | 16 (Good) | 25 (Good) | 18 (Good) | 14 (Good) | 12 (Good) | 15 (Good) | 11 (Good) | 11 (Good) | 11 (Good) | 13 (Good) | 20 (Good) | 19 (Good) | 21 (Good) | 21 (Good) | 18 (Good) | 16 (Good) |
PM10 179 (Very bad Hazardous)
particulate matter (PM10) suspended dustPM2,5 35 (Unhealthy for Sensitive Groups)
particulate matter (PM2.5) dustO3 0.04 (Good)
ozone (O3)NO2 0 (Good)
nitrogen dioxide (NO2)SO2 0 (Good)
sulfur dioxide (SO2)官桥站
| index | 2022-05-27 |
|---|---|
| pm10 | 56 |
| pm25 | 56 |
| o3 | 0.03 |
| no2 | 0 |
| so2 | 0 |
官桥站
| index | 2020-05 | 2020-04 | 2020-03 | 2020-02 | 2020-01 | 2019-12 | 2019-11 | 2019-10 | 2019-09 | 2019-08 | 2019-07 | 2019-06 | 2019-05 | 2019-04 | 2019-03 | 2019-02 | 2019-01 | 2018-12 | 2018-11 | 2018-10 |
|---|---|---|---|---|---|---|---|---|---|---|---|---|---|---|---|---|---|---|---|---|
| pm25 | 54 | 35 | 38 | 42 | 60 | 37 | 35 | 29 | 23 | 18 | 22 | 24 | 49 | 47 | 40 | 47 | 50 | 52 | 53 | 37 |
| co | 417 | 509 | 555 | 793 | 1 | 892 | 718 | 731 | 694 | 720 | 634 | 636 | 609 | 491 | 744 | 854 | 1 | 924 | 738 | 736 |
| no2 | 19 | 24 | 21 | 23 | 32 | 38 | 34 | 30 | 25 | 23 | 22 | 21 | 17 | 22 | 30 | 25 | 30 | 31 | 33 | 25 |
| o3 | 131 | 127 | 108 | 99 | 89 | 77 | 88 | 91 | 124 | 142 | 151 | 144 | 137 | 140 | 118 | 100 | 82 | 70 | 83 | 94 |
| pm10 | 146 | 93 | 122 | 110 | 81 | 74 | 79 | 76 | 55 | 47 | 65 | 56 | 147 | 151 | 102 | 119 | 86 | 131 | 152 | 80 |
| so2 | 10 | 14 | 13 | 14 | 16 | 25 | 18 | 14 | 12 | 15 | 11 | 11 | 11 | 13 | 20 | 19 | 21 | 21 | 18 | 16 |