Air Pollution in Mingzhong: Real-time Air Quality Index and smog alert.
Pollution and air quality forecast for Mingzhong. Today is Tuesday, June 16, 2026. The following air pollution values have been recorded for Mingzhong:- particulate matter (PM10) suspended dust - 179 (Very bad Hazardous)
- particulate matter (PM2.5) dust - 35 (Unhealthy for Sensitive Groups)
- ozone (O3) - 0 (Good)
- nitrogen dioxide (NO2) - 0 (Good)
- sulfur dioxide (SO2) - 0 (Good)

What is the air quality in Mingzhong today? Is the air polluted in Mingzhong?. Is there smog?
What is the level of PM10 today in Mingzhong? (particulate matter (PM10) suspended dust)
The current level of particulate matter PM10 in Mingzhong is:
179 (Very bad Hazardous)
The highest PM10 values usually occur in month: 172 (May 2020).
The lowest value of particulate matter PM10 pollution in Mingzhong is usually recorded in: August (45).
What is the current level of PM2.5 in Mingzhong? (particulate matter (PM2.5) dust)
Today's PM2.5 level is:
35 (Unhealthy for Sensitive Groups)
For comparison, the highest level of PM2.5 in Mingzhong in the last 7 days was: 56 (Friday, May 27, 2022) and the lowest: 56 (Friday, May 27, 2022).
The highest PM2.5 values were recorded: 52 (January 2020).
The lowest level of particulate matter PM2.5 pollution occurs in month: August (17).
How is the O3 level today in Mingzhong? (ozone (O3))
0 (Good)
How high is the level of NO2? (nitrogen dioxide (NO2))
0 (Good)
What is the level of SO2 pollution? (sulfur dioxide (SO2))
0 (Good)
Current data Friday, May 27, 2022, 12:00 PM
PM10 179 (Very bad Hazardous)
PM2,5 35 (Unhealthy for Sensitive Groups)
O3 0 (Good)
NO2 0 (Good)
SO2 0 (Good)
Data on air pollution from recent days in Mingzhong
index
2022-05-27
pm10
56
Unhealthy for Sensitive Groups
pm25
56
Unhealthy
o3
0
Good
no2
0
Good
so2
0
Good
data source »
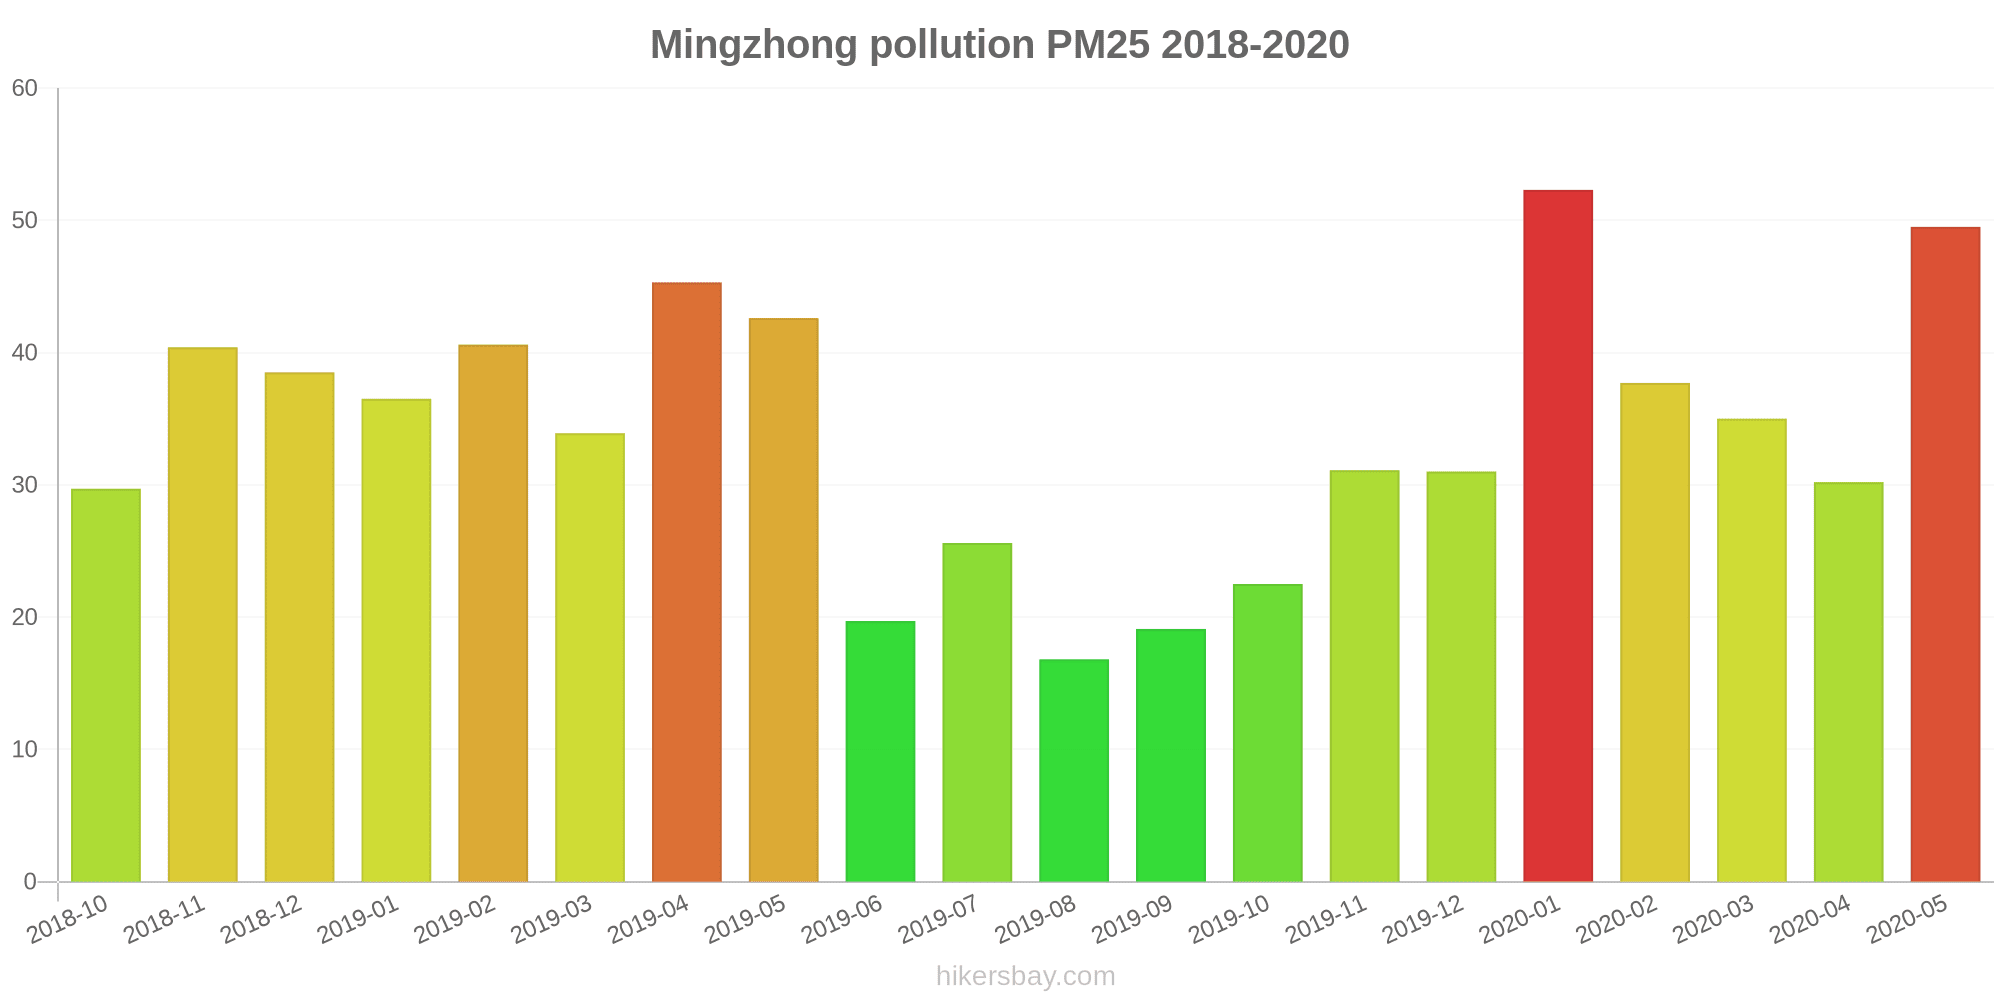
Air pollution in Mingzhong from October 2018 to May 2020

index
2020-05
2020-04
2020-03
2020-02
2020-01
2019-12
2019-11
2019-10
2019-09
2019-08
2019-07
2019-06
2019-05
2019-04
2019-03
2019-02
2019-01
2018-12
2018-11
2018-10
pm25
50 (Unhealthy for Sensitive Groups)
30 (Moderate)
35 (Unhealthy for Sensitive Groups)
38 (Unhealthy for Sensitive Groups)
52 (Unhealthy for Sensitive Groups)
31 (Moderate)
31 (Moderate)
23 (Moderate)
19 (Moderate)
17 (Moderate)
26 (Moderate)
20 (Moderate)
43 (Unhealthy for Sensitive Groups)
45 (Unhealthy for Sensitive Groups)
34 (Moderate)
41 (Unhealthy for Sensitive Groups)
37 (Unhealthy for Sensitive Groups)
39 (Unhealthy for Sensitive Groups)
40 (Unhealthy for Sensitive Groups)
30 (Moderate)
co
355 (Good)
411 (Good)
380 (Good)
512 (Good)
787 (Good)
546 (Good)
527 (Good)
537 (Good)
721 (Good)
686 (Good)
614 (Good)
564 (Good)
446 (Good)
481 (Good)
509 (Good)
693 (Good)
644 (Good)
632 (Good)
476 (Good)
610 (Good)
no2
16 (Good)
17 (Good)
15 (Good)
13 (Good)
29 (Good)
36 (Good)
35 (Good)
33 (Good)
24 (Good)
18 (Good)
17 (Good)
17 (Good)
16 (Good)
29 (Good)
34 (Good)
19 (Good)
28 (Good)
31 (Good)
36 (Good)
29 (Good)
o3
137 (Unhealthy for Sensitive Groups)
129 (Unhealthy for Sensitive Groups)
109 (Moderate)
98 (Moderate)
87 (Moderate)
78 (Moderate)
87 (Moderate)
90 (Moderate)
128 (Unhealthy for Sensitive Groups)
146 (Unhealthy for Sensitive Groups)
151 (Unhealthy)
139 (Unhealthy for Sensitive Groups)
132 (Unhealthy for Sensitive Groups)
140 (Unhealthy for Sensitive Groups)
118 (Moderate)
93 (Moderate)
57 (Good)
51 (Good)
75 (Moderate)
89 (Moderate)
pm10
172 (Very bad Hazardous)
85 (Unhealthy)
118 (Very Unhealthy)
99 (Unhealthy)
70 (Unhealthy for Sensitive Groups)
61 (Unhealthy for Sensitive Groups)
70 (Unhealthy for Sensitive Groups)
58 (Unhealthy for Sensitive Groups)
48 (Moderate)
45 (Moderate)
56 (Unhealthy for Sensitive Groups)
49 (Moderate)
144 (Very Unhealthy)
147 (Very Unhealthy)
97 (Unhealthy)
109 (Unhealthy)
73 (Unhealthy for Sensitive Groups)
117 (Very Unhealthy)
140 (Very Unhealthy)
71 (Unhealthy for Sensitive Groups)
so2
14 (Good)
13 (Good)
9.1 (Good)
10 (Good)
12 (Good)
20 (Good)
18 (Good)
11 (Good)
14 (Good)
15 (Good)
12 (Good)
11 (Good)
8.2 (Good)
12 (Good)
12 (Good)
14 (Good)
18 (Good)
17 (Good)
18 (Good)
11 (Good)
data source »
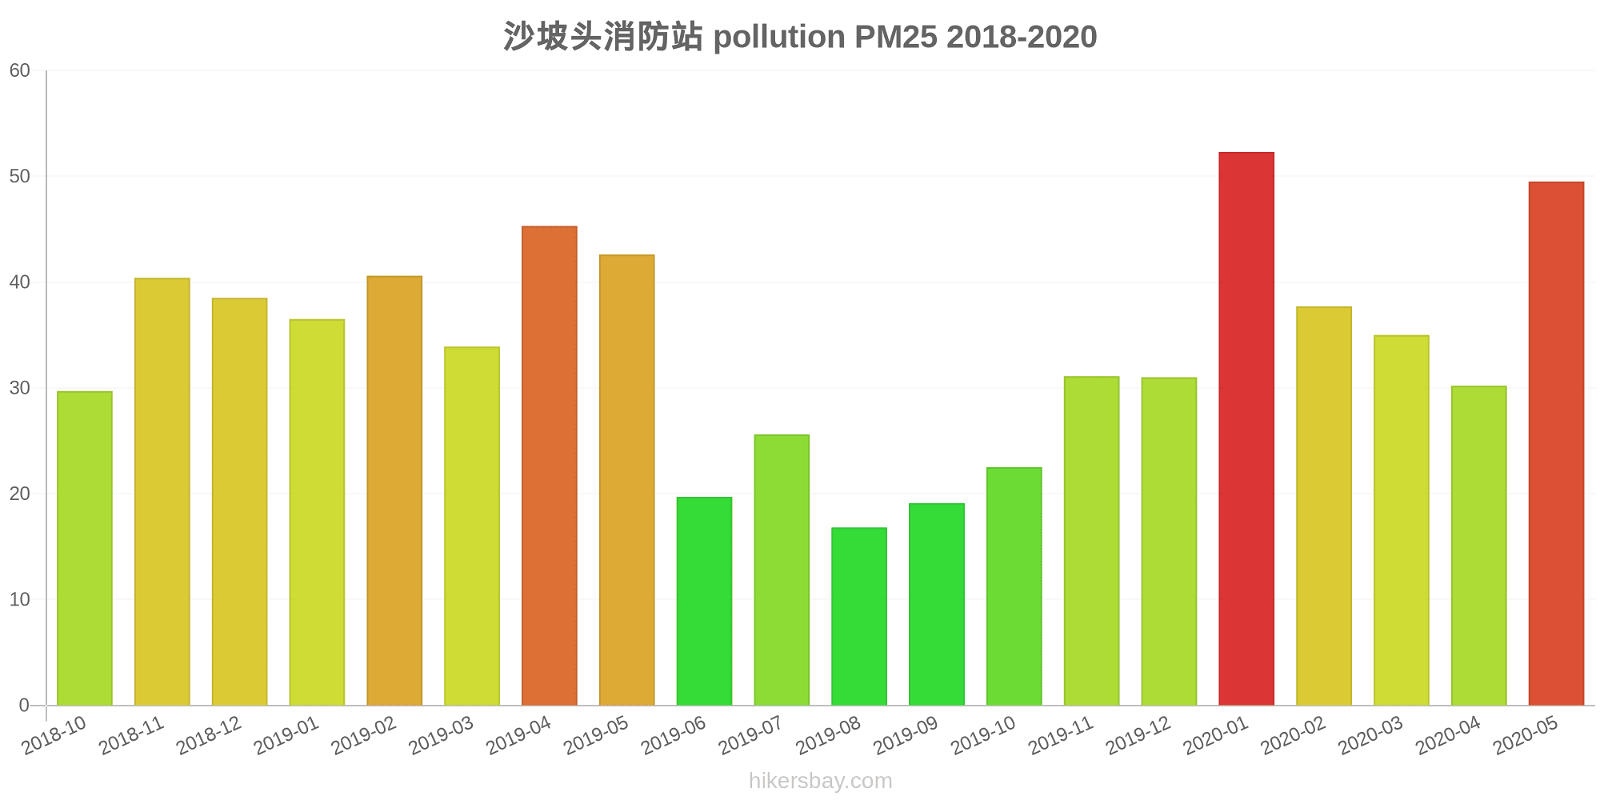
沙坡头消防站
Friday, May 27, 2022, 12:00 PM
PM10 179 (Very bad Hazardous)
particulate matter (PM10) suspended dust
PM2,5 35 (Unhealthy for Sensitive Groups)
particulate matter (PM2.5) dust
O3 0.04 (Good)
ozone (O3)
NO2 0 (Good)
nitrogen dioxide (NO2)
SO2 0 (Good)
sulfur dioxide (SO2)
沙坡头消防站
index
2022-05-27
pm10
56
pm25
56
o3
0.03
no2
0
so2
0
沙坡头消防站
2018-10 2020-05
index
2020-05
2020-04
2020-03
2020-02
2020-01
2019-12
2019-11
2019-10
2019-09
2019-08
2019-07
2019-06
2019-05
2019-04
2019-03
2019-02
2019-01
2018-12
2018-11
2018-10
pm25
50
30
35
38
52
31
31
23
19
17
26
20
43
45
34
41
37
39
40
30
co
355
411
380
512
787
546
527
537
721
686
614
564
446
481
509
693
644
632
476
610
no2
16
17
15
13
29
36
35
33
24
18
17
17
16
29
34
19
28
31
36
29
o3
137
129
109
98
87
78
87
90
128
146
151
139
132
140
118
93
57
51
75
89
pm10
172
85
118
99
70
61
70
58
48
45
56
49
144
147
97
109
73
117
140
71
so2
14
13
9.1
10
12
20
18
11
14
15
12
11
8.2
12
12
14
18
17
18
11
* Pollution data source:
https://openaq.org
(ChinaAQIData)
The data is licensed under CC-By 4.0
PM10 179 (Very bad Hazardous)
PM2,5 35 (Unhealthy for Sensitive Groups)
O3 0 (Good)
NO2 0 (Good)
SO2 0 (Good)
Data on air pollution from recent days in Mingzhong
| index | 2022-05-27 |
|---|---|
| pm10 | 56 Unhealthy for Sensitive Groups |
| pm25 | 56 Unhealthy |
| o3 | 0 Good |
| no2 | 0 Good |
| so2 | 0 Good |
| index | 2020-05 | 2020-04 | 2020-03 | 2020-02 | 2020-01 | 2019-12 | 2019-11 | 2019-10 | 2019-09 | 2019-08 | 2019-07 | 2019-06 | 2019-05 | 2019-04 | 2019-03 | 2019-02 | 2019-01 | 2018-12 | 2018-11 | 2018-10 |
|---|---|---|---|---|---|---|---|---|---|---|---|---|---|---|---|---|---|---|---|---|
| pm25 | 50 (Unhealthy for Sensitive Groups) | 30 (Moderate) | 35 (Unhealthy for Sensitive Groups) | 38 (Unhealthy for Sensitive Groups) | 52 (Unhealthy for Sensitive Groups) | 31 (Moderate) | 31 (Moderate) | 23 (Moderate) | 19 (Moderate) | 17 (Moderate) | 26 (Moderate) | 20 (Moderate) | 43 (Unhealthy for Sensitive Groups) | 45 (Unhealthy for Sensitive Groups) | 34 (Moderate) | 41 (Unhealthy for Sensitive Groups) | 37 (Unhealthy for Sensitive Groups) | 39 (Unhealthy for Sensitive Groups) | 40 (Unhealthy for Sensitive Groups) | 30 (Moderate) |
| co | 355 (Good) | 411 (Good) | 380 (Good) | 512 (Good) | 787 (Good) | 546 (Good) | 527 (Good) | 537 (Good) | 721 (Good) | 686 (Good) | 614 (Good) | 564 (Good) | 446 (Good) | 481 (Good) | 509 (Good) | 693 (Good) | 644 (Good) | 632 (Good) | 476 (Good) | 610 (Good) |
| no2 | 16 (Good) | 17 (Good) | 15 (Good) | 13 (Good) | 29 (Good) | 36 (Good) | 35 (Good) | 33 (Good) | 24 (Good) | 18 (Good) | 17 (Good) | 17 (Good) | 16 (Good) | 29 (Good) | 34 (Good) | 19 (Good) | 28 (Good) | 31 (Good) | 36 (Good) | 29 (Good) |
| o3 | 137 (Unhealthy for Sensitive Groups) | 129 (Unhealthy for Sensitive Groups) | 109 (Moderate) | 98 (Moderate) | 87 (Moderate) | 78 (Moderate) | 87 (Moderate) | 90 (Moderate) | 128 (Unhealthy for Sensitive Groups) | 146 (Unhealthy for Sensitive Groups) | 151 (Unhealthy) | 139 (Unhealthy for Sensitive Groups) | 132 (Unhealthy for Sensitive Groups) | 140 (Unhealthy for Sensitive Groups) | 118 (Moderate) | 93 (Moderate) | 57 (Good) | 51 (Good) | 75 (Moderate) | 89 (Moderate) |
| pm10 | 172 (Very bad Hazardous) | 85 (Unhealthy) | 118 (Very Unhealthy) | 99 (Unhealthy) | 70 (Unhealthy for Sensitive Groups) | 61 (Unhealthy for Sensitive Groups) | 70 (Unhealthy for Sensitive Groups) | 58 (Unhealthy for Sensitive Groups) | 48 (Moderate) | 45 (Moderate) | 56 (Unhealthy for Sensitive Groups) | 49 (Moderate) | 144 (Very Unhealthy) | 147 (Very Unhealthy) | 97 (Unhealthy) | 109 (Unhealthy) | 73 (Unhealthy for Sensitive Groups) | 117 (Very Unhealthy) | 140 (Very Unhealthy) | 71 (Unhealthy for Sensitive Groups) |
| so2 | 14 (Good) | 13 (Good) | 9.1 (Good) | 10 (Good) | 12 (Good) | 20 (Good) | 18 (Good) | 11 (Good) | 14 (Good) | 15 (Good) | 12 (Good) | 11 (Good) | 8.2 (Good) | 12 (Good) | 12 (Good) | 14 (Good) | 18 (Good) | 17 (Good) | 18 (Good) | 11 (Good) |
PM10 179 (Very bad Hazardous)
particulate matter (PM10) suspended dustPM2,5 35 (Unhealthy for Sensitive Groups)
particulate matter (PM2.5) dustO3 0.04 (Good)
ozone (O3)NO2 0 (Good)
nitrogen dioxide (NO2)SO2 0 (Good)
sulfur dioxide (SO2)沙坡头消防站
| index | 2022-05-27 |
|---|---|
| pm10 | 56 |
| pm25 | 56 |
| o3 | 0.03 |
| no2 | 0 |
| so2 | 0 |
沙坡头消防站

| index | 2020-05 | 2020-04 | 2020-03 | 2020-02 | 2020-01 | 2019-12 | 2019-11 | 2019-10 | 2019-09 | 2019-08 | 2019-07 | 2019-06 | 2019-05 | 2019-04 | 2019-03 | 2019-02 | 2019-01 | 2018-12 | 2018-11 | 2018-10 |
|---|---|---|---|---|---|---|---|---|---|---|---|---|---|---|---|---|---|---|---|---|
| pm25 | 50 | 30 | 35 | 38 | 52 | 31 | 31 | 23 | 19 | 17 | 26 | 20 | 43 | 45 | 34 | 41 | 37 | 39 | 40 | 30 |
| co | 355 | 411 | 380 | 512 | 787 | 546 | 527 | 537 | 721 | 686 | 614 | 564 | 446 | 481 | 509 | 693 | 644 | 632 | 476 | 610 |
| no2 | 16 | 17 | 15 | 13 | 29 | 36 | 35 | 33 | 24 | 18 | 17 | 17 | 16 | 29 | 34 | 19 | 28 | 31 | 36 | 29 |
| o3 | 137 | 129 | 109 | 98 | 87 | 78 | 87 | 90 | 128 | 146 | 151 | 139 | 132 | 140 | 118 | 93 | 57 | 51 | 75 | 89 |
| pm10 | 172 | 85 | 118 | 99 | 70 | 61 | 70 | 58 | 48 | 45 | 56 | 49 | 144 | 147 | 97 | 109 | 73 | 117 | 140 | 71 |
| so2 | 14 | 13 | 9.1 | 10 | 12 | 20 | 18 | 11 | 14 | 15 | 12 | 11 | 8.2 | 12 | 12 | 14 | 18 | 17 | 18 | 11 |