Air Pollution in Shizi: Real-time Air Quality Index and smog alert.
Pollution and air quality forecast for Shizi. Today is Tuesday, June 16, 2026. The following air pollution values have been recorded for Shizi:- particulate matter (PM2.5) dust - 61 (Unhealthy)
- nitrogen dioxide (NO2) - 22 (Good)
- particulate matter (PM10) suspended dust - 69 (Unhealthy for Sensitive Groups)
- carbon monoxide (CO) - 219 (Good)
- ozone (O3) - 0 (Good)
- sulfur dioxide (SO2) - 8 (Good)

What is the air quality in Shizi today? Is the air polluted in Shizi?. Is there smog?
What is the current level of PM2.5 in Shizi? (particulate matter (PM2.5) dust)
Today's PM2.5 level is:
61 (Unhealthy)
For comparison, the highest level of PM2.5 in Shizi in the last 7 days was: 28 (Friday, May 27, 2022) and the lowest: 28 (Friday, May 27, 2022).
The highest PM2.5 values were recorded: 79 (January 2019).
The lowest level of particulate matter PM2.5 pollution occurs in month: July (13).
How high is the level of NO2? (nitrogen dioxide (NO2))
22 (Good)
What is the level of PM10 today in Shizi? (particulate matter (PM10) suspended dust)
The current level of particulate matter PM10 in Shizi is:
69 (Unhealthy for Sensitive Groups)
The highest PM10 values usually occur in month: 106 (January 2019).
The lowest value of particulate matter PM10 pollution in Shizi is usually recorded in: July (25).
How high is the CO level? (carbon monoxide (CO))
219 (Good)
How is the O3 level today in Shizi? (ozone (O3))
0 (Good)
What is the level of SO2 pollution? (sulfur dioxide (SO2))
8 (Good)
Current data Friday, May 27, 2022, 3:00 PM
PM2,5 61 (Unhealthy)
NO2 22 (Good)
PM10 69 (Unhealthy for Sensitive Groups)
CO 219 (Good)
O3 0 (Good)
SO2 8 (Good)
Data on air pollution from recent days in Shizi
index
2022-05-27
pm25
28
Moderate
no2
22
Good
pm10
35
Moderate
co
579
Good
o3
22
Good
so2
5
Good
data source »
Air pollution in Shizi from October 2018 to May 2020

index
2020-05
2020-04
2020-03
2020-02
2020-01
2019-12
2019-11
2019-10
2019-09
2019-08
2019-07
2019-06
2019-05
2019-04
2019-03
2019-02
2019-01
2018-12
2018-11
2018-10
pm25
32 (Moderate)
26 (Moderate)
29 (Moderate)
49 (Unhealthy for Sensitive Groups)
60 (Unhealthy)
57 (Unhealthy)
36 (Unhealthy for Sensitive Groups)
20 (Moderate)
22 (Moderate)
17 (Moderate)
13 (Good)
15 (Moderate)
27 (Moderate)
25 (Moderate)
37 (Unhealthy for Sensitive Groups)
58 (Unhealthy)
79 (Very Unhealthy)
62 (Unhealthy)
43 (Unhealthy for Sensitive Groups)
24 (Moderate)
co
540 (Good)
601 (Good)
570 (Good)
728 (Good)
894 (Good)
818 (Good)
600 (Good)
569 (Good)
592 (Good)
585 (Good)
545 (Good)
575 (Good)
572 (Good)
620 (Good)
673 (Good)
864 (Good)
494 (Good)
797 (Good)
637 (Good)
735 (Good)
no2
28 (Good)
26 (Good)
24 (Good)
14 (Good)
28 (Good)
31 (Good)
28 (Good)
21 (Good)
21 (Good)
23 (Good)
17 (Good)
20 (Good)
20 (Good)
27 (Good)
31 (Good)
26 (Good)
39 (Good)
27 (Good)
28 (Good)
25 (Good)
o3
162 (Unhealthy)
128 (Unhealthy for Sensitive Groups)
117 (Moderate)
89 (Moderate)
74 (Moderate)
67 (Good)
68 (Good)
90 (Moderate)
102 (Moderate)
142 (Unhealthy for Sensitive Groups)
111 (Moderate)
128 (Unhealthy for Sensitive Groups)
125 (Unhealthy for Sensitive Groups)
141 (Unhealthy for Sensitive Groups)
107 (Moderate)
79 (Moderate)
72 (Moderate)
52 (Good)
79 (Moderate)
86 (Moderate)
pm10
71 (Unhealthy for Sensitive Groups)
51 (Unhealthy for Sensitive Groups)
58 (Unhealthy for Sensitive Groups)
72 (Unhealthy for Sensitive Groups)
85 (Unhealthy)
84 (Unhealthy)
61 (Unhealthy for Sensitive Groups)
33 (Moderate)
34 (Moderate)
33 (Moderate)
25 (Moderate)
31 (Moderate)
49 (Moderate)
47 (Moderate)
61 (Unhealthy for Sensitive Groups)
81 (Unhealthy)
106 (Unhealthy)
91 (Unhealthy)
70 (Unhealthy for Sensitive Groups)
58 (Unhealthy for Sensitive Groups)
so2
11 (Good)
8 (Good)
8.8 (Good)
6.3 (Good)
5.6 (Good)
6.2 (Good)
5.1 (Good)
6 (Good)
7.2 (Good)
8.4 (Good)
7.9 (Good)
7.7 (Good)
6.3 (Good)
8 (Good)
7.3 (Good)
5.8 (Good)
6.3 (Good)
4.9 (Good)
5.5 (Good)
5.6 (Good)
data source »
四三一厂
Friday, May 27, 2022, 3:00 PM
PM2,5 61 (Unhealthy)
particulate matter (PM2.5) dust
NO2 22 (Good)
nitrogen dioxide (NO2)
PM10 69 (Unhealthy for Sensitive Groups)
particulate matter (PM10) suspended dust
CO 219 (Good)
carbon monoxide (CO)
O3 0.05 (Good)
ozone (O3)
SO2 7.7 (Good)
sulfur dioxide (SO2)
资阳中学
Friday, May 27, 2022, 3:00 PM
PM2,5 61 (Unhealthy)
particulate matter (PM2.5) dust
NO2 22 (Good)
nitrogen dioxide (NO2)
PM10 69 (Unhealthy for Sensitive Groups)
particulate matter (PM10) suspended dust
CO 219 (Good)
carbon monoxide (CO)
O3 0.05 (Good)
ozone (O3)
SO2 7.7 (Good)
sulfur dioxide (SO2)
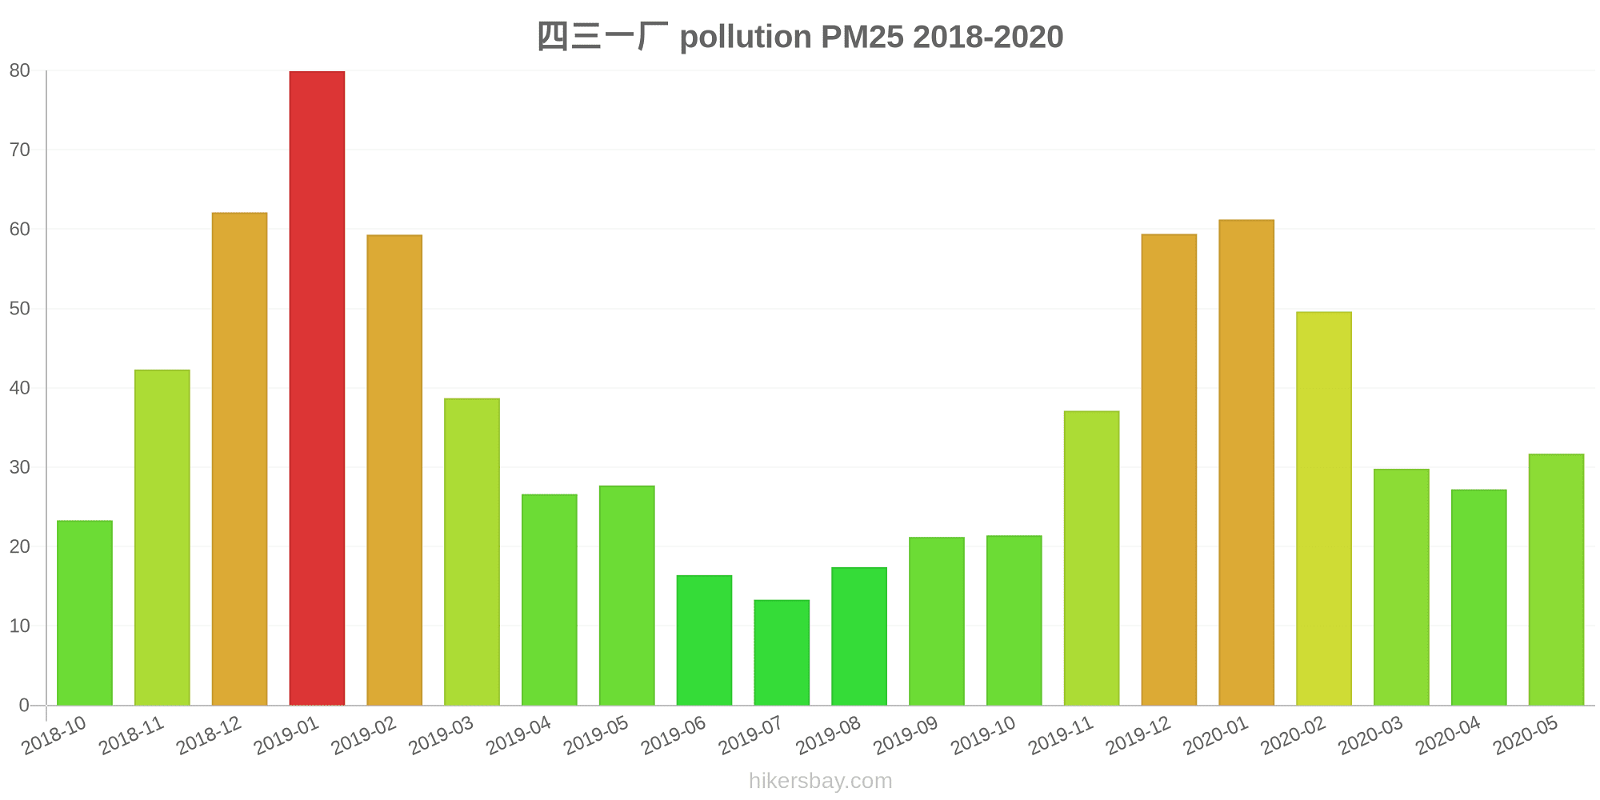
四三一厂
index
2022-05-27
pm25
28
no2
22
pm10
35
co
579
o3
22
so2
4.6
资阳中学
index
2022-05-27
pm25
28
no2
22
pm10
35
co
579
o3
22
so2
4.6
四三一厂
2018-10 2020-05
index
2020-05
2020-04
2020-03
2020-02
2020-01
2019-12
2019-11
2019-10
2019-09
2019-08
2019-07
2019-06
2019-05
2019-04
2019-03
2019-02
2019-01
2018-12
2018-11
2018-10
pm25
32
27
30
50
61
59
37
21
21
17
13
16
28
27
39
59
80
62
42
23
co
593
616
575
755
994
842
646
570
567
573
539
595
572
636
688
902
1
817
664
714
no2
30
29
28
17
33
36
32
25
24
26
19
20
21
30
37
32
47
26
28
25
o3
164
127
116
90
74
67
66
86
100
140
110
124
119
136
102
76
68
52
79
81
pm10
71
53
60
75
88
89
65
36
36
34
25
34
52
49
64
83
110
91
68
55
so2
10
8.3
9.6
6.9
5.9
6.7
5.4
6.3
7.3
7.8
7.8
8.3
6.4
8.3
7.2
6.2
5.8
4.2
5.8
6.5
资阳中学
2018-10 2020-05

index
2020-05
2020-04
2020-03
2020-02
2020-01
2019-12
2019-11
2019-10
2019-09
2019-08
2019-07
2019-06
2019-05
2019-04
2019-03
2019-02
2019-01
2018-12
2018-11
2018-10
pm25
31
24
28
48
59
55
34
18
23
16
12
14
26
24
36
58
78
61
44
24
co
487
586
564
701
793
794
554
567
616
596
551
554
572
604
657
826
986
777
609
755
no2
26
23
21
11
23
27
24
18
18
20
15
19
19
23
26
20
31
29
29
26
o3
160
128
117
88
73
67
70
93
103
144
112
131
131
146
111
83
77
51
79
92
pm10
71
49
56
68
81
80
57
30
32
33
24
28
46
45
58
79
101
90
71
61
so2
11
7.7
8.1
5.7
5.3
5.7
4.7
5.6
7.1
8.9
8.1
7
6.1
7.7
7.5
5.3
6.9
5.6
5.3
4.6
* Pollution data source:
https://openaq.org
(ChinaAQIData)
The data is licensed under CC-By 4.0
PM2,5 61 (Unhealthy)
NO2 22 (Good)
PM10 69 (Unhealthy for Sensitive Groups)
CO 219 (Good)
O3 0 (Good)
SO2 8 (Good)
Data on air pollution from recent days in Shizi
| index | 2022-05-27 |
|---|---|
| pm25 | 28 Moderate |
| no2 | 22 Good |
| pm10 | 35 Moderate |
| co | 579 Good |
| o3 | 22 Good |
| so2 | 5 Good |
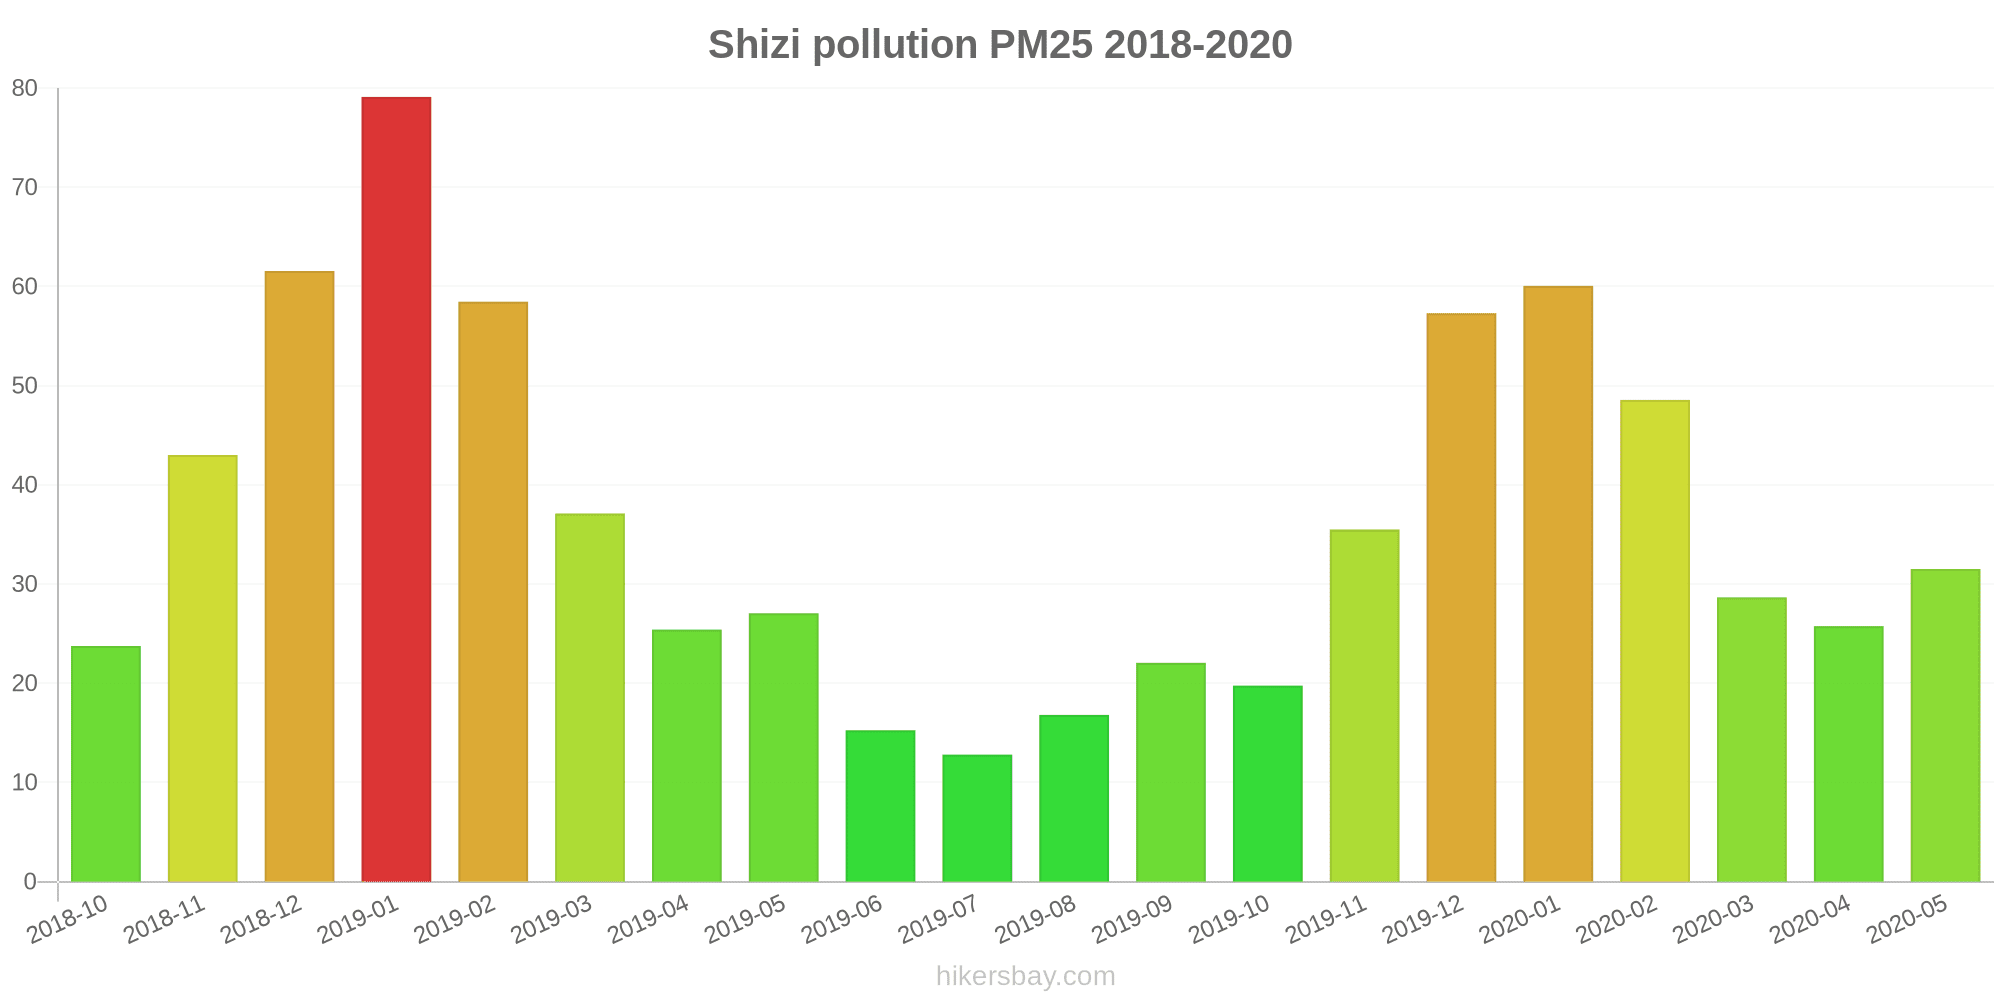
| index | 2020-05 | 2020-04 | 2020-03 | 2020-02 | 2020-01 | 2019-12 | 2019-11 | 2019-10 | 2019-09 | 2019-08 | 2019-07 | 2019-06 | 2019-05 | 2019-04 | 2019-03 | 2019-02 | 2019-01 | 2018-12 | 2018-11 | 2018-10 |
|---|---|---|---|---|---|---|---|---|---|---|---|---|---|---|---|---|---|---|---|---|
| pm25 | 32 (Moderate) | 26 (Moderate) | 29 (Moderate) | 49 (Unhealthy for Sensitive Groups) | 60 (Unhealthy) | 57 (Unhealthy) | 36 (Unhealthy for Sensitive Groups) | 20 (Moderate) | 22 (Moderate) | 17 (Moderate) | 13 (Good) | 15 (Moderate) | 27 (Moderate) | 25 (Moderate) | 37 (Unhealthy for Sensitive Groups) | 58 (Unhealthy) | 79 (Very Unhealthy) | 62 (Unhealthy) | 43 (Unhealthy for Sensitive Groups) | 24 (Moderate) |
| co | 540 (Good) | 601 (Good) | 570 (Good) | 728 (Good) | 894 (Good) | 818 (Good) | 600 (Good) | 569 (Good) | 592 (Good) | 585 (Good) | 545 (Good) | 575 (Good) | 572 (Good) | 620 (Good) | 673 (Good) | 864 (Good) | 494 (Good) | 797 (Good) | 637 (Good) | 735 (Good) |
| no2 | 28 (Good) | 26 (Good) | 24 (Good) | 14 (Good) | 28 (Good) | 31 (Good) | 28 (Good) | 21 (Good) | 21 (Good) | 23 (Good) | 17 (Good) | 20 (Good) | 20 (Good) | 27 (Good) | 31 (Good) | 26 (Good) | 39 (Good) | 27 (Good) | 28 (Good) | 25 (Good) |
| o3 | 162 (Unhealthy) | 128 (Unhealthy for Sensitive Groups) | 117 (Moderate) | 89 (Moderate) | 74 (Moderate) | 67 (Good) | 68 (Good) | 90 (Moderate) | 102 (Moderate) | 142 (Unhealthy for Sensitive Groups) | 111 (Moderate) | 128 (Unhealthy for Sensitive Groups) | 125 (Unhealthy for Sensitive Groups) | 141 (Unhealthy for Sensitive Groups) | 107 (Moderate) | 79 (Moderate) | 72 (Moderate) | 52 (Good) | 79 (Moderate) | 86 (Moderate) |
| pm10 | 71 (Unhealthy for Sensitive Groups) | 51 (Unhealthy for Sensitive Groups) | 58 (Unhealthy for Sensitive Groups) | 72 (Unhealthy for Sensitive Groups) | 85 (Unhealthy) | 84 (Unhealthy) | 61 (Unhealthy for Sensitive Groups) | 33 (Moderate) | 34 (Moderate) | 33 (Moderate) | 25 (Moderate) | 31 (Moderate) | 49 (Moderate) | 47 (Moderate) | 61 (Unhealthy for Sensitive Groups) | 81 (Unhealthy) | 106 (Unhealthy) | 91 (Unhealthy) | 70 (Unhealthy for Sensitive Groups) | 58 (Unhealthy for Sensitive Groups) |
| so2 | 11 (Good) | 8 (Good) | 8.8 (Good) | 6.3 (Good) | 5.6 (Good) | 6.2 (Good) | 5.1 (Good) | 6 (Good) | 7.2 (Good) | 8.4 (Good) | 7.9 (Good) | 7.7 (Good) | 6.3 (Good) | 8 (Good) | 7.3 (Good) | 5.8 (Good) | 6.3 (Good) | 4.9 (Good) | 5.5 (Good) | 5.6 (Good) |
PM2,5 61 (Unhealthy)
particulate matter (PM2.5) dustNO2 22 (Good)
nitrogen dioxide (NO2)PM10 69 (Unhealthy for Sensitive Groups)
particulate matter (PM10) suspended dustCO 219 (Good)
carbon monoxide (CO)O3 0.05 (Good)
ozone (O3)SO2 7.7 (Good)
sulfur dioxide (SO2)PM2,5 61 (Unhealthy)
particulate matter (PM2.5) dustNO2 22 (Good)
nitrogen dioxide (NO2)PM10 69 (Unhealthy for Sensitive Groups)
particulate matter (PM10) suspended dustCO 219 (Good)
carbon monoxide (CO)O3 0.05 (Good)
ozone (O3)SO2 7.7 (Good)
sulfur dioxide (SO2)四三一厂
| index | 2022-05-27 |
|---|---|
| pm25 | 28 |
| no2 | 22 |
| pm10 | 35 |
| co | 579 |
| o3 | 22 |
| so2 | 4.6 |
资阳中学
| index | 2022-05-27 |
|---|---|
| pm25 | 28 |
| no2 | 22 |
| pm10 | 35 |
| co | 579 |
| o3 | 22 |
| so2 | 4.6 |
四三一厂

| index | 2020-05 | 2020-04 | 2020-03 | 2020-02 | 2020-01 | 2019-12 | 2019-11 | 2019-10 | 2019-09 | 2019-08 | 2019-07 | 2019-06 | 2019-05 | 2019-04 | 2019-03 | 2019-02 | 2019-01 | 2018-12 | 2018-11 | 2018-10 |
|---|---|---|---|---|---|---|---|---|---|---|---|---|---|---|---|---|---|---|---|---|
| pm25 | 32 | 27 | 30 | 50 | 61 | 59 | 37 | 21 | 21 | 17 | 13 | 16 | 28 | 27 | 39 | 59 | 80 | 62 | 42 | 23 |
| co | 593 | 616 | 575 | 755 | 994 | 842 | 646 | 570 | 567 | 573 | 539 | 595 | 572 | 636 | 688 | 902 | 1 | 817 | 664 | 714 |
| no2 | 30 | 29 | 28 | 17 | 33 | 36 | 32 | 25 | 24 | 26 | 19 | 20 | 21 | 30 | 37 | 32 | 47 | 26 | 28 | 25 |
| o3 | 164 | 127 | 116 | 90 | 74 | 67 | 66 | 86 | 100 | 140 | 110 | 124 | 119 | 136 | 102 | 76 | 68 | 52 | 79 | 81 |
| pm10 | 71 | 53 | 60 | 75 | 88 | 89 | 65 | 36 | 36 | 34 | 25 | 34 | 52 | 49 | 64 | 83 | 110 | 91 | 68 | 55 |
| so2 | 10 | 8.3 | 9.6 | 6.9 | 5.9 | 6.7 | 5.4 | 6.3 | 7.3 | 7.8 | 7.8 | 8.3 | 6.4 | 8.3 | 7.2 | 6.2 | 5.8 | 4.2 | 5.8 | 6.5 |
资阳中学
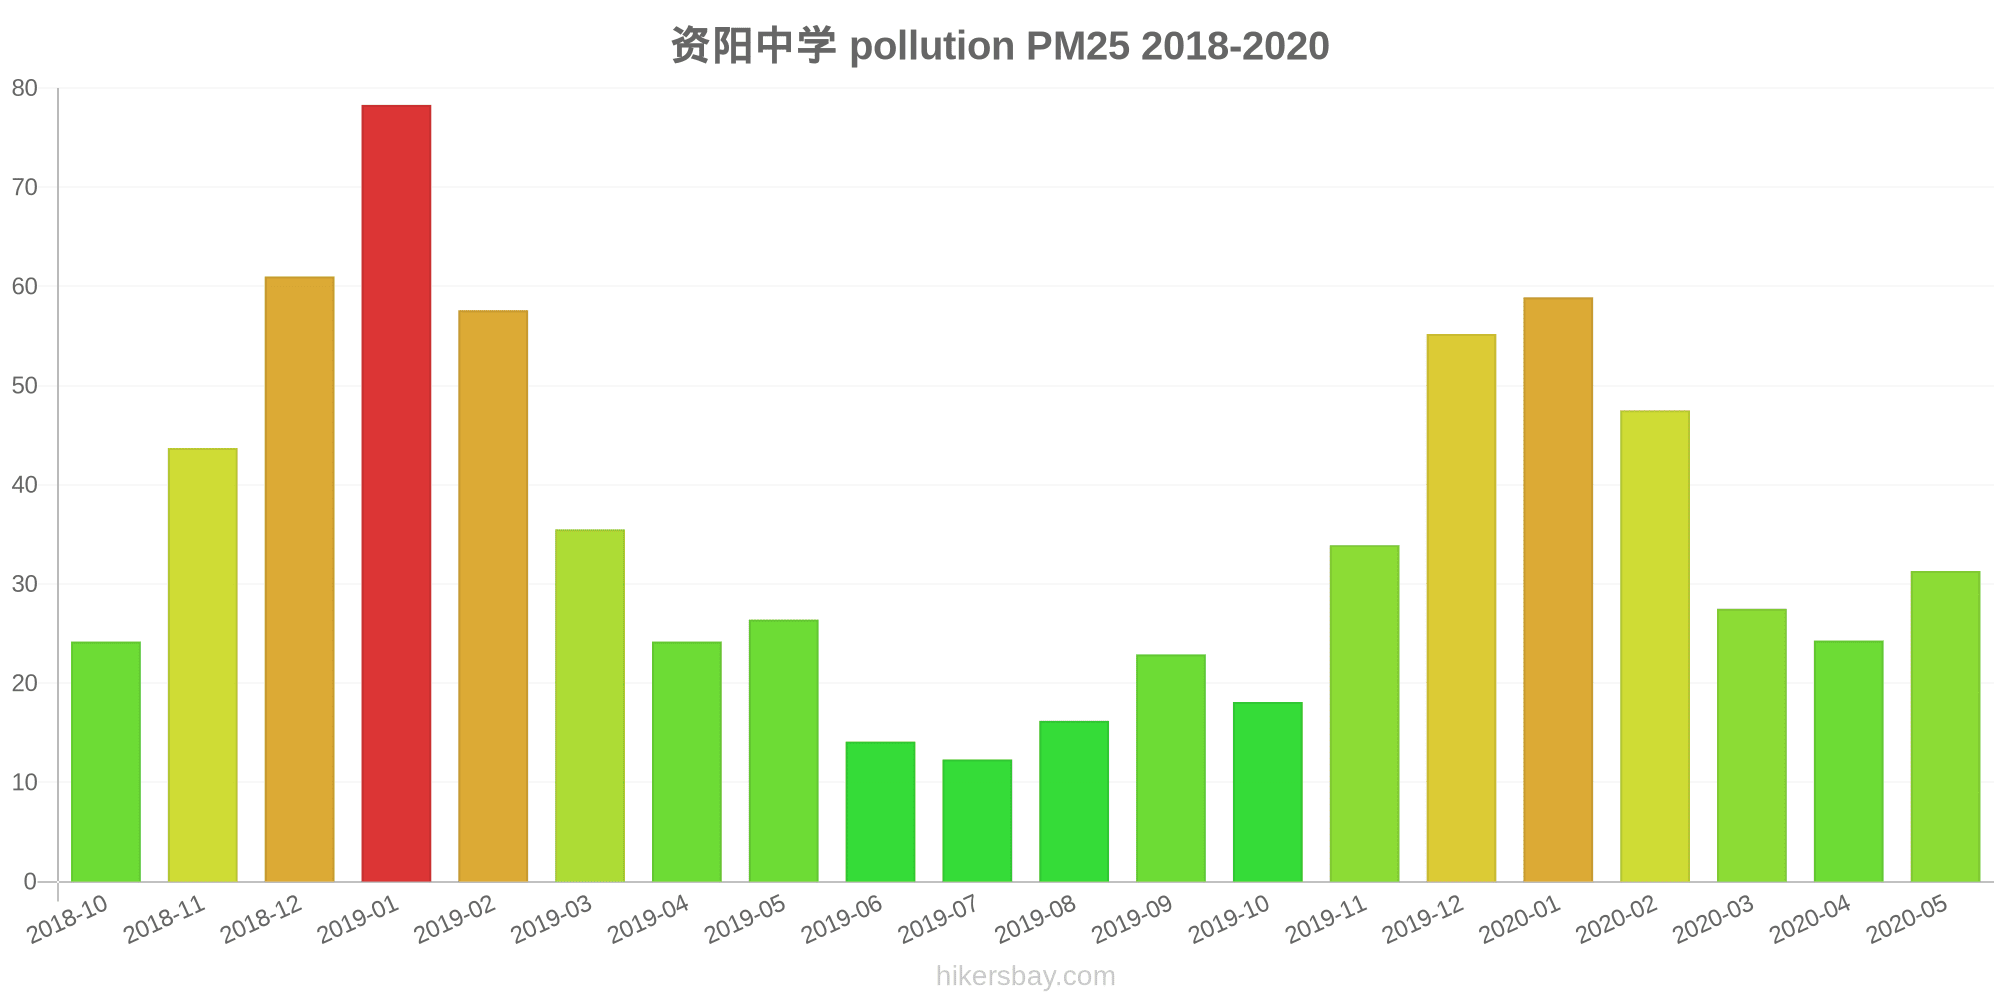
| index | 2020-05 | 2020-04 | 2020-03 | 2020-02 | 2020-01 | 2019-12 | 2019-11 | 2019-10 | 2019-09 | 2019-08 | 2019-07 | 2019-06 | 2019-05 | 2019-04 | 2019-03 | 2019-02 | 2019-01 | 2018-12 | 2018-11 | 2018-10 |
|---|---|---|---|---|---|---|---|---|---|---|---|---|---|---|---|---|---|---|---|---|
| pm25 | 31 | 24 | 28 | 48 | 59 | 55 | 34 | 18 | 23 | 16 | 12 | 14 | 26 | 24 | 36 | 58 | 78 | 61 | 44 | 24 |
| co | 487 | 586 | 564 | 701 | 793 | 794 | 554 | 567 | 616 | 596 | 551 | 554 | 572 | 604 | 657 | 826 | 986 | 777 | 609 | 755 |
| no2 | 26 | 23 | 21 | 11 | 23 | 27 | 24 | 18 | 18 | 20 | 15 | 19 | 19 | 23 | 26 | 20 | 31 | 29 | 29 | 26 |
| o3 | 160 | 128 | 117 | 88 | 73 | 67 | 70 | 93 | 103 | 144 | 112 | 131 | 131 | 146 | 111 | 83 | 77 | 51 | 79 | 92 |
| pm10 | 71 | 49 | 56 | 68 | 81 | 80 | 57 | 30 | 32 | 33 | 24 | 28 | 46 | 45 | 58 | 79 | 101 | 90 | 71 | 61 |
| so2 | 11 | 7.7 | 8.1 | 5.7 | 5.3 | 5.7 | 4.7 | 5.6 | 7.1 | 8.9 | 8.1 | 7 | 6.1 | 7.7 | 7.5 | 5.3 | 6.9 | 5.6 | 5.3 | 4.6 |