Air Pollution in Xizhimen: Real-time Air Quality Index and smog alert.
Pollution and air quality forecast for Xizhimen. Today is Saturday, June 13, 2026. The following air pollution values have been recorded for Xizhimen:- nitrogen dioxide (NO2) - 7 (Good)
- particulate matter (PM10) suspended dust - 19 (Good)
- ozone (O3) - 91 (Moderate)
- particulate matter (PM2.5) dust - 10 (Good)
- sulfur dioxide (SO2) - 0 (Good)
- carbon monoxide (CO) - 100 (Good)

What is the air quality in Xizhimen today? Is the air polluted in Xizhimen?. Is there smog?
How high is the level of NO2? (nitrogen dioxide (NO2))
7 (Good)
What is the level of PM10 today in Xizhimen? (particulate matter (PM10) suspended dust)
The current level of particulate matter PM10 in Xizhimen is:
19 (Good)
The highest PM10 values usually occur in month: 113 (November 2018).
The lowest value of particulate matter PM10 pollution in Xizhimen is usually recorded in: August (39).
How is the O3 level today in Xizhimen? (ozone (O3))
91 (Moderate)
What is the current level of PM2.5 in Xizhimen? (particulate matter (PM2.5) dust)
Today's PM2.5 level is:
10 (Good)
For comparison, the highest level of PM2.5 in Xizhimen in the last 7 days was: 20 (Friday, May 27, 2022) and the lowest: 20 (Friday, May 27, 2022).
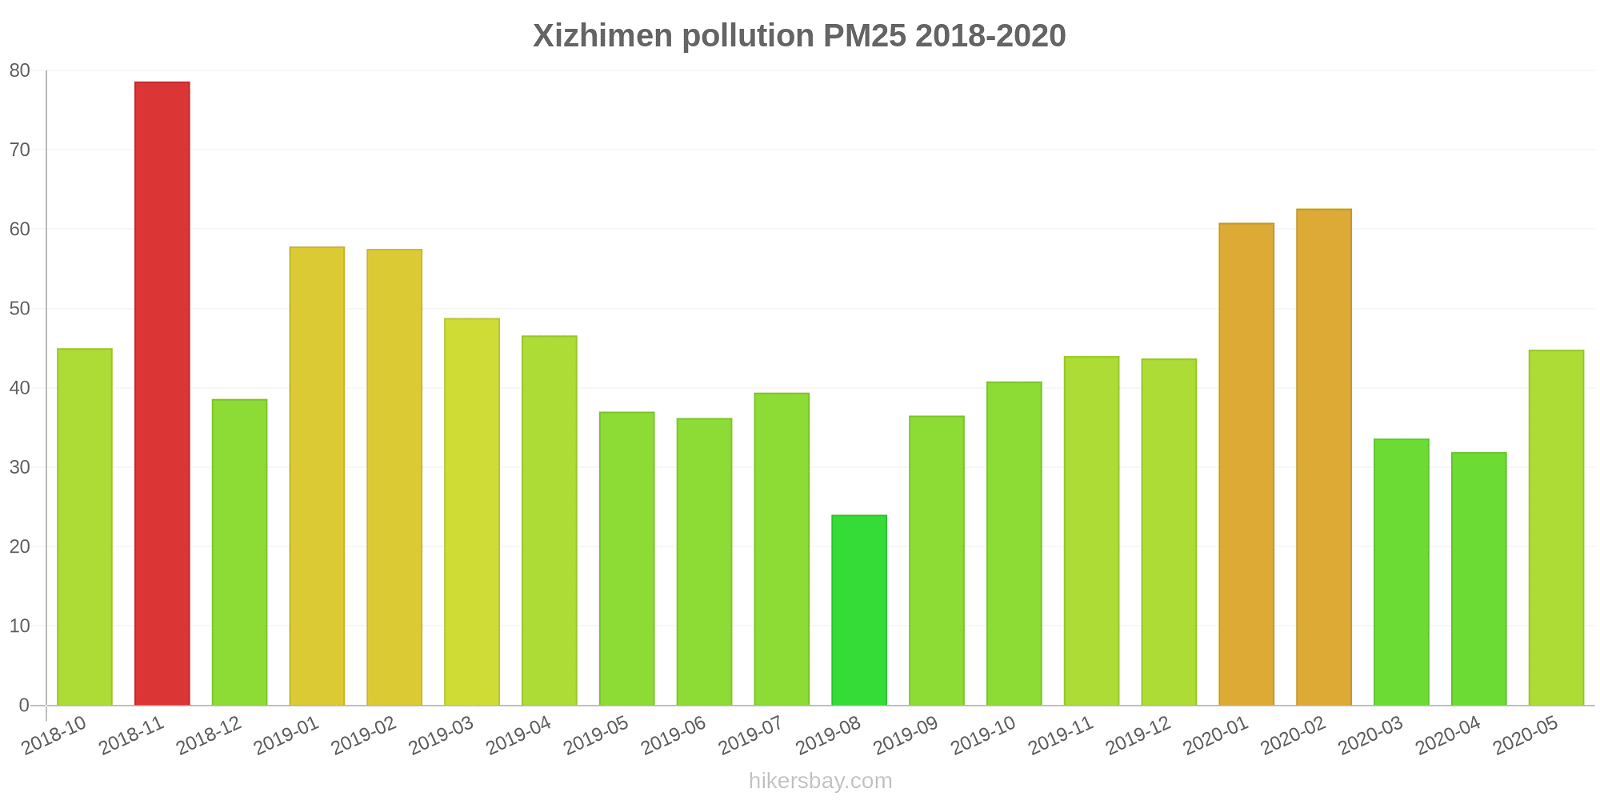
The highest PM2.5 values were recorded: 79 (November 2018).
The lowest level of particulate matter PM2.5 pollution occurs in month: August (24).
What is the level of SO2 pollution? (sulfur dioxide (SO2))
0 (Good)
How high is the CO level? (carbon monoxide (CO))
100 (Good)
Current data Friday, May 27, 2022, 12:00 PM
NO2 7 (Good)
PM10 19 (Good)
O3 91 (Moderate)
PM2,5 10 (Good)
SO2 0 (Good)
CO 100 (Good)
Data on air pollution from recent days in Xizhimen
index
2022-05-27
no2
20
Good
pm10
27
Moderate
o3
39
Good
pm25
20
Moderate
so2
5
Good
co
240
Good
data source »
Air pollution in Xizhimen from October 2018 to May 2020
index
2020-05
2020-04
2020-03
2020-02
2020-01
2019-12
2019-11
2019-10
2019-09
2019-08
2019-07
2019-06
2019-05
2019-04
2019-03
2019-02
2019-01
2018-12
2018-11
2018-10
pm25
45 (Unhealthy for Sensitive Groups)
32 (Moderate)
34 (Moderate)
63 (Unhealthy)
61 (Unhealthy)
44 (Unhealthy for Sensitive Groups)
44 (Unhealthy for Sensitive Groups)
41 (Unhealthy for Sensitive Groups)
37 (Unhealthy for Sensitive Groups)
24 (Moderate)
39 (Unhealthy for Sensitive Groups)
36 (Unhealthy for Sensitive Groups)
37 (Unhealthy for Sensitive Groups)
47 (Unhealthy for Sensitive Groups)
49 (Unhealthy for Sensitive Groups)
58 (Unhealthy)
58 (Unhealthy)
39 (Unhealthy for Sensitive Groups)
79 (Very Unhealthy)
45 (Unhealthy for Sensitive Groups)
co
649 (Good)
399 (Good)
474 (Good)
928 (Good)
1 (Good)
856 (Good)
797 (Good)
729 (Good)
703 (Good)
593 (Good)
736 (Good)
722 (Good)
532 (Good)
561 (Good)
594 (Good)
809 (Good)
966 (Good)
700 (Good)
1 (Good)
678 (Good)
no2
23 (Good)
24 (Good)
27 (Good)
30 (Good)
44 (Moderate)
51 (Moderate)
52 (Moderate)
45 (Moderate)
33 (Good)
30 (Good)
31 (Good)
30 (Good)
36 (Good)
36 (Good)
41 (Moderate)
38 (Good)
57 (Moderate)
48 (Moderate)
67 (Moderate)
56 (Moderate)
o3
146 (Unhealthy for Sensitive Groups)
136 (Unhealthy for Sensitive Groups)
98 (Moderate)
79 (Moderate)
62 (Good)
47 (Good)
41 (Good)
74 (Moderate)
180 (Very Unhealthy)
145 (Unhealthy for Sensitive Groups)
201 (Very Unhealthy)
219 (Very Unhealthy)
173 (Unhealthy)
124 (Unhealthy for Sensitive Groups)
103 (Moderate)
74 (Moderate)
52 (Good)
47 (Good)
55 (Good)
82 (Moderate)
pm10
70 (Unhealthy for Sensitive Groups)
63 (Unhealthy for Sensitive Groups)
49 (Moderate)
55 (Unhealthy for Sensitive Groups)
68 (Unhealthy for Sensitive Groups)
62 (Unhealthy for Sensitive Groups)
82 (Unhealthy)
69 (Unhealthy for Sensitive Groups)
60 (Unhealthy for Sensitive Groups)
39 (Moderate)
54 (Unhealthy for Sensitive Groups)
61 (Unhealthy for Sensitive Groups)
78 (Unhealthy for Sensitive Groups)
86 (Unhealthy)
77 (Unhealthy for Sensitive Groups)
77 (Unhealthy for Sensitive Groups)
88 (Unhealthy)
74 (Unhealthy for Sensitive Groups)
113 (Very Unhealthy)
75 (Unhealthy for Sensitive Groups)
so2
4.1 (Good)
4.2 (Good)
4.7 (Good)
4.6 (Good)
7.5 (Good)
4.1 (Good)
4.7 (Good)
3.7 (Good)
3.3 (Good)
2.7 (Good)
2.8 (Good)
4.3 (Good)
4.6 (Good)
4.6 (Good)
5.6 (Good)
6.6 (Good)
9.3 (Good)
6.6 (Good)
7.3 (Good)
4 (Good)
data source »
官园
Friday, May 27, 2022, 12:00 PM
NO2 7.3 (Good)
nitrogen dioxide (NO2)
PM10 19 (Good)
particulate matter (PM10) suspended dust
O3 91 (Moderate)
ozone (O3)
PM2,5 10 (Good)
particulate matter (PM2.5) dust
SO2 0.1 (Good)
sulfur dioxide (SO2)
CO 100 (Good)
carbon monoxide (CO)
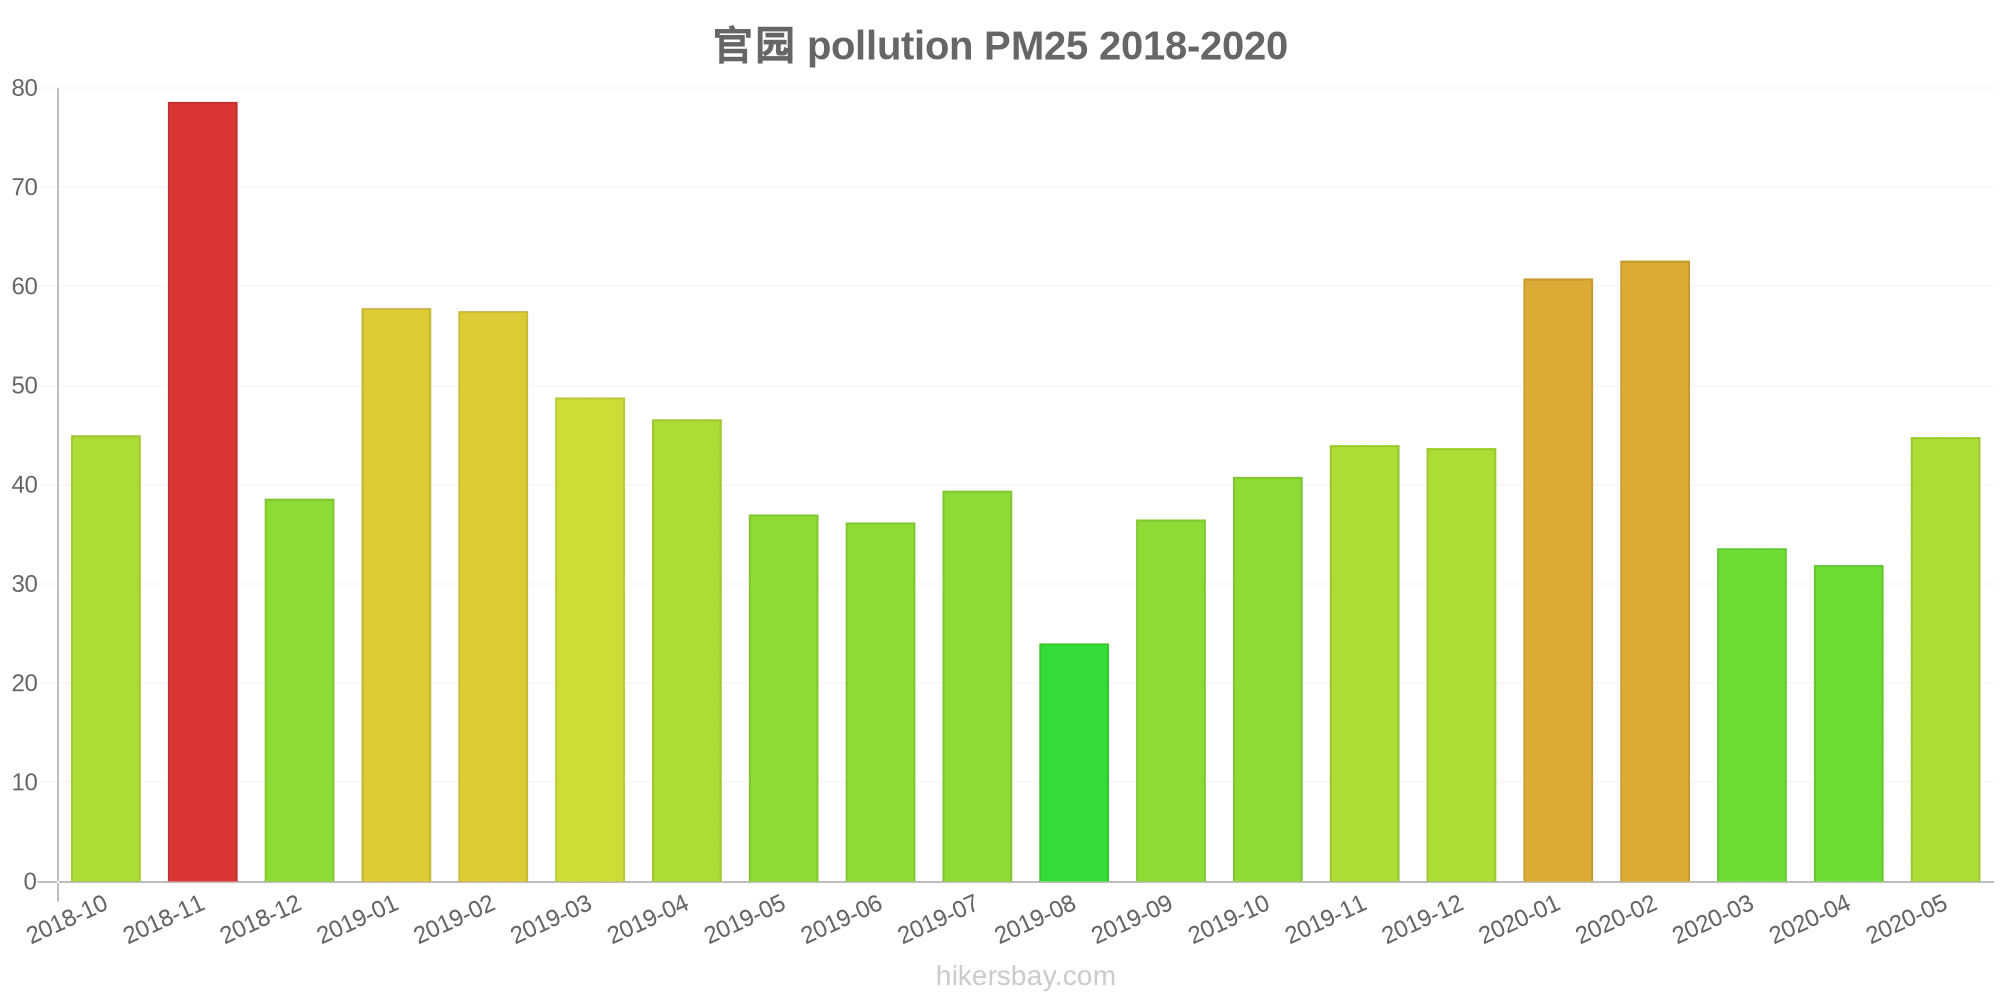
官园
index
2022-05-27
no2
20
pm10
27
o3
39
pm25
20
so2
4.9
co
240
官园
2018-10 2020-05

index
2020-05
2020-04
2020-03
2020-02
2020-01
2019-12
2019-11
2019-10
2019-09
2019-08
2019-07
2019-06
2019-05
2019-04
2019-03
2019-02
2019-01
2018-12
2018-11
2018-10
pm25
45
32
34
63
61
44
44
41
37
24
39
36
37
47
49
58
58
39
79
45
co
649
399
474
928
1
856
797
729
703
593
736
722
532
561
594
809
966
700
1
678
no2
23
24
27
30
44
51
52
45
33
30
31
30
36
36
41
38
57
48
67
56
o3
146
136
98
79
62
47
41
74
180
145
201
219
173
124
103
74
52
47
55
82
pm10
70
63
49
55
68
62
82
69
60
39
54
61
78
86
77
77
88
74
113
75
so2
4.1
4.2
4.7
4.6
7.5
4.1
4.7
3.7
3.3
2.7
2.8
4.3
4.6
4.6
5.6
6.6
9.3
6.6
7.3
4
* Pollution data source:
https://openaq.org
(ChinaAQIData)
The data is licensed under CC-By 4.0
NO2 7 (Good)
PM10 19 (Good)
O3 91 (Moderate)
PM2,5 10 (Good)
SO2 0 (Good)
CO 100 (Good)
Data on air pollution from recent days in Xizhimen
| index | 2022-05-27 |
|---|---|
| no2 | 20 Good |
| pm10 | 27 Moderate |
| o3 | 39 Good |
| pm25 | 20 Moderate |
| so2 | 5 Good |
| co | 240 Good |

| index | 2020-05 | 2020-04 | 2020-03 | 2020-02 | 2020-01 | 2019-12 | 2019-11 | 2019-10 | 2019-09 | 2019-08 | 2019-07 | 2019-06 | 2019-05 | 2019-04 | 2019-03 | 2019-02 | 2019-01 | 2018-12 | 2018-11 | 2018-10 |
|---|---|---|---|---|---|---|---|---|---|---|---|---|---|---|---|---|---|---|---|---|
| pm25 | 45 (Unhealthy for Sensitive Groups) | 32 (Moderate) | 34 (Moderate) | 63 (Unhealthy) | 61 (Unhealthy) | 44 (Unhealthy for Sensitive Groups) | 44 (Unhealthy for Sensitive Groups) | 41 (Unhealthy for Sensitive Groups) | 37 (Unhealthy for Sensitive Groups) | 24 (Moderate) | 39 (Unhealthy for Sensitive Groups) | 36 (Unhealthy for Sensitive Groups) | 37 (Unhealthy for Sensitive Groups) | 47 (Unhealthy for Sensitive Groups) | 49 (Unhealthy for Sensitive Groups) | 58 (Unhealthy) | 58 (Unhealthy) | 39 (Unhealthy for Sensitive Groups) | 79 (Very Unhealthy) | 45 (Unhealthy for Sensitive Groups) |
| co | 649 (Good) | 399 (Good) | 474 (Good) | 928 (Good) | 1 (Good) | 856 (Good) | 797 (Good) | 729 (Good) | 703 (Good) | 593 (Good) | 736 (Good) | 722 (Good) | 532 (Good) | 561 (Good) | 594 (Good) | 809 (Good) | 966 (Good) | 700 (Good) | 1 (Good) | 678 (Good) |
| no2 | 23 (Good) | 24 (Good) | 27 (Good) | 30 (Good) | 44 (Moderate) | 51 (Moderate) | 52 (Moderate) | 45 (Moderate) | 33 (Good) | 30 (Good) | 31 (Good) | 30 (Good) | 36 (Good) | 36 (Good) | 41 (Moderate) | 38 (Good) | 57 (Moderate) | 48 (Moderate) | 67 (Moderate) | 56 (Moderate) |
| o3 | 146 (Unhealthy for Sensitive Groups) | 136 (Unhealthy for Sensitive Groups) | 98 (Moderate) | 79 (Moderate) | 62 (Good) | 47 (Good) | 41 (Good) | 74 (Moderate) | 180 (Very Unhealthy) | 145 (Unhealthy for Sensitive Groups) | 201 (Very Unhealthy) | 219 (Very Unhealthy) | 173 (Unhealthy) | 124 (Unhealthy for Sensitive Groups) | 103 (Moderate) | 74 (Moderate) | 52 (Good) | 47 (Good) | 55 (Good) | 82 (Moderate) |
| pm10 | 70 (Unhealthy for Sensitive Groups) | 63 (Unhealthy for Sensitive Groups) | 49 (Moderate) | 55 (Unhealthy for Sensitive Groups) | 68 (Unhealthy for Sensitive Groups) | 62 (Unhealthy for Sensitive Groups) | 82 (Unhealthy) | 69 (Unhealthy for Sensitive Groups) | 60 (Unhealthy for Sensitive Groups) | 39 (Moderate) | 54 (Unhealthy for Sensitive Groups) | 61 (Unhealthy for Sensitive Groups) | 78 (Unhealthy for Sensitive Groups) | 86 (Unhealthy) | 77 (Unhealthy for Sensitive Groups) | 77 (Unhealthy for Sensitive Groups) | 88 (Unhealthy) | 74 (Unhealthy for Sensitive Groups) | 113 (Very Unhealthy) | 75 (Unhealthy for Sensitive Groups) |
| so2 | 4.1 (Good) | 4.2 (Good) | 4.7 (Good) | 4.6 (Good) | 7.5 (Good) | 4.1 (Good) | 4.7 (Good) | 3.7 (Good) | 3.3 (Good) | 2.7 (Good) | 2.8 (Good) | 4.3 (Good) | 4.6 (Good) | 4.6 (Good) | 5.6 (Good) | 6.6 (Good) | 9.3 (Good) | 6.6 (Good) | 7.3 (Good) | 4 (Good) |
NO2 7.3 (Good)
nitrogen dioxide (NO2)PM10 19 (Good)
particulate matter (PM10) suspended dustO3 91 (Moderate)
ozone (O3)PM2,5 10 (Good)
particulate matter (PM2.5) dustSO2 0.1 (Good)
sulfur dioxide (SO2)CO 100 (Good)
carbon monoxide (CO)官园
| index | 2022-05-27 |
|---|---|
| no2 | 20 |
| pm10 | 27 |
| o3 | 39 |
| pm25 | 20 |
| so2 | 4.9 |
| co | 240 |
官园
| index | 2020-05 | 2020-04 | 2020-03 | 2020-02 | 2020-01 | 2019-12 | 2019-11 | 2019-10 | 2019-09 | 2019-08 | 2019-07 | 2019-06 | 2019-05 | 2019-04 | 2019-03 | 2019-02 | 2019-01 | 2018-12 | 2018-11 | 2018-10 |
|---|---|---|---|---|---|---|---|---|---|---|---|---|---|---|---|---|---|---|---|---|
| pm25 | 45 | 32 | 34 | 63 | 61 | 44 | 44 | 41 | 37 | 24 | 39 | 36 | 37 | 47 | 49 | 58 | 58 | 39 | 79 | 45 |
| co | 649 | 399 | 474 | 928 | 1 | 856 | 797 | 729 | 703 | 593 | 736 | 722 | 532 | 561 | 594 | 809 | 966 | 700 | 1 | 678 |
| no2 | 23 | 24 | 27 | 30 | 44 | 51 | 52 | 45 | 33 | 30 | 31 | 30 | 36 | 36 | 41 | 38 | 57 | 48 | 67 | 56 |
| o3 | 146 | 136 | 98 | 79 | 62 | 47 | 41 | 74 | 180 | 145 | 201 | 219 | 173 | 124 | 103 | 74 | 52 | 47 | 55 | 82 |
| pm10 | 70 | 63 | 49 | 55 | 68 | 62 | 82 | 69 | 60 | 39 | 54 | 61 | 78 | 86 | 77 | 77 | 88 | 74 | 113 | 75 |
| so2 | 4.1 | 4.2 | 4.7 | 4.6 | 7.5 | 4.1 | 4.7 | 3.7 | 3.3 | 2.7 | 2.8 | 4.3 | 4.6 | 4.6 | 5.6 | 6.6 | 9.3 | 6.6 | 7.3 | 4 |