Air Pollution in Menziya: Real-time Air Quality Index and smog alert.
Pollution and air quality forecast for Menziya. Today is Tuesday, June 16, 2026. The following air pollution values have been recorded for Menziya:- particulate matter (PM2.5) dust - 61 (Unhealthy)
- nitrogen dioxide (NO2) - 22 (Good)
- particulate matter (PM10) suspended dust - 69 (Unhealthy for Sensitive Groups)
- carbon monoxide (CO) - 219 (Good)
- ozone (O3) - 0 (Good)
- sulfur dioxide (SO2) - 8 (Good)

What is the air quality in Menziya today? Is the air polluted in Menziya?. Is there smog?
What is the current level of PM2.5 in Menziya? (particulate matter (PM2.5) dust)
Today's PM2.5 level is:
61 (Unhealthy)
For comparison, the highest level of PM2.5 in Menziya in the last 7 days was: 28 (Friday, May 27, 2022) and the lowest: 28 (Friday, May 27, 2022).
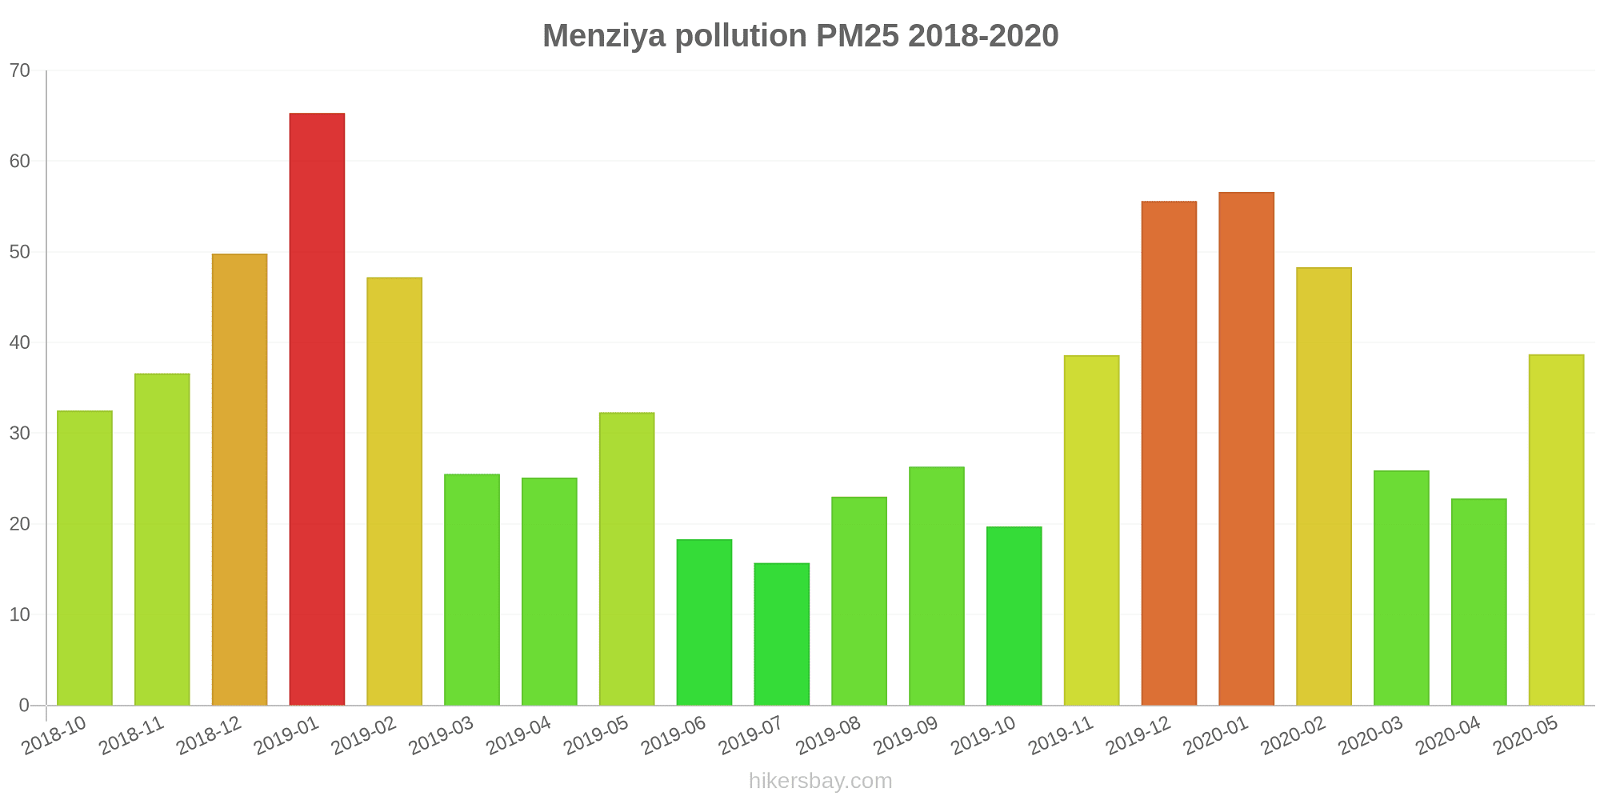
The highest PM2.5 values were recorded: 65 (January 2019).
The lowest level of particulate matter PM2.5 pollution occurs in month: July (16).
How high is the level of NO2? (nitrogen dioxide (NO2))
22 (Good)
What is the level of PM10 today in Menziya? (particulate matter (PM10) suspended dust)
The current level of particulate matter PM10 in Menziya is:
69 (Unhealthy for Sensitive Groups)
The highest PM10 values usually occur in month: 85 (January 2019).
The lowest value of particulate matter PM10 pollution in Menziya is usually recorded in: October (28).
How high is the CO level? (carbon monoxide (CO))
219 (Good)
How is the O3 level today in Menziya? (ozone (O3))
0 (Good)
What is the level of SO2 pollution? (sulfur dioxide (SO2))
8 (Good)
Current data Friday, May 27, 2022, 3:00 PM
PM2,5 61 (Unhealthy)
NO2 22 (Good)
PM10 69 (Unhealthy for Sensitive Groups)
CO 219 (Good)
O3 0 (Good)
SO2 8 (Good)
Data on air pollution from recent days in Menziya
index
2022-05-27
pm25
28
Moderate
no2
22
Good
pm10
35
Moderate
co
579
Good
o3
22
Good
so2
5
Good
data source »
Air pollution in Menziya from October 2018 to May 2020
index
2020-05
2020-04
2020-03
2020-02
2020-01
2019-12
2019-11
2019-10
2019-09
2019-08
2019-07
2019-06
2019-05
2019-04
2019-03
2019-02
2019-01
2018-12
2018-11
2018-10
pm25
39 (Unhealthy for Sensitive Groups)
23 (Moderate)
26 (Moderate)
48 (Unhealthy for Sensitive Groups)
57 (Unhealthy)
56 (Unhealthy)
39 (Unhealthy for Sensitive Groups)
20 (Moderate)
26 (Moderate)
23 (Moderate)
16 (Moderate)
18 (Moderate)
32 (Moderate)
25 (Moderate)
26 (Moderate)
47 (Unhealthy for Sensitive Groups)
65 (Unhealthy)
50 (Unhealthy for Sensitive Groups)
37 (Unhealthy for Sensitive Groups)
33 (Moderate)
co
578 (Good)
512 (Good)
553 (Good)
734 (Good)
926 (Good)
735 (Good)
608 (Good)
540 (Good)
576 (Good)
558 (Good)
549 (Good)
568 (Good)
491 (Good)
546 (Good)
652 (Good)
630 (Good)
783 (Good)
566 (Good)
403 (Good)
476 (Good)
no2
28 (Good)
23 (Good)
22 (Good)
13 (Good)
25 (Good)
30 (Good)
24 (Good)
15 (Good)
18 (Good)
20 (Good)
14 (Good)
15 (Good)
18 (Good)
24 (Good)
28 (Good)
26 (Good)
37 (Good)
26 (Good)
26 (Good)
22 (Good)
o3
152 (Unhealthy)
124 (Unhealthy for Sensitive Groups)
108 (Moderate)
81 (Moderate)
66 (Good)
52 (Good)
55 (Good)
79 (Moderate)
104 (Moderate)
150 (Unhealthy)
105 (Moderate)
117 (Moderate)
120 (Unhealthy for Sensitive Groups)
130 (Unhealthy for Sensitive Groups)
98 (Moderate)
78 (Moderate)
64 (Good)
47 (Good)
66 (Good)
79 (Moderate)
pm10
83 (Unhealthy)
48 (Moderate)
59 (Unhealthy for Sensitive Groups)
62 (Unhealthy for Sensitive Groups)
79 (Unhealthy for Sensitive Groups)
79 (Unhealthy for Sensitive Groups)
60 (Unhealthy for Sensitive Groups)
28 (Moderate)
40 (Moderate)
55 (Unhealthy for Sensitive Groups)
32 (Moderate)
37 (Moderate)
56 (Unhealthy for Sensitive Groups)
56 (Unhealthy for Sensitive Groups)
50 (Unhealthy for Sensitive Groups)
60 (Unhealthy for Sensitive Groups)
85 (Unhealthy)
68 (Unhealthy for Sensitive Groups)
53 (Unhealthy for Sensitive Groups)
52 (Unhealthy for Sensitive Groups)
so2
9.9 (Good)
8.6 (Good)
7.2 (Good)
9.1 (Good)
9.4 (Good)
9.4 (Good)
7.8 (Good)
7.2 (Good)
10 (Good)
9.1 (Good)
8.1 (Good)
8.7 (Good)
9.2 (Good)
11 (Good)
9.8 (Good)
12 (Good)
11 (Good)
9.9 (Good)
11 (Good)
10 (Good)
data source »
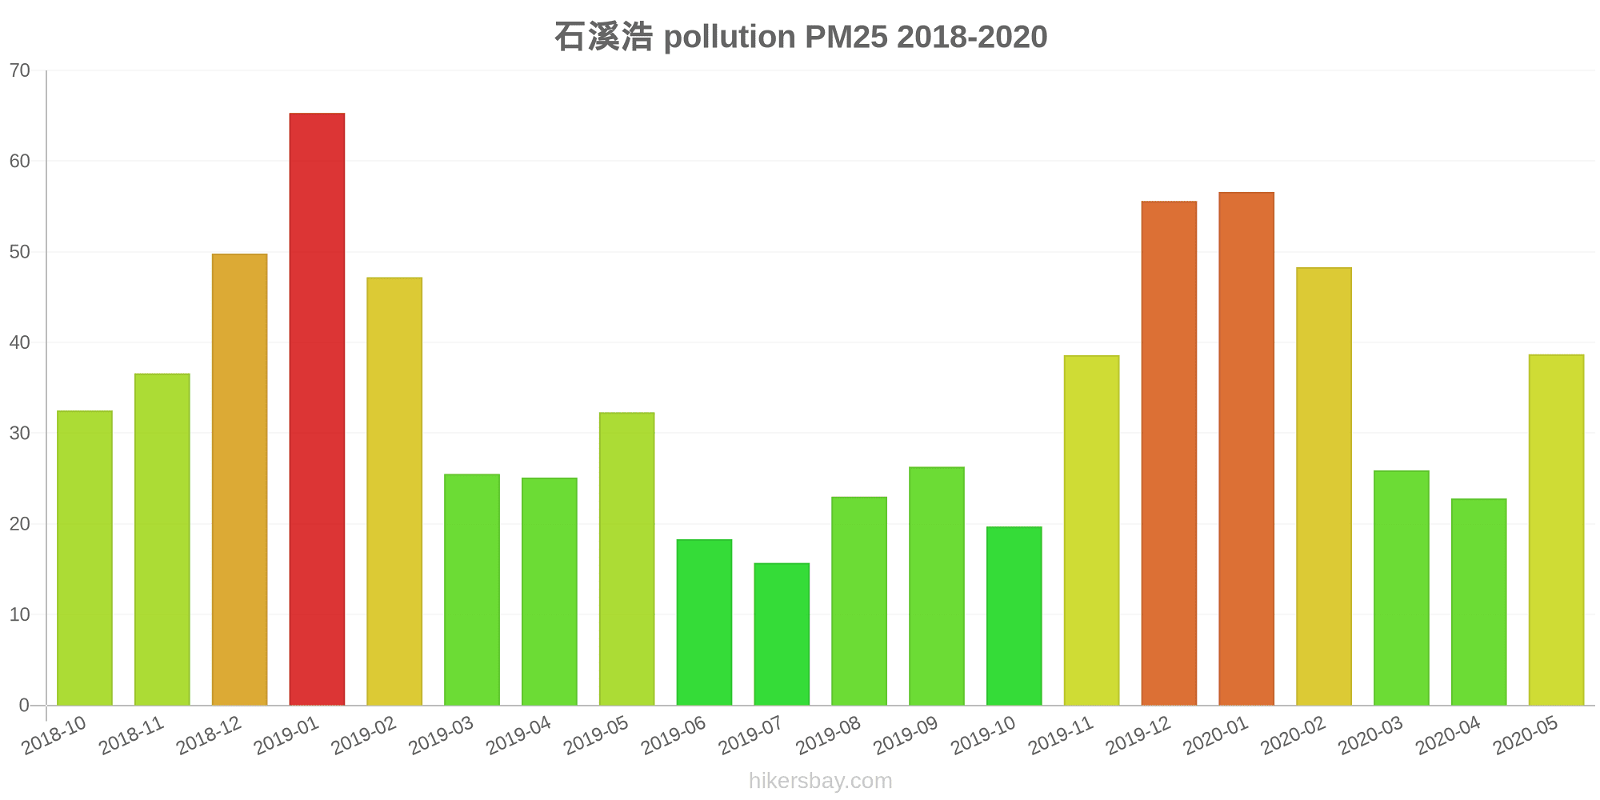
石溪浩
Friday, May 27, 2022, 3:00 PM
PM2,5 61 (Unhealthy)
particulate matter (PM2.5) dust
NO2 22 (Good)
nitrogen dioxide (NO2)
PM10 69 (Unhealthy for Sensitive Groups)
particulate matter (PM10) suspended dust
CO 219 (Good)
carbon monoxide (CO)
O3 0.05 (Good)
ozone (O3)
SO2 7.7 (Good)
sulfur dioxide (SO2)
石溪浩
index
2022-05-27
pm25
28
no2
22
pm10
35
co
579
o3
22
so2
4.6
石溪浩
2018-10 2020-05
index
2020-05
2020-04
2020-03
2020-02
2020-01
2019-12
2019-11
2019-10
2019-09
2019-08
2019-07
2019-06
2019-05
2019-04
2019-03
2019-02
2019-01
2018-12
2018-11
2018-10
pm25
39
23
26
48
57
56
39
20
26
23
16
18
32
25
26
47
65
50
37
33
co
578
512
553
734
926
735
608
540
576
558
549
568
491
546
652
630
783
566
403
476
no2
28
23
22
13
25
30
24
15
18
20
14
15
18
24
28
26
37
26
26
22
o3
152
124
108
81
66
52
55
79
104
150
105
117
120
130
98
78
64
47
66
79
pm10
83
48
59
62
79
79
60
28
40
55
32
37
56
56
50
60
85
68
53
52
so2
9.9
8.6
7.2
9.1
9.4
9.4
7.8
7.2
10
9.1
8.1
8.7
9.2
11
9.8
12
11
9.9
11
10
* Pollution data source:
https://openaq.org
(ChinaAQIData)
The data is licensed under CC-By 4.0
PM2,5 61 (Unhealthy)
NO2 22 (Good)
PM10 69 (Unhealthy for Sensitive Groups)
CO 219 (Good)
O3 0 (Good)
SO2 8 (Good)
Data on air pollution from recent days in Menziya
| index | 2022-05-27 |
|---|---|
| pm25 | 28 Moderate |
| no2 | 22 Good |
| pm10 | 35 Moderate |
| co | 579 Good |
| o3 | 22 Good |
| so2 | 5 Good |

| index | 2020-05 | 2020-04 | 2020-03 | 2020-02 | 2020-01 | 2019-12 | 2019-11 | 2019-10 | 2019-09 | 2019-08 | 2019-07 | 2019-06 | 2019-05 | 2019-04 | 2019-03 | 2019-02 | 2019-01 | 2018-12 | 2018-11 | 2018-10 |
|---|---|---|---|---|---|---|---|---|---|---|---|---|---|---|---|---|---|---|---|---|
| pm25 | 39 (Unhealthy for Sensitive Groups) | 23 (Moderate) | 26 (Moderate) | 48 (Unhealthy for Sensitive Groups) | 57 (Unhealthy) | 56 (Unhealthy) | 39 (Unhealthy for Sensitive Groups) | 20 (Moderate) | 26 (Moderate) | 23 (Moderate) | 16 (Moderate) | 18 (Moderate) | 32 (Moderate) | 25 (Moderate) | 26 (Moderate) | 47 (Unhealthy for Sensitive Groups) | 65 (Unhealthy) | 50 (Unhealthy for Sensitive Groups) | 37 (Unhealthy for Sensitive Groups) | 33 (Moderate) |
| co | 578 (Good) | 512 (Good) | 553 (Good) | 734 (Good) | 926 (Good) | 735 (Good) | 608 (Good) | 540 (Good) | 576 (Good) | 558 (Good) | 549 (Good) | 568 (Good) | 491 (Good) | 546 (Good) | 652 (Good) | 630 (Good) | 783 (Good) | 566 (Good) | 403 (Good) | 476 (Good) |
| no2 | 28 (Good) | 23 (Good) | 22 (Good) | 13 (Good) | 25 (Good) | 30 (Good) | 24 (Good) | 15 (Good) | 18 (Good) | 20 (Good) | 14 (Good) | 15 (Good) | 18 (Good) | 24 (Good) | 28 (Good) | 26 (Good) | 37 (Good) | 26 (Good) | 26 (Good) | 22 (Good) |
| o3 | 152 (Unhealthy) | 124 (Unhealthy for Sensitive Groups) | 108 (Moderate) | 81 (Moderate) | 66 (Good) | 52 (Good) | 55 (Good) | 79 (Moderate) | 104 (Moderate) | 150 (Unhealthy) | 105 (Moderate) | 117 (Moderate) | 120 (Unhealthy for Sensitive Groups) | 130 (Unhealthy for Sensitive Groups) | 98 (Moderate) | 78 (Moderate) | 64 (Good) | 47 (Good) | 66 (Good) | 79 (Moderate) |
| pm10 | 83 (Unhealthy) | 48 (Moderate) | 59 (Unhealthy for Sensitive Groups) | 62 (Unhealthy for Sensitive Groups) | 79 (Unhealthy for Sensitive Groups) | 79 (Unhealthy for Sensitive Groups) | 60 (Unhealthy for Sensitive Groups) | 28 (Moderate) | 40 (Moderate) | 55 (Unhealthy for Sensitive Groups) | 32 (Moderate) | 37 (Moderate) | 56 (Unhealthy for Sensitive Groups) | 56 (Unhealthy for Sensitive Groups) | 50 (Unhealthy for Sensitive Groups) | 60 (Unhealthy for Sensitive Groups) | 85 (Unhealthy) | 68 (Unhealthy for Sensitive Groups) | 53 (Unhealthy for Sensitive Groups) | 52 (Unhealthy for Sensitive Groups) |
| so2 | 9.9 (Good) | 8.6 (Good) | 7.2 (Good) | 9.1 (Good) | 9.4 (Good) | 9.4 (Good) | 7.8 (Good) | 7.2 (Good) | 10 (Good) | 9.1 (Good) | 8.1 (Good) | 8.7 (Good) | 9.2 (Good) | 11 (Good) | 9.8 (Good) | 12 (Good) | 11 (Good) | 9.9 (Good) | 11 (Good) | 10 (Good) |
PM2,5 61 (Unhealthy)
particulate matter (PM2.5) dustNO2 22 (Good)
nitrogen dioxide (NO2)PM10 69 (Unhealthy for Sensitive Groups)
particulate matter (PM10) suspended dustCO 219 (Good)
carbon monoxide (CO)O3 0.05 (Good)
ozone (O3)SO2 7.7 (Good)
sulfur dioxide (SO2)石溪浩
| index | 2022-05-27 |
|---|---|
| pm25 | 28 |
| no2 | 22 |
| pm10 | 35 |
| co | 579 |
| o3 | 22 |
| so2 | 4.6 |
石溪浩

| index | 2020-05 | 2020-04 | 2020-03 | 2020-02 | 2020-01 | 2019-12 | 2019-11 | 2019-10 | 2019-09 | 2019-08 | 2019-07 | 2019-06 | 2019-05 | 2019-04 | 2019-03 | 2019-02 | 2019-01 | 2018-12 | 2018-11 | 2018-10 |
|---|---|---|---|---|---|---|---|---|---|---|---|---|---|---|---|---|---|---|---|---|
| pm25 | 39 | 23 | 26 | 48 | 57 | 56 | 39 | 20 | 26 | 23 | 16 | 18 | 32 | 25 | 26 | 47 | 65 | 50 | 37 | 33 |
| co | 578 | 512 | 553 | 734 | 926 | 735 | 608 | 540 | 576 | 558 | 549 | 568 | 491 | 546 | 652 | 630 | 783 | 566 | 403 | 476 |
| no2 | 28 | 23 | 22 | 13 | 25 | 30 | 24 | 15 | 18 | 20 | 14 | 15 | 18 | 24 | 28 | 26 | 37 | 26 | 26 | 22 |
| o3 | 152 | 124 | 108 | 81 | 66 | 52 | 55 | 79 | 104 | 150 | 105 | 117 | 120 | 130 | 98 | 78 | 64 | 47 | 66 | 79 |
| pm10 | 83 | 48 | 59 | 62 | 79 | 79 | 60 | 28 | 40 | 55 | 32 | 37 | 56 | 56 | 50 | 60 | 85 | 68 | 53 | 52 |
| so2 | 9.9 | 8.6 | 7.2 | 9.1 | 9.4 | 9.4 | 7.8 | 7.2 | 10 | 9.1 | 8.1 | 8.7 | 9.2 | 11 | 9.8 | 12 | 11 | 9.9 | 11 | 10 |