Air Pollution in Minzhengsi: Real-time Air Quality Index and smog alert.
Pollution and air quality forecast for Minzhengsi. Today is Tuesday, June 16, 2026. The following air pollution values have been recorded for Minzhengsi:- particulate matter (PM2.5) dust - 61 (Unhealthy)
- nitrogen dioxide (NO2) - 22 (Good)
- particulate matter (PM10) suspended dust - 69 (Unhealthy for Sensitive Groups)
- carbon monoxide (CO) - 219 (Good)
- ozone (O3) - 0 (Good)
- sulfur dioxide (SO2) - 8 (Good)

What is the air quality in Minzhengsi today? Is the air polluted in Minzhengsi?. Is there smog?
What is the current level of PM2.5 in Minzhengsi? (particulate matter (PM2.5) dust)
Today's PM2.5 level is:
61 (Unhealthy)
For comparison, the highest level of PM2.5 in Minzhengsi in the last 7 days was: 28 (Friday, May 27, 2022) and the lowest: 28 (Friday, May 27, 2022).
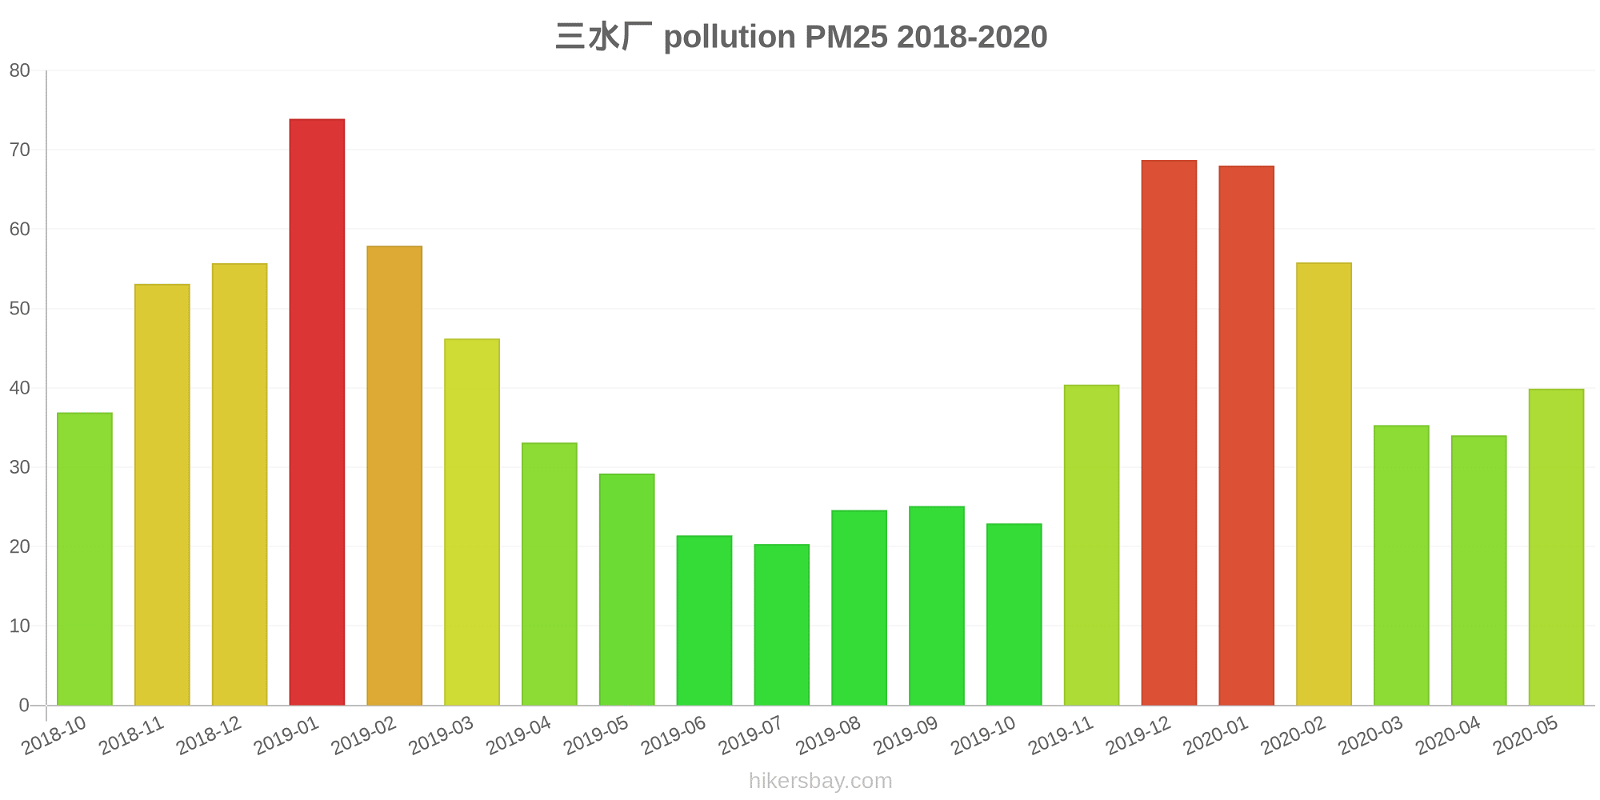
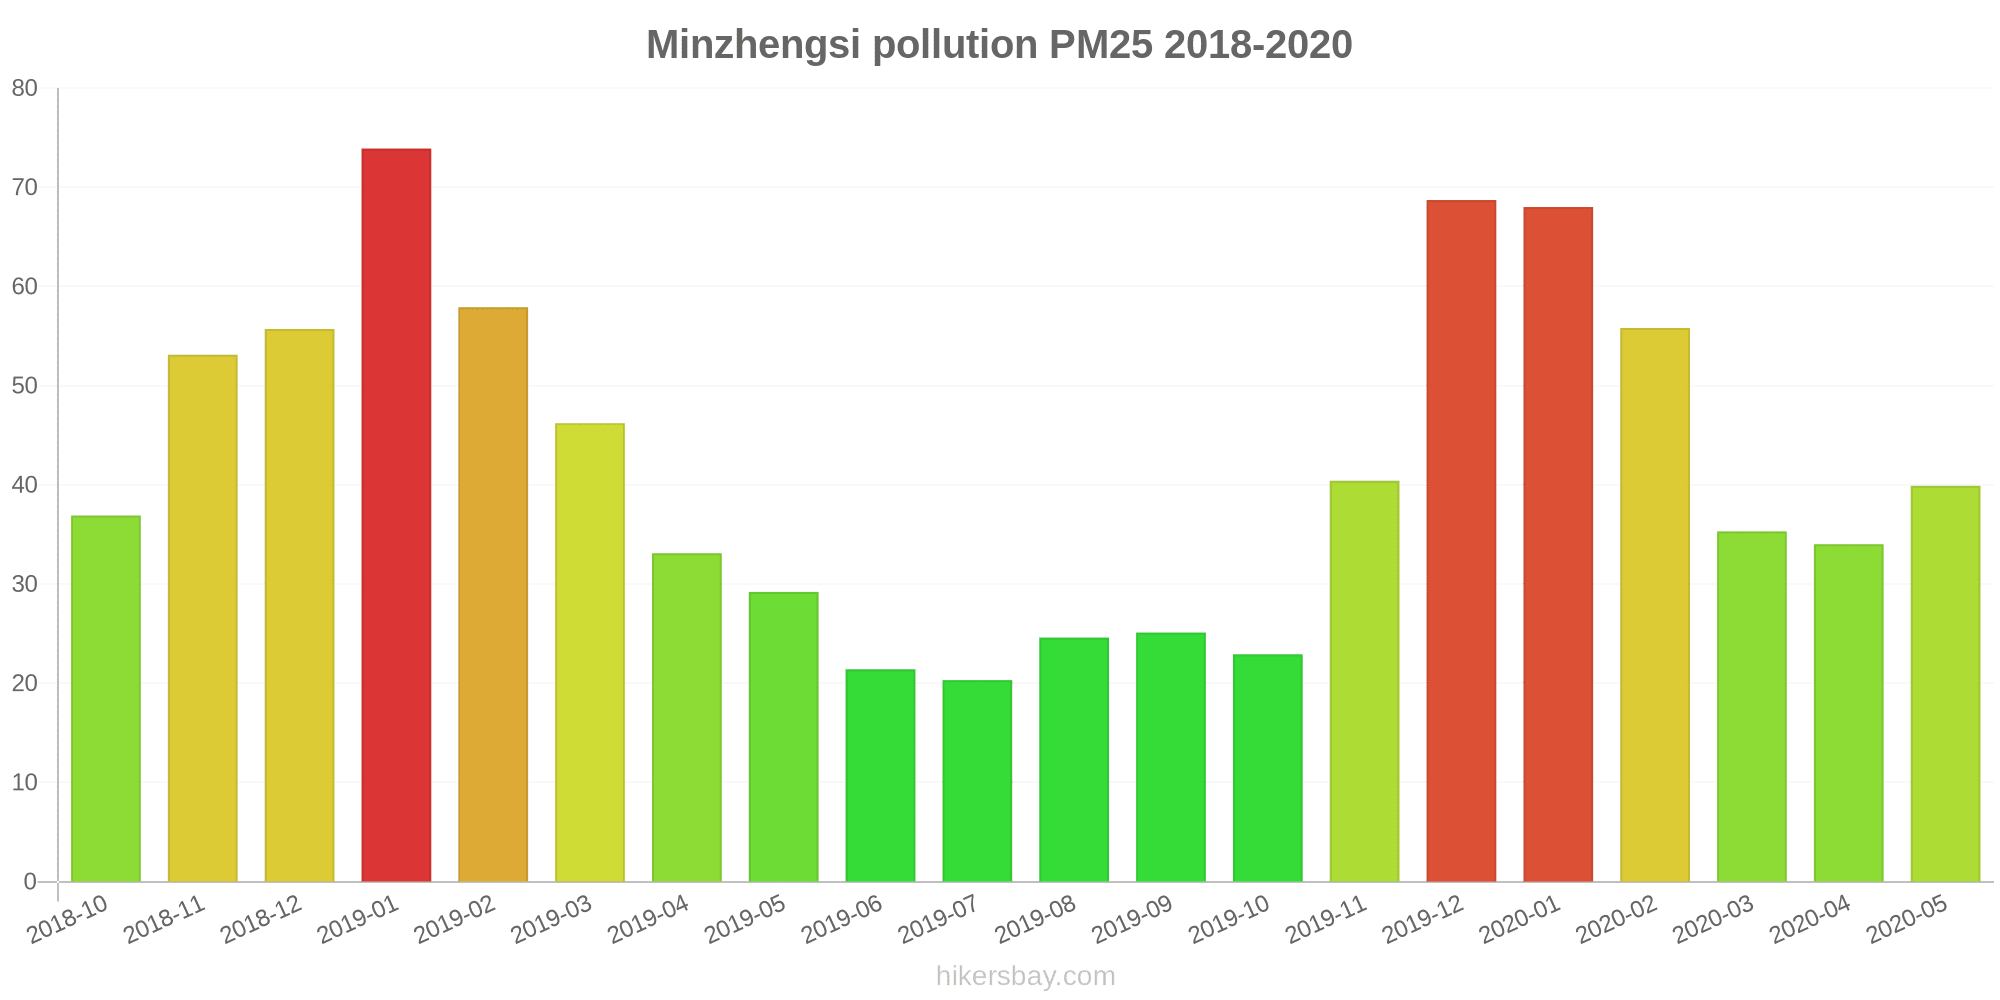
The highest PM2.5 values were recorded: 74 (January 2019).
The lowest level of particulate matter PM2.5 pollution occurs in month: July (20).
How high is the level of NO2? (nitrogen dioxide (NO2))
22 (Good)
What is the level of PM10 today in Minzhengsi? (particulate matter (PM10) suspended dust)
The current level of particulate matter PM10 in Minzhengsi is:
69 (Unhealthy for Sensitive Groups)
The highest PM10 values usually occur in month: 118 (January 2019).
The lowest value of particulate matter PM10 pollution in Minzhengsi is usually recorded in: October (39).
How high is the CO level? (carbon monoxide (CO))
219 (Good)
How is the O3 level today in Minzhengsi? (ozone (O3))
0 (Good)
What is the level of SO2 pollution? (sulfur dioxide (SO2))
8 (Good)
Current data Friday, May 27, 2022, 3:00 PM
PM2,5 61 (Unhealthy)
NO2 22 (Good)
PM10 69 (Unhealthy for Sensitive Groups)
CO 219 (Good)
O3 0 (Good)
SO2 8 (Good)
Data on air pollution from recent days in Minzhengsi
index
2022-05-27
pm25
28
Moderate
no2
22
Good
pm10
35
Moderate
co
579
Good
o3
22
Good
so2
5
Good
data source »
Air pollution in Minzhengsi from October 2018 to May 2020

index
2020-05
2020-04
2020-03
2020-02
2020-01
2019-12
2019-11
2019-10
2019-09
2019-08
2019-07
2019-06
2019-05
2019-04
2019-03
2019-02
2019-01
2018-12
2018-11
2018-10
pm25
40 (Unhealthy for Sensitive Groups)
34 (Moderate)
35 (Unhealthy for Sensitive Groups)
56 (Unhealthy)
68 (Unhealthy)
69 (Unhealthy)
40 (Unhealthy for Sensitive Groups)
23 (Moderate)
25 (Moderate)
25 (Moderate)
20 (Moderate)
21 (Moderate)
29 (Moderate)
33 (Moderate)
46 (Unhealthy for Sensitive Groups)
58 (Unhealthy)
74 (Unhealthy)
56 (Unhealthy)
53 (Unhealthy for Sensitive Groups)
37 (Unhealthy for Sensitive Groups)
co
652 (Good)
577 (Good)
491 (Good)
834 (Good)
1 (Good)
984 (Good)
750 (Good)
805 (Good)
723 (Good)
712 (Good)
674 (Good)
574 (Good)
487 (Good)
579 (Good)
706 (Good)
845 (Good)
1 (Good)
759 (Good)
697 (Good)
690 (Good)
no2
38 (Good)
33 (Good)
36 (Good)
26 (Good)
33 (Good)
37 (Good)
35 (Good)
26 (Good)
28 (Good)
30 (Good)
27 (Good)
26 (Good)
25 (Good)
35 (Good)
39 (Good)
31 (Good)
44 (Moderate)
31 (Good)
33 (Good)
31 (Good)
o3
165 (Unhealthy)
133 (Unhealthy for Sensitive Groups)
106 (Moderate)
88 (Moderate)
71 (Moderate)
59 (Good)
68 (Good)
76 (Moderate)
94 (Moderate)
136 (Unhealthy for Sensitive Groups)
112 (Moderate)
132 (Unhealthy for Sensitive Groups)
120 (Unhealthy for Sensitive Groups)
131 (Unhealthy for Sensitive Groups)
105 (Moderate)
83 (Moderate)
65 (Good)
55 (Good)
66 (Good)
79 (Moderate)
pm10
83 (Unhealthy)
66 (Unhealthy for Sensitive Groups)
73 (Unhealthy for Sensitive Groups)
80 (Unhealthy for Sensitive Groups)
94 (Unhealthy)
105 (Unhealthy)
68 (Unhealthy for Sensitive Groups)
39 (Moderate)
41 (Moderate)
48 (Moderate)
39 (Moderate)
44 (Moderate)
55 (Unhealthy for Sensitive Groups)
65 (Unhealthy for Sensitive Groups)
79 (Unhealthy for Sensitive Groups)
88 (Unhealthy)
118 (Very Unhealthy)
92 (Unhealthy)
83 (Unhealthy)
67 (Unhealthy for Sensitive Groups)
so2
6.3 (Good)
5.7 (Good)
6.6 (Good)
4.7 (Good)
5.8 (Good)
6.8 (Good)
5.4 (Good)
4.8 (Good)
4.7 (Good)
5.3 (Good)
4.6 (Good)
4.8 (Good)
4.6 (Good)
5.1 (Good)
6.1 (Good)
5.4 (Good)
7.3 (Good)
6 (Good)
6.1 (Good)
5.5 (Good)
data source »
三水厂
Friday, May 27, 2022, 3:00 PM
PM2,5 61 (Unhealthy)
particulate matter (PM2.5) dust
NO2 22 (Good)
nitrogen dioxide (NO2)
PM10 69 (Unhealthy for Sensitive Groups)
particulate matter (PM10) suspended dust
CO 219 (Good)
carbon monoxide (CO)
O3 0.05 (Good)
ozone (O3)
SO2 7.7 (Good)
sulfur dioxide (SO2)
三水厂
index
2022-05-27
pm25
28
no2
22
pm10
35
co
579
o3
22
so2
4.6
三水厂
2018-10 2020-05
index
2020-05
2020-04
2020-03
2020-02
2020-01
2019-12
2019-11
2019-10
2019-09
2019-08
2019-07
2019-06
2019-05
2019-04
2019-03
2019-02
2019-01
2018-12
2018-11
2018-10
pm25
40
34
35
56
68
69
40
23
25
25
20
21
29
33
46
58
74
56
53
37
co
652
577
491
834
1
984
750
805
723
712
674
574
487
579
706
845
1
759
697
690
no2
38
33
36
26
33
37
35
26
28
30
27
26
25
35
39
31
44
31
33
31
o3
165
133
106
88
71
59
68
76
94
136
112
132
120
131
105
83
65
55
66
79
pm10
83
66
73
80
94
105
68
39
41
48
39
44
55
65
79
88
118
92
83
67
so2
6.3
5.7
6.6
4.7
5.8
6.8
5.4
4.8
4.7
5.3
4.6
4.8
4.6
5.1
6.1
5.4
7.3
6
6.1
5.5
* Pollution data source:
https://openaq.org
(ChinaAQIData)
The data is licensed under CC-By 4.0
PM2,5 61 (Unhealthy)
NO2 22 (Good)
PM10 69 (Unhealthy for Sensitive Groups)
CO 219 (Good)
O3 0 (Good)
SO2 8 (Good)
Data on air pollution from recent days in Minzhengsi
| index | 2022-05-27 |
|---|---|
| pm25 | 28 Moderate |
| no2 | 22 Good |
| pm10 | 35 Moderate |
| co | 579 Good |
| o3 | 22 Good |
| so2 | 5 Good |
| index | 2020-05 | 2020-04 | 2020-03 | 2020-02 | 2020-01 | 2019-12 | 2019-11 | 2019-10 | 2019-09 | 2019-08 | 2019-07 | 2019-06 | 2019-05 | 2019-04 | 2019-03 | 2019-02 | 2019-01 | 2018-12 | 2018-11 | 2018-10 |
|---|---|---|---|---|---|---|---|---|---|---|---|---|---|---|---|---|---|---|---|---|
| pm25 | 40 (Unhealthy for Sensitive Groups) | 34 (Moderate) | 35 (Unhealthy for Sensitive Groups) | 56 (Unhealthy) | 68 (Unhealthy) | 69 (Unhealthy) | 40 (Unhealthy for Sensitive Groups) | 23 (Moderate) | 25 (Moderate) | 25 (Moderate) | 20 (Moderate) | 21 (Moderate) | 29 (Moderate) | 33 (Moderate) | 46 (Unhealthy for Sensitive Groups) | 58 (Unhealthy) | 74 (Unhealthy) | 56 (Unhealthy) | 53 (Unhealthy for Sensitive Groups) | 37 (Unhealthy for Sensitive Groups) |
| co | 652 (Good) | 577 (Good) | 491 (Good) | 834 (Good) | 1 (Good) | 984 (Good) | 750 (Good) | 805 (Good) | 723 (Good) | 712 (Good) | 674 (Good) | 574 (Good) | 487 (Good) | 579 (Good) | 706 (Good) | 845 (Good) | 1 (Good) | 759 (Good) | 697 (Good) | 690 (Good) |
| no2 | 38 (Good) | 33 (Good) | 36 (Good) | 26 (Good) | 33 (Good) | 37 (Good) | 35 (Good) | 26 (Good) | 28 (Good) | 30 (Good) | 27 (Good) | 26 (Good) | 25 (Good) | 35 (Good) | 39 (Good) | 31 (Good) | 44 (Moderate) | 31 (Good) | 33 (Good) | 31 (Good) |
| o3 | 165 (Unhealthy) | 133 (Unhealthy for Sensitive Groups) | 106 (Moderate) | 88 (Moderate) | 71 (Moderate) | 59 (Good) | 68 (Good) | 76 (Moderate) | 94 (Moderate) | 136 (Unhealthy for Sensitive Groups) | 112 (Moderate) | 132 (Unhealthy for Sensitive Groups) | 120 (Unhealthy for Sensitive Groups) | 131 (Unhealthy for Sensitive Groups) | 105 (Moderate) | 83 (Moderate) | 65 (Good) | 55 (Good) | 66 (Good) | 79 (Moderate) |
| pm10 | 83 (Unhealthy) | 66 (Unhealthy for Sensitive Groups) | 73 (Unhealthy for Sensitive Groups) | 80 (Unhealthy for Sensitive Groups) | 94 (Unhealthy) | 105 (Unhealthy) | 68 (Unhealthy for Sensitive Groups) | 39 (Moderate) | 41 (Moderate) | 48 (Moderate) | 39 (Moderate) | 44 (Moderate) | 55 (Unhealthy for Sensitive Groups) | 65 (Unhealthy for Sensitive Groups) | 79 (Unhealthy for Sensitive Groups) | 88 (Unhealthy) | 118 (Very Unhealthy) | 92 (Unhealthy) | 83 (Unhealthy) | 67 (Unhealthy for Sensitive Groups) |
| so2 | 6.3 (Good) | 5.7 (Good) | 6.6 (Good) | 4.7 (Good) | 5.8 (Good) | 6.8 (Good) | 5.4 (Good) | 4.8 (Good) | 4.7 (Good) | 5.3 (Good) | 4.6 (Good) | 4.8 (Good) | 4.6 (Good) | 5.1 (Good) | 6.1 (Good) | 5.4 (Good) | 7.3 (Good) | 6 (Good) | 6.1 (Good) | 5.5 (Good) |
PM2,5 61 (Unhealthy)
particulate matter (PM2.5) dustNO2 22 (Good)
nitrogen dioxide (NO2)PM10 69 (Unhealthy for Sensitive Groups)
particulate matter (PM10) suspended dustCO 219 (Good)
carbon monoxide (CO)O3 0.05 (Good)
ozone (O3)SO2 7.7 (Good)
sulfur dioxide (SO2)三水厂
| index | 2022-05-27 |
|---|---|
| pm25 | 28 |
| no2 | 22 |
| pm10 | 35 |
| co | 579 |
| o3 | 22 |
| so2 | 4.6 |
三水厂

| index | 2020-05 | 2020-04 | 2020-03 | 2020-02 | 2020-01 | 2019-12 | 2019-11 | 2019-10 | 2019-09 | 2019-08 | 2019-07 | 2019-06 | 2019-05 | 2019-04 | 2019-03 | 2019-02 | 2019-01 | 2018-12 | 2018-11 | 2018-10 |
|---|---|---|---|---|---|---|---|---|---|---|---|---|---|---|---|---|---|---|---|---|
| pm25 | 40 | 34 | 35 | 56 | 68 | 69 | 40 | 23 | 25 | 25 | 20 | 21 | 29 | 33 | 46 | 58 | 74 | 56 | 53 | 37 |
| co | 652 | 577 | 491 | 834 | 1 | 984 | 750 | 805 | 723 | 712 | 674 | 574 | 487 | 579 | 706 | 845 | 1 | 759 | 697 | 690 |
| no2 | 38 | 33 | 36 | 26 | 33 | 37 | 35 | 26 | 28 | 30 | 27 | 26 | 25 | 35 | 39 | 31 | 44 | 31 | 33 | 31 |
| o3 | 165 | 133 | 106 | 88 | 71 | 59 | 68 | 76 | 94 | 136 | 112 | 132 | 120 | 131 | 105 | 83 | 65 | 55 | 66 | 79 |
| pm10 | 83 | 66 | 73 | 80 | 94 | 105 | 68 | 39 | 41 | 48 | 39 | 44 | 55 | 65 | 79 | 88 | 118 | 92 | 83 | 67 |
| so2 | 6.3 | 5.7 | 6.6 | 4.7 | 5.8 | 6.8 | 5.4 | 4.8 | 4.7 | 5.3 | 4.6 | 4.8 | 4.6 | 5.1 | 6.1 | 5.4 | 7.3 | 6 | 6.1 | 5.5 |