Air Pollution in Qileya: Real-time Air Quality Index and smog alert.
Pollution and air quality forecast for Qileya. Today is Tuesday, June 16, 2026. The following air pollution values have been recorded for Qileya:- particulate matter (PM2.5) dust - 61 (Unhealthy)
- nitrogen dioxide (NO2) - 22 (Good)
- particulate matter (PM10) suspended dust - 69 (Unhealthy for Sensitive Groups)
- carbon monoxide (CO) - 219 (Good)
- ozone (O3) - 0 (Good)
- sulfur dioxide (SO2) - 8 (Good)

What is the air quality in Qileya today? Is the air polluted in Qileya?. Is there smog?
What is the current level of PM2.5 in Qileya? (particulate matter (PM2.5) dust)
Today's PM2.5 level is:
61 (Unhealthy)
For comparison, the highest level of PM2.5 in Qileya in the last 7 days was: 28 (Friday, May 27, 2022) and the lowest: 28 (Friday, May 27, 2022).
The highest PM2.5 values were recorded: 82 (January 2019).
The lowest level of particulate matter PM2.5 pollution occurs in month: October (17).
How high is the level of NO2? (nitrogen dioxide (NO2))
22 (Good)
What is the level of PM10 today in Qileya? (particulate matter (PM10) suspended dust)
The current level of particulate matter PM10 in Qileya is:
69 (Unhealthy for Sensitive Groups)
The highest PM10 values usually occur in month: 97 (January 2019).
The lowest value of particulate matter PM10 pollution in Qileya is usually recorded in: October (26).
How high is the CO level? (carbon monoxide (CO))
219 (Good)
How is the O3 level today in Qileya? (ozone (O3))
0 (Good)
What is the level of SO2 pollution? (sulfur dioxide (SO2))
8 (Good)
Current data Friday, May 27, 2022, 3:00 PM
PM2,5 61 (Unhealthy)
NO2 22 (Good)
PM10 69 (Unhealthy for Sensitive Groups)
CO 219 (Good)
O3 0 (Good)
SO2 8 (Good)
Data on air pollution from recent days in Qileya
index
2022-05-27
pm25
28
Moderate
no2
22
Good
pm10
35
Moderate
co
579
Good
o3
22
Good
so2
5
Good
data source »
Air pollution in Qileya from October 2018 to May 2020

index
2020-05
2020-04
2020-03
2020-02
2020-01
2019-12
2019-11
2019-10
2019-09
2019-08
2019-07
2019-06
2019-05
2019-04
2019-03
2019-02
2019-01
2018-12
2018-11
2018-10
pm25
43 (Unhealthy for Sensitive Groups)
33 (Moderate)
33 (Moderate)
48 (Unhealthy for Sensitive Groups)
48 (Unhealthy for Sensitive Groups)
58 (Unhealthy)
33 (Moderate)
17 (Moderate)
26 (Moderate)
27 (Moderate)
23 (Moderate)
26 (Moderate)
46 (Unhealthy for Sensitive Groups)
39 (Unhealthy for Sensitive Groups)
47 (Unhealthy for Sensitive Groups)
64 (Unhealthy)
82 (Very Unhealthy)
63 (Unhealthy)
43 (Unhealthy for Sensitive Groups)
41 (Unhealthy for Sensitive Groups)
co
732 (Good)
629 (Good)
584 (Good)
762 (Good)
919 (Good)
742 (Good)
711 (Good)
790 (Good)
876 (Good)
682 (Good)
661 (Good)
870 (Good)
815 (Good)
807 (Good)
762 (Good)
989 (Good)
1 (Good)
981 (Good)
759 (Good)
853 (Good)
no2
16 (Good)
15 (Good)
14 (Good)
16 (Good)
21 (Good)
23 (Good)
22 (Good)
19 (Good)
14 (Good)
22 (Good)
21 (Good)
19 (Good)
13 (Good)
13 (Good)
15 (Good)
14 (Good)
25 (Good)
16 (Good)
15 (Good)
21 (Good)
o3
165 (Unhealthy)
129 (Unhealthy for Sensitive Groups)
113 (Moderate)
73 (Moderate)
67 (Good)
75 (Moderate)
64 (Good)
72 (Moderate)
98 (Moderate)
134 (Unhealthy for Sensitive Groups)
102 (Moderate)
121 (Unhealthy for Sensitive Groups)
130 (Unhealthy for Sensitive Groups)
126 (Unhealthy for Sensitive Groups)
98 (Moderate)
79 (Moderate)
50 (Good)
60 (Good)
79 (Moderate)
71 (Moderate)
pm10
66 (Unhealthy for Sensitive Groups)
46 (Moderate)
46 (Moderate)
65 (Unhealthy for Sensitive Groups)
64 (Unhealthy for Sensitive Groups)
75 (Unhealthy for Sensitive Groups)
54 (Unhealthy for Sensitive Groups)
26 (Moderate)
38 (Moderate)
44 (Moderate)
31 (Moderate)
34 (Moderate)
61 (Unhealthy for Sensitive Groups)
46 (Moderate)
60 (Unhealthy for Sensitive Groups)
76 (Unhealthy for Sensitive Groups)
97 (Unhealthy)
88 (Unhealthy)
68 (Unhealthy for Sensitive Groups)
63 (Unhealthy for Sensitive Groups)
so2
3.4 (Good)
3.5 (Good)
5.7 (Good)
7.5 (Good)
5.7 (Good)
6.4 (Good)
3.6 (Good)
5.8 (Good)
3.4 (Good)
4.6 (Good)
4.5 (Good)
5.8 (Good)
4.7 (Good)
4.6 (Good)
4.3 (Good)
3.7 (Good)
4.8 (Good)
5.1 (Good)
5 (Good)
7.2 (Good)
data source »
西山风景区
Friday, May 27, 2022, 3:00 PM
PM2,5 61 (Unhealthy)
particulate matter (PM2.5) dust
NO2 22 (Good)
nitrogen dioxide (NO2)
PM10 69 (Unhealthy for Sensitive Groups)
particulate matter (PM10) suspended dust
CO 219 (Good)
carbon monoxide (CO)
O3 0.05 (Good)
ozone (O3)
SO2 7.7 (Good)
sulfur dioxide (SO2)
西山风景区
index
2022-05-27
pm25
28
no2
22
pm10
35
co
579
o3
22
so2
4.6
西山风景区
2018-10 2020-05

index
2020-05
2020-04
2020-03
2020-02
2020-01
2019-12
2019-11
2019-10
2019-09
2019-08
2019-07
2019-06
2019-05
2019-04
2019-03
2019-02
2019-01
2018-12
2018-11
2018-10
pm25
43
33
33
48
48
58
33
17
26
27
23
26
46
39
47
64
82
63
43
41
co
732
629
584
762
919
742
711
790
876
682
661
870
815
807
762
989
1
981
759
853
no2
16
15
14
16
21
23
22
19
14
22
21
19
13
13
15
14
25
16
15
21
o3
165
129
113
73
67
75
64
72
98
134
102
121
130
126
98
79
50
60
79
71
pm10
66
46
46
65
64
75
54
26
38
44
31
34
61
46
60
76
97
88
68
63
so2
3.4
3.5
5.7
7.5
5.7
6.4
3.6
5.8
3.4
4.6
4.5
5.8
4.7
4.6
4.3
3.7
4.8
5.1
5
7.2
* Pollution data source:
https://openaq.org
(ChinaAQIData)
The data is licensed under CC-By 4.0
PM2,5 61 (Unhealthy)
NO2 22 (Good)
PM10 69 (Unhealthy for Sensitive Groups)
CO 219 (Good)
O3 0 (Good)
SO2 8 (Good)
Data on air pollution from recent days in Qileya
| index | 2022-05-27 |
|---|---|
| pm25 | 28 Moderate |
| no2 | 22 Good |
| pm10 | 35 Moderate |
| co | 579 Good |
| o3 | 22 Good |
| so2 | 5 Good |
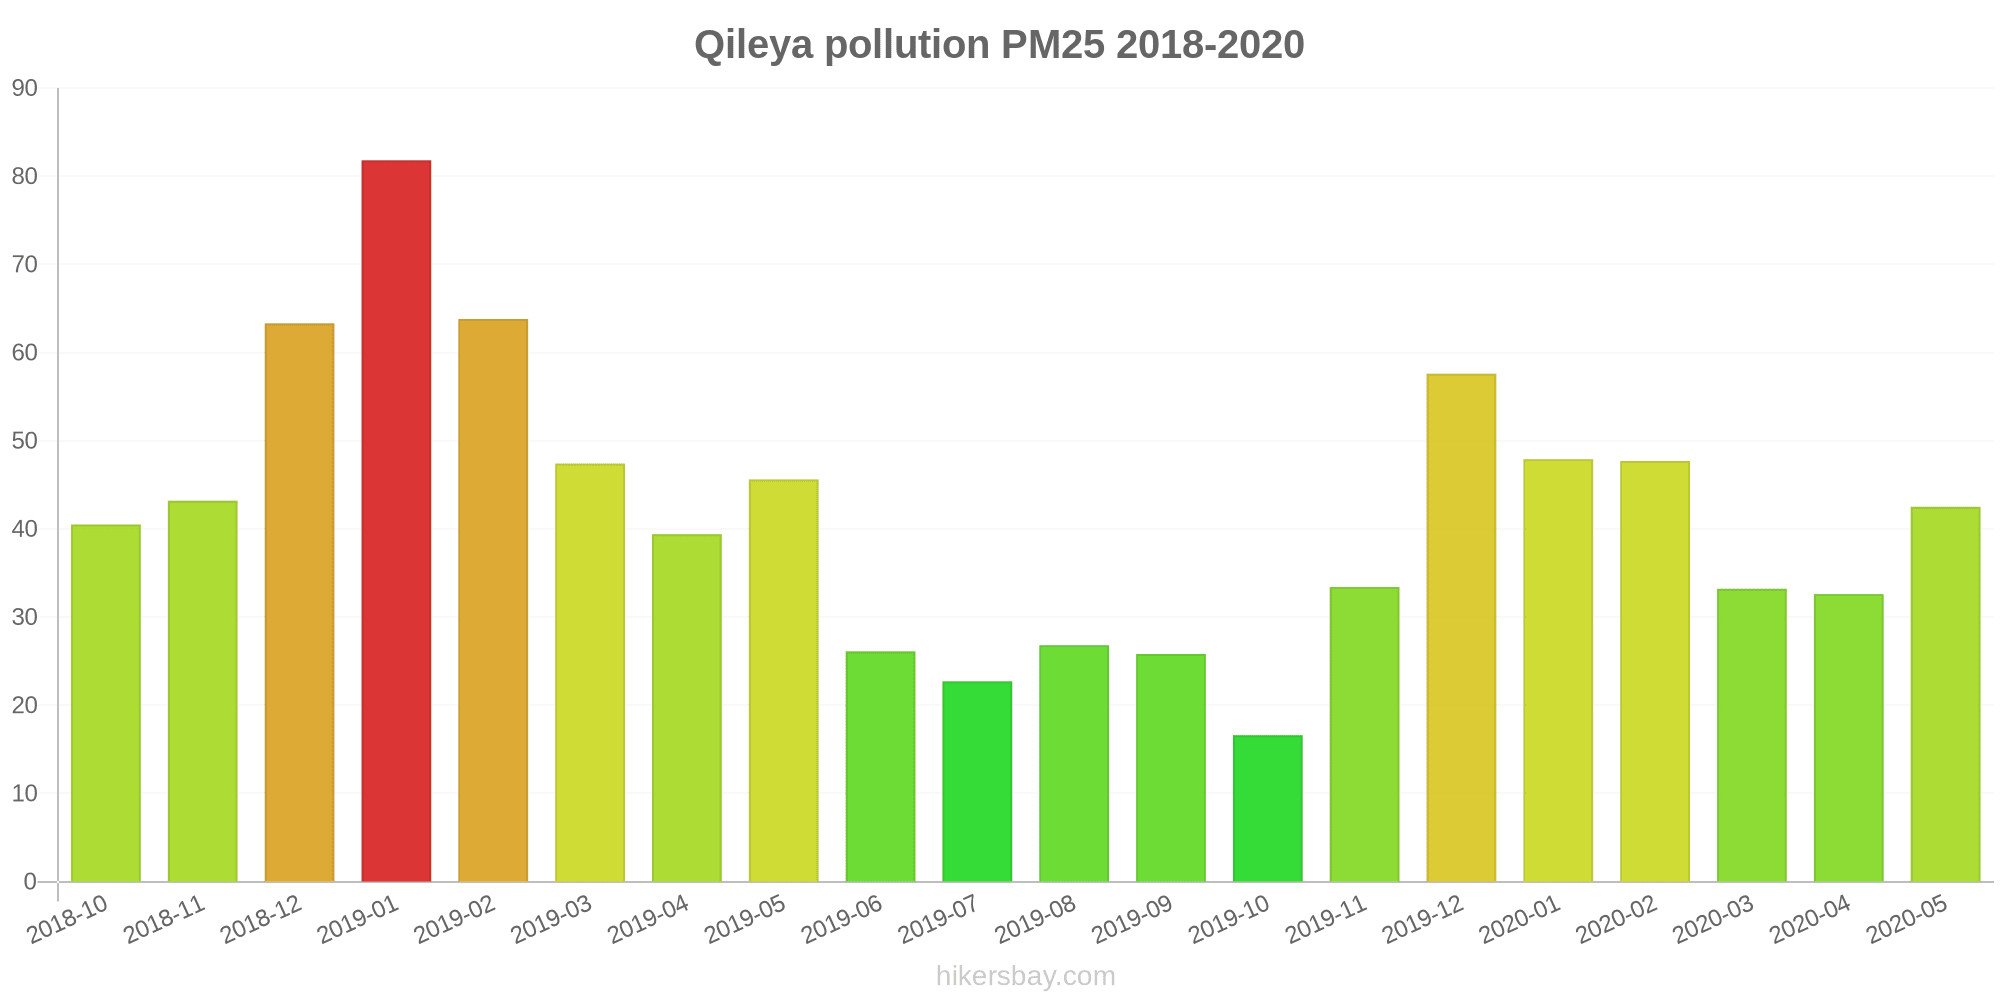
| index | 2020-05 | 2020-04 | 2020-03 | 2020-02 | 2020-01 | 2019-12 | 2019-11 | 2019-10 | 2019-09 | 2019-08 | 2019-07 | 2019-06 | 2019-05 | 2019-04 | 2019-03 | 2019-02 | 2019-01 | 2018-12 | 2018-11 | 2018-10 |
|---|---|---|---|---|---|---|---|---|---|---|---|---|---|---|---|---|---|---|---|---|
| pm25 | 43 (Unhealthy for Sensitive Groups) | 33 (Moderate) | 33 (Moderate) | 48 (Unhealthy for Sensitive Groups) | 48 (Unhealthy for Sensitive Groups) | 58 (Unhealthy) | 33 (Moderate) | 17 (Moderate) | 26 (Moderate) | 27 (Moderate) | 23 (Moderate) | 26 (Moderate) | 46 (Unhealthy for Sensitive Groups) | 39 (Unhealthy for Sensitive Groups) | 47 (Unhealthy for Sensitive Groups) | 64 (Unhealthy) | 82 (Very Unhealthy) | 63 (Unhealthy) | 43 (Unhealthy for Sensitive Groups) | 41 (Unhealthy for Sensitive Groups) |
| co | 732 (Good) | 629 (Good) | 584 (Good) | 762 (Good) | 919 (Good) | 742 (Good) | 711 (Good) | 790 (Good) | 876 (Good) | 682 (Good) | 661 (Good) | 870 (Good) | 815 (Good) | 807 (Good) | 762 (Good) | 989 (Good) | 1 (Good) | 981 (Good) | 759 (Good) | 853 (Good) |
| no2 | 16 (Good) | 15 (Good) | 14 (Good) | 16 (Good) | 21 (Good) | 23 (Good) | 22 (Good) | 19 (Good) | 14 (Good) | 22 (Good) | 21 (Good) | 19 (Good) | 13 (Good) | 13 (Good) | 15 (Good) | 14 (Good) | 25 (Good) | 16 (Good) | 15 (Good) | 21 (Good) |
| o3 | 165 (Unhealthy) | 129 (Unhealthy for Sensitive Groups) | 113 (Moderate) | 73 (Moderate) | 67 (Good) | 75 (Moderate) | 64 (Good) | 72 (Moderate) | 98 (Moderate) | 134 (Unhealthy for Sensitive Groups) | 102 (Moderate) | 121 (Unhealthy for Sensitive Groups) | 130 (Unhealthy for Sensitive Groups) | 126 (Unhealthy for Sensitive Groups) | 98 (Moderate) | 79 (Moderate) | 50 (Good) | 60 (Good) | 79 (Moderate) | 71 (Moderate) |
| pm10 | 66 (Unhealthy for Sensitive Groups) | 46 (Moderate) | 46 (Moderate) | 65 (Unhealthy for Sensitive Groups) | 64 (Unhealthy for Sensitive Groups) | 75 (Unhealthy for Sensitive Groups) | 54 (Unhealthy for Sensitive Groups) | 26 (Moderate) | 38 (Moderate) | 44 (Moderate) | 31 (Moderate) | 34 (Moderate) | 61 (Unhealthy for Sensitive Groups) | 46 (Moderate) | 60 (Unhealthy for Sensitive Groups) | 76 (Unhealthy for Sensitive Groups) | 97 (Unhealthy) | 88 (Unhealthy) | 68 (Unhealthy for Sensitive Groups) | 63 (Unhealthy for Sensitive Groups) |
| so2 | 3.4 (Good) | 3.5 (Good) | 5.7 (Good) | 7.5 (Good) | 5.7 (Good) | 6.4 (Good) | 3.6 (Good) | 5.8 (Good) | 3.4 (Good) | 4.6 (Good) | 4.5 (Good) | 5.8 (Good) | 4.7 (Good) | 4.6 (Good) | 4.3 (Good) | 3.7 (Good) | 4.8 (Good) | 5.1 (Good) | 5 (Good) | 7.2 (Good) |
PM2,5 61 (Unhealthy)
particulate matter (PM2.5) dustNO2 22 (Good)
nitrogen dioxide (NO2)PM10 69 (Unhealthy for Sensitive Groups)
particulate matter (PM10) suspended dustCO 219 (Good)
carbon monoxide (CO)O3 0.05 (Good)
ozone (O3)SO2 7.7 (Good)
sulfur dioxide (SO2)西山风景区
| index | 2022-05-27 |
|---|---|
| pm25 | 28 |
| no2 | 22 |
| pm10 | 35 |
| co | 579 |
| o3 | 22 |
| so2 | 4.6 |
西山风景区
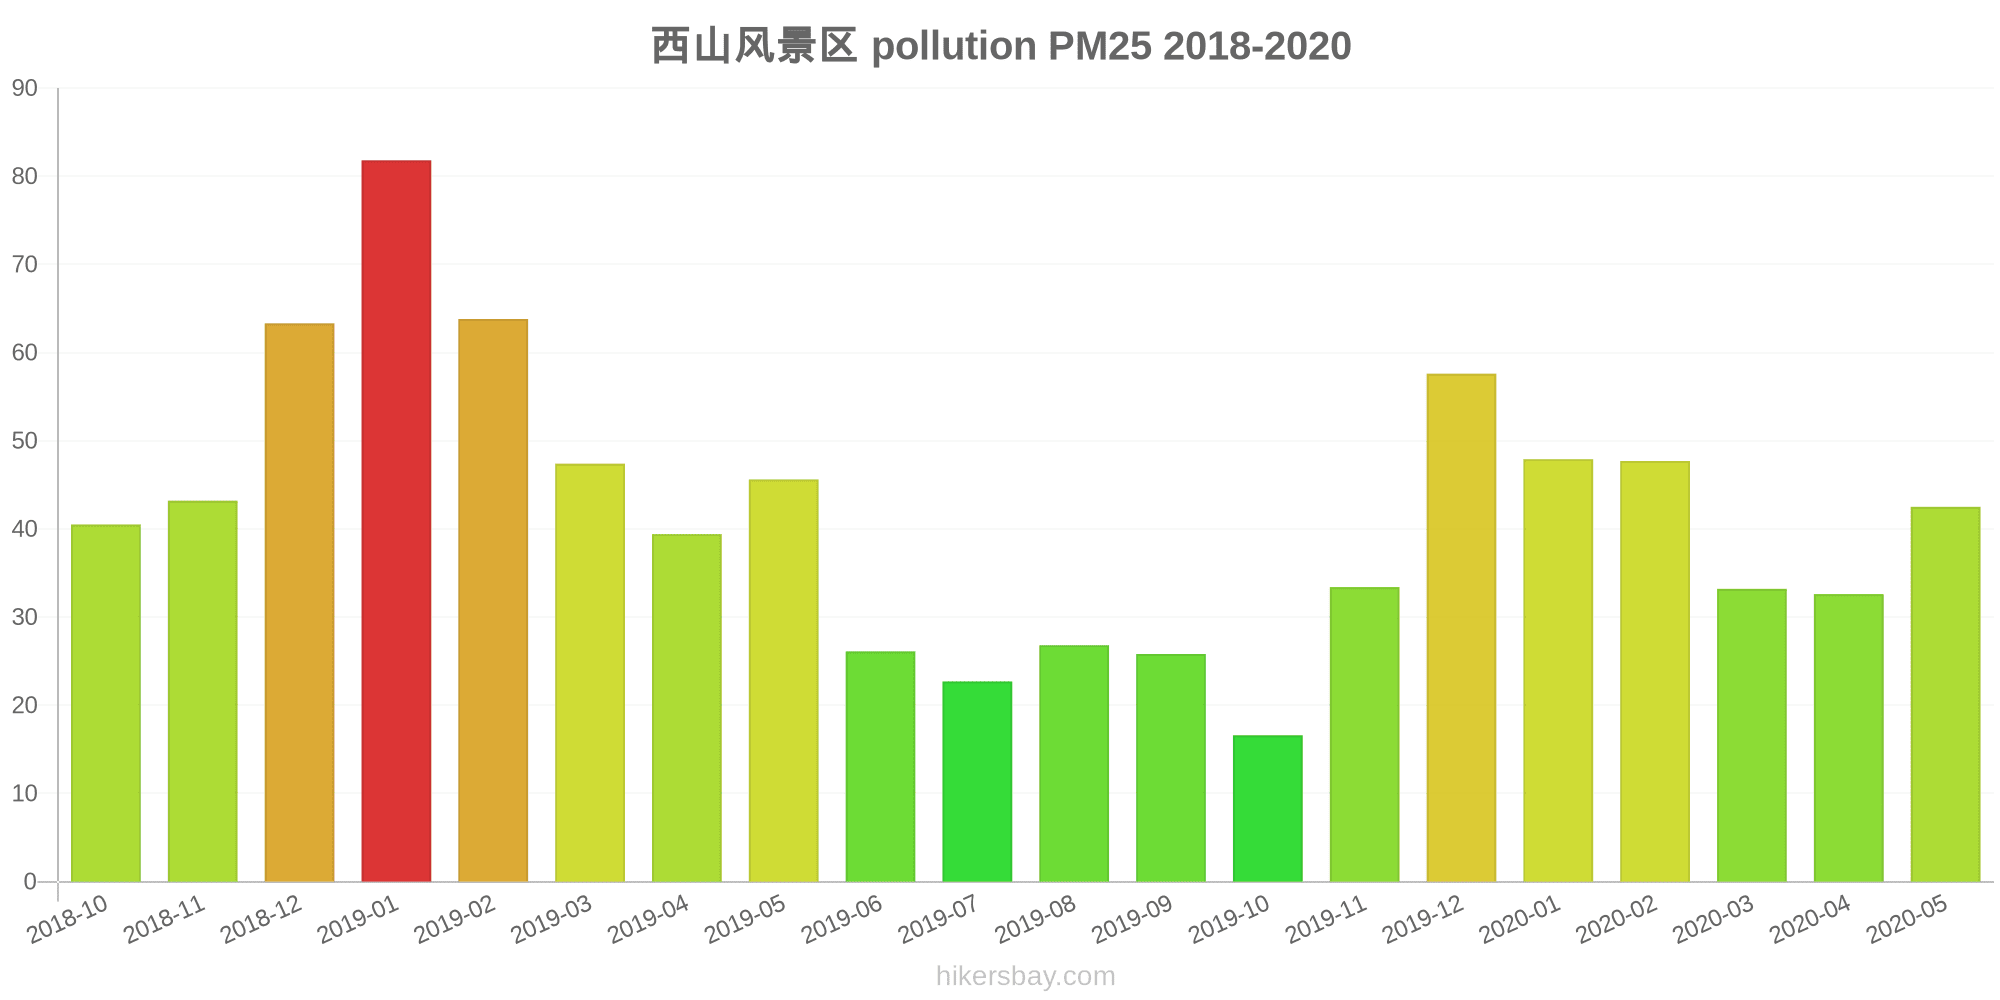
| index | 2020-05 | 2020-04 | 2020-03 | 2020-02 | 2020-01 | 2019-12 | 2019-11 | 2019-10 | 2019-09 | 2019-08 | 2019-07 | 2019-06 | 2019-05 | 2019-04 | 2019-03 | 2019-02 | 2019-01 | 2018-12 | 2018-11 | 2018-10 |
|---|---|---|---|---|---|---|---|---|---|---|---|---|---|---|---|---|---|---|---|---|
| pm25 | 43 | 33 | 33 | 48 | 48 | 58 | 33 | 17 | 26 | 27 | 23 | 26 | 46 | 39 | 47 | 64 | 82 | 63 | 43 | 41 |
| co | 732 | 629 | 584 | 762 | 919 | 742 | 711 | 790 | 876 | 682 | 661 | 870 | 815 | 807 | 762 | 989 | 1 | 981 | 759 | 853 |
| no2 | 16 | 15 | 14 | 16 | 21 | 23 | 22 | 19 | 14 | 22 | 21 | 19 | 13 | 13 | 15 | 14 | 25 | 16 | 15 | 21 |
| o3 | 165 | 129 | 113 | 73 | 67 | 75 | 64 | 72 | 98 | 134 | 102 | 121 | 130 | 126 | 98 | 79 | 50 | 60 | 79 | 71 |
| pm10 | 66 | 46 | 46 | 65 | 64 | 75 | 54 | 26 | 38 | 44 | 31 | 34 | 61 | 46 | 60 | 76 | 97 | 88 | 68 | 63 |
| so2 | 3.4 | 3.5 | 5.7 | 7.5 | 5.7 | 6.4 | 3.6 | 5.8 | 3.4 | 4.6 | 4.5 | 5.8 | 4.7 | 4.6 | 4.3 | 3.7 | 4.8 | 5.1 | 5 | 7.2 |