Air Pollution in Nanmu: Real-time Air Quality Index and smog alert.
Pollution and air quality forecast for Nanmu. Today is Tuesday, June 16, 2026. The following air pollution values have been recorded for Nanmu:- particulate matter (PM2.5) dust - 61 (Unhealthy)
- nitrogen dioxide (NO2) - 22 (Good)
- particulate matter (PM10) suspended dust - 69 (Unhealthy for Sensitive Groups)
- carbon monoxide (CO) - 219 (Good)
- ozone (O3) - 0 (Good)
- sulfur dioxide (SO2) - 8 (Good)

What is the air quality in Nanmu today? Is the air polluted in Nanmu?. Is there smog?
What is the current level of PM2.5 in Nanmu? (particulate matter (PM2.5) dust)
Today's PM2.5 level is:
61 (Unhealthy)
For comparison, the highest level of PM2.5 in Nanmu in the last 7 days was: 28 (Friday, May 27, 2022) and the lowest: 28 (Friday, May 27, 2022).
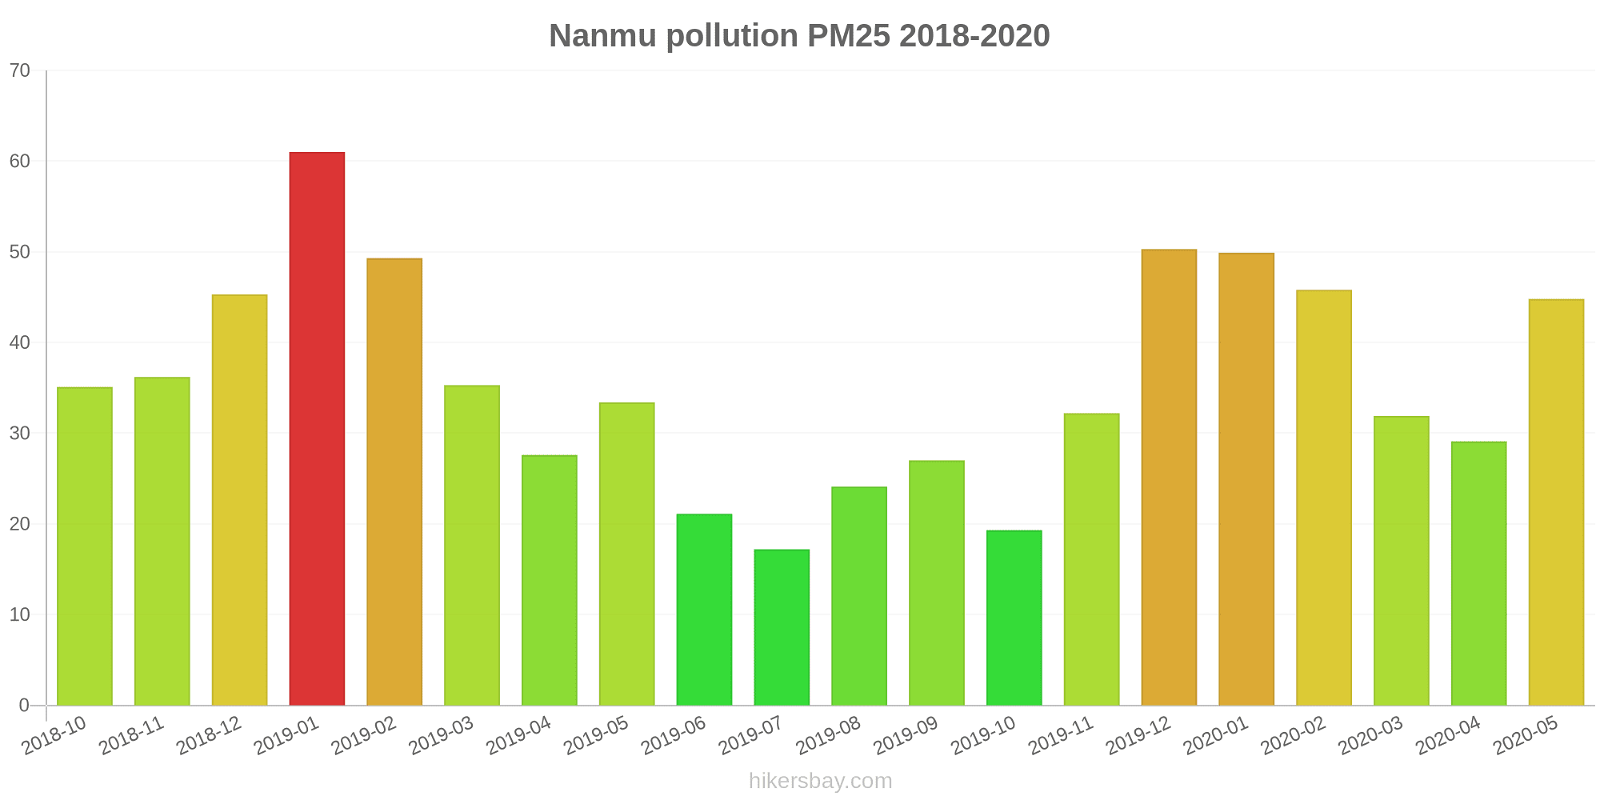
The highest PM2.5 values were recorded: 61 (January 2019).
The lowest level of particulate matter PM2.5 pollution occurs in month: July (17).
How high is the level of NO2? (nitrogen dioxide (NO2))
22 (Good)
What is the level of PM10 today in Nanmu? (particulate matter (PM10) suspended dust)
The current level of particulate matter PM10 in Nanmu is:
69 (Unhealthy for Sensitive Groups)
The highest PM10 values usually occur in month: 89 (January 2019).
The lowest value of particulate matter PM10 pollution in Nanmu is usually recorded in: October (29).
How high is the CO level? (carbon monoxide (CO))
219 (Good)
How is the O3 level today in Nanmu? (ozone (O3))
0 (Good)
What is the level of SO2 pollution? (sulfur dioxide (SO2))
8 (Good)
Current data Friday, May 27, 2022, 3:00 PM
PM2,5 61 (Unhealthy)
NO2 22 (Good)
PM10 69 (Unhealthy for Sensitive Groups)
CO 219 (Good)
O3 0 (Good)
SO2 8 (Good)
Data on air pollution from recent days in Nanmu
index
2022-05-27
pm25
28
Moderate
no2
22
Good
pm10
35
Moderate
co
579
Good
o3
22
Good
so2
5
Good
data source »
Air pollution in Nanmu from October 2018 to May 2020
index
2020-05
2020-04
2020-03
2020-02
2020-01
2019-12
2019-11
2019-10
2019-09
2019-08
2019-07
2019-06
2019-05
2019-04
2019-03
2019-02
2019-01
2018-12
2018-11
2018-10
pm25
45 (Unhealthy for Sensitive Groups)
29 (Moderate)
32 (Moderate)
46 (Unhealthy for Sensitive Groups)
50 (Unhealthy for Sensitive Groups)
50 (Unhealthy for Sensitive Groups)
32 (Moderate)
19 (Moderate)
27 (Moderate)
24 (Moderate)
17 (Moderate)
21 (Moderate)
33 (Moderate)
28 (Moderate)
35 (Unhealthy for Sensitive Groups)
49 (Unhealthy for Sensitive Groups)
61 (Unhealthy)
45 (Unhealthy for Sensitive Groups)
36 (Unhealthy for Sensitive Groups)
35 (Unhealthy for Sensitive Groups)
co
673 (Good)
608 (Good)
619 (Good)
764 (Good)
1 (Good)
822 (Good)
582 (Good)
521 (Good)
582 (Good)
606 (Good)
577 (Good)
582 (Good)
531 (Good)
421 (Good)
586 (Good)
786 (Good)
922 (Good)
774 (Good)
656 (Good)
752 (Good)
no2
22 (Good)
24 (Good)
23 (Good)
13 (Good)
26 (Good)
33 (Good)
25 (Good)
20 (Good)
23 (Good)
24 (Good)
22 (Good)
20 (Good)
22 (Good)
29 (Good)
33 (Good)
23 (Good)
32 (Good)
30 (Good)
33 (Good)
30 (Good)
o3
140 (Unhealthy for Sensitive Groups)
111 (Moderate)
97 (Moderate)
80 (Moderate)
66 (Good)
48 (Good)
49 (Good)
73 (Moderate)
99 (Moderate)
155 (Unhealthy)
115 (Moderate)
117 (Moderate)
114 (Moderate)
128 (Unhealthy for Sensitive Groups)
93 (Moderate)
75 (Moderate)
60 (Good)
45 (Good)
65 (Good)
79 (Moderate)
pm10
86 (Unhealthy)
58 (Unhealthy for Sensitive Groups)
60 (Unhealthy for Sensitive Groups)
64 (Unhealthy for Sensitive Groups)
74 (Unhealthy for Sensitive Groups)
89 (Unhealthy)
61 (Unhealthy for Sensitive Groups)
29 (Moderate)
44 (Moderate)
44 (Moderate)
31 (Moderate)
34 (Moderate)
55 (Unhealthy for Sensitive Groups)
51 (Unhealthy for Sensitive Groups)
61 (Unhealthy for Sensitive Groups)
69 (Unhealthy for Sensitive Groups)
89 (Unhealthy)
68 (Unhealthy for Sensitive Groups)
56 (Unhealthy for Sensitive Groups)
56 (Unhealthy for Sensitive Groups)
so2
14 (Good)
9 (Good)
9.5 (Good)
8.4 (Good)
9.4 (Good)
9.6 (Good)
10 (Good)
7.9 (Good)
9.8 (Good)
12 (Good)
12 (Good)
11 (Good)
11 (Good)
11 (Good)
11 (Good)
8.2 (Good)
9.7 (Good)
8.6 (Good)
9.1 (Good)
9.3 (Good)
data source »
美宁食品公司
Friday, May 27, 2022, 3:00 PM
PM2,5 61 (Unhealthy)
particulate matter (PM2.5) dust
NO2 22 (Good)
nitrogen dioxide (NO2)
PM10 69 (Unhealthy for Sensitive Groups)
particulate matter (PM10) suspended dust
CO 219 (Good)
carbon monoxide (CO)
O3 0.05 (Good)
ozone (O3)
SO2 7.7 (Good)
sulfur dioxide (SO2)
美宁食品公司
index
2022-05-27
pm25
28
no2
22
pm10
35
co
579
o3
22
so2
4.6
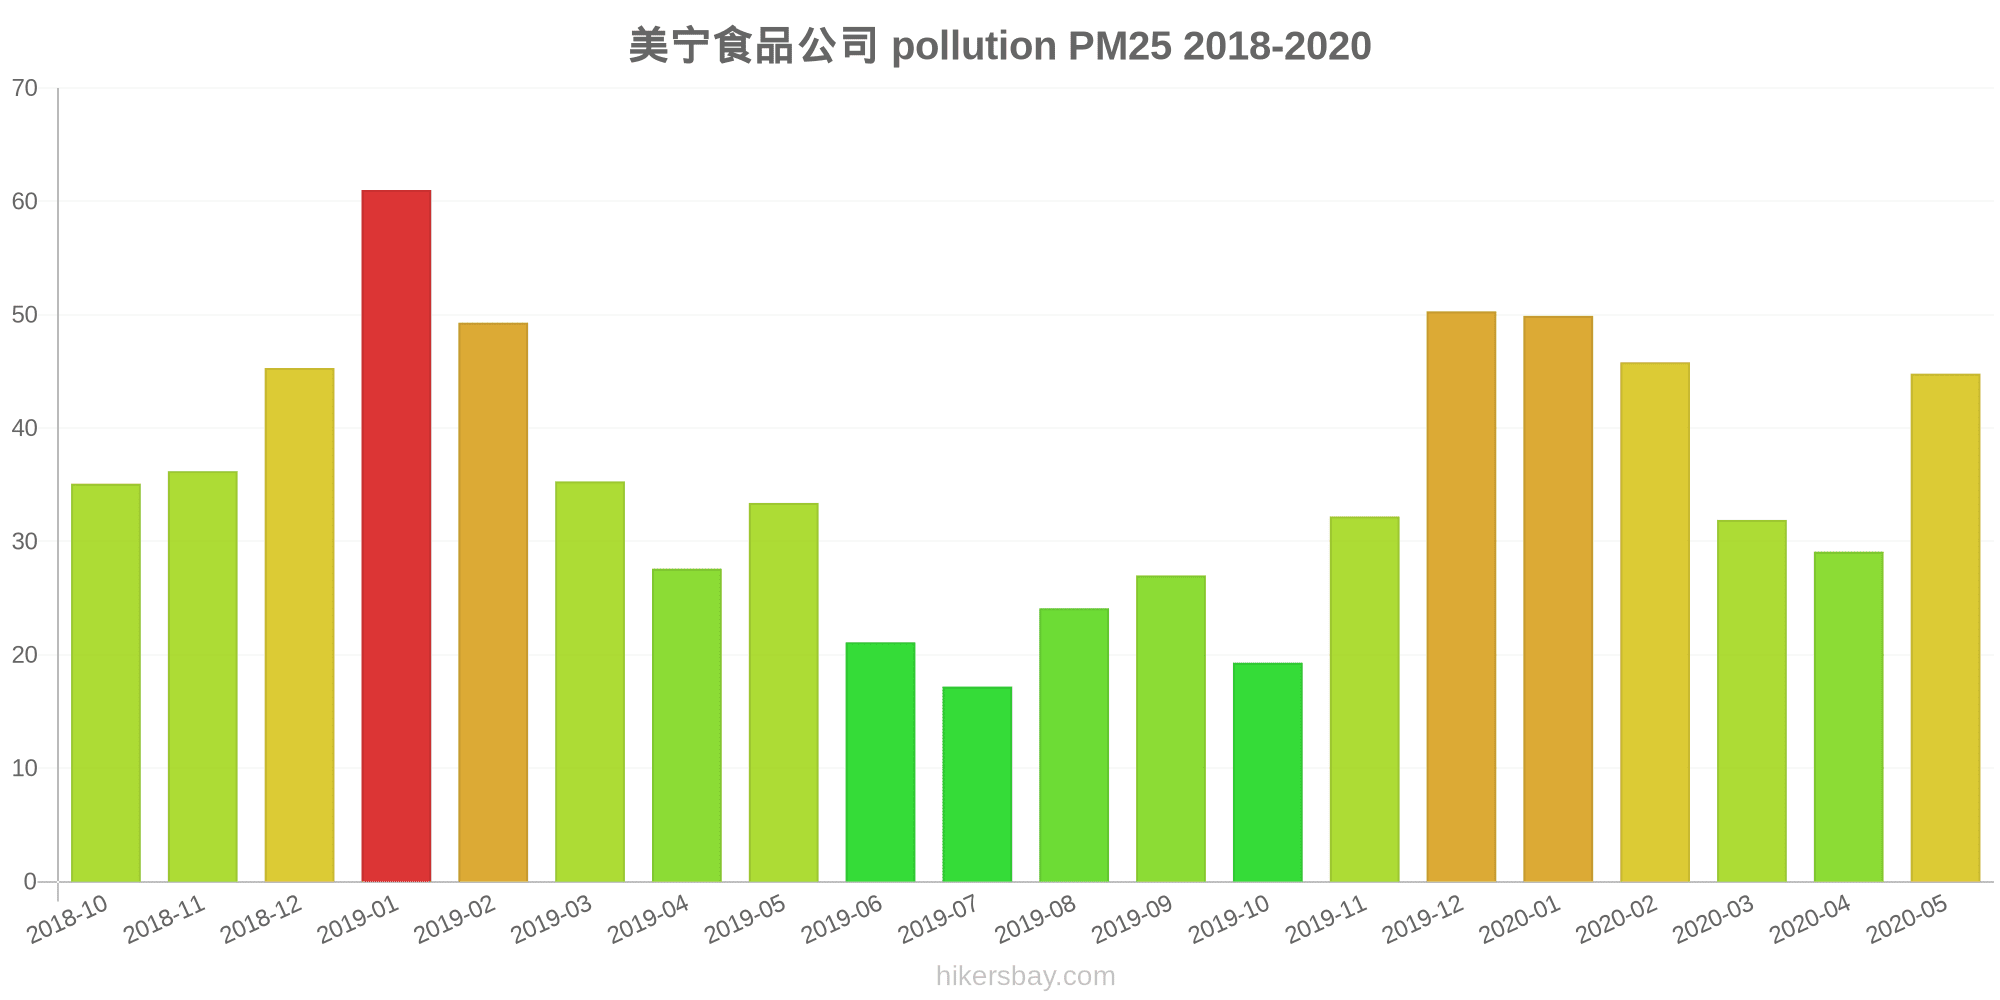
美宁食品公司
2018-10 2020-05

index
2020-05
2020-04
2020-03
2020-02
2020-01
2019-12
2019-11
2019-10
2019-09
2019-08
2019-07
2019-06
2019-05
2019-04
2019-03
2019-02
2019-01
2018-12
2018-11
2018-10
pm25
45
29
32
46
50
50
32
19
27
24
17
21
33
28
35
49
61
45
36
35
co
673
608
619
764
1
822
582
521
582
606
577
582
531
421
586
786
922
774
656
752
no2
22
24
23
13
26
33
25
20
23
24
22
20
22
29
33
23
32
30
33
30
o3
140
111
97
80
66
48
49
73
99
155
115
117
114
128
93
75
60
45
65
79
pm10
86
58
60
64
74
89
61
29
44
44
31
34
55
51
61
69
89
68
56
56
so2
14
9
9.5
8.4
9.4
9.6
10
7.9
9.8
12
12
11
11
11
11
8.2
9.7
8.6
9.1
9.3
* Pollution data source:
https://openaq.org
(ChinaAQIData)
The data is licensed under CC-By 4.0
PM2,5 61 (Unhealthy)
NO2 22 (Good)
PM10 69 (Unhealthy for Sensitive Groups)
CO 219 (Good)
O3 0 (Good)
SO2 8 (Good)
Data on air pollution from recent days in Nanmu
| index | 2022-05-27 |
|---|---|
| pm25 | 28 Moderate |
| no2 | 22 Good |
| pm10 | 35 Moderate |
| co | 579 Good |
| o3 | 22 Good |
| so2 | 5 Good |

| index | 2020-05 | 2020-04 | 2020-03 | 2020-02 | 2020-01 | 2019-12 | 2019-11 | 2019-10 | 2019-09 | 2019-08 | 2019-07 | 2019-06 | 2019-05 | 2019-04 | 2019-03 | 2019-02 | 2019-01 | 2018-12 | 2018-11 | 2018-10 |
|---|---|---|---|---|---|---|---|---|---|---|---|---|---|---|---|---|---|---|---|---|
| pm25 | 45 (Unhealthy for Sensitive Groups) | 29 (Moderate) | 32 (Moderate) | 46 (Unhealthy for Sensitive Groups) | 50 (Unhealthy for Sensitive Groups) | 50 (Unhealthy for Sensitive Groups) | 32 (Moderate) | 19 (Moderate) | 27 (Moderate) | 24 (Moderate) | 17 (Moderate) | 21 (Moderate) | 33 (Moderate) | 28 (Moderate) | 35 (Unhealthy for Sensitive Groups) | 49 (Unhealthy for Sensitive Groups) | 61 (Unhealthy) | 45 (Unhealthy for Sensitive Groups) | 36 (Unhealthy for Sensitive Groups) | 35 (Unhealthy for Sensitive Groups) |
| co | 673 (Good) | 608 (Good) | 619 (Good) | 764 (Good) | 1 (Good) | 822 (Good) | 582 (Good) | 521 (Good) | 582 (Good) | 606 (Good) | 577 (Good) | 582 (Good) | 531 (Good) | 421 (Good) | 586 (Good) | 786 (Good) | 922 (Good) | 774 (Good) | 656 (Good) | 752 (Good) |
| no2 | 22 (Good) | 24 (Good) | 23 (Good) | 13 (Good) | 26 (Good) | 33 (Good) | 25 (Good) | 20 (Good) | 23 (Good) | 24 (Good) | 22 (Good) | 20 (Good) | 22 (Good) | 29 (Good) | 33 (Good) | 23 (Good) | 32 (Good) | 30 (Good) | 33 (Good) | 30 (Good) |
| o3 | 140 (Unhealthy for Sensitive Groups) | 111 (Moderate) | 97 (Moderate) | 80 (Moderate) | 66 (Good) | 48 (Good) | 49 (Good) | 73 (Moderate) | 99 (Moderate) | 155 (Unhealthy) | 115 (Moderate) | 117 (Moderate) | 114 (Moderate) | 128 (Unhealthy for Sensitive Groups) | 93 (Moderate) | 75 (Moderate) | 60 (Good) | 45 (Good) | 65 (Good) | 79 (Moderate) |
| pm10 | 86 (Unhealthy) | 58 (Unhealthy for Sensitive Groups) | 60 (Unhealthy for Sensitive Groups) | 64 (Unhealthy for Sensitive Groups) | 74 (Unhealthy for Sensitive Groups) | 89 (Unhealthy) | 61 (Unhealthy for Sensitive Groups) | 29 (Moderate) | 44 (Moderate) | 44 (Moderate) | 31 (Moderate) | 34 (Moderate) | 55 (Unhealthy for Sensitive Groups) | 51 (Unhealthy for Sensitive Groups) | 61 (Unhealthy for Sensitive Groups) | 69 (Unhealthy for Sensitive Groups) | 89 (Unhealthy) | 68 (Unhealthy for Sensitive Groups) | 56 (Unhealthy for Sensitive Groups) | 56 (Unhealthy for Sensitive Groups) |
| so2 | 14 (Good) | 9 (Good) | 9.5 (Good) | 8.4 (Good) | 9.4 (Good) | 9.6 (Good) | 10 (Good) | 7.9 (Good) | 9.8 (Good) | 12 (Good) | 12 (Good) | 11 (Good) | 11 (Good) | 11 (Good) | 11 (Good) | 8.2 (Good) | 9.7 (Good) | 8.6 (Good) | 9.1 (Good) | 9.3 (Good) |
PM2,5 61 (Unhealthy)
particulate matter (PM2.5) dustNO2 22 (Good)
nitrogen dioxide (NO2)PM10 69 (Unhealthy for Sensitive Groups)
particulate matter (PM10) suspended dustCO 219 (Good)
carbon monoxide (CO)O3 0.05 (Good)
ozone (O3)SO2 7.7 (Good)
sulfur dioxide (SO2)美宁食品公司
| index | 2022-05-27 |
|---|---|
| pm25 | 28 |
| no2 | 22 |
| pm10 | 35 |
| co | 579 |
| o3 | 22 |
| so2 | 4.6 |
美宁食品公司
| index | 2020-05 | 2020-04 | 2020-03 | 2020-02 | 2020-01 | 2019-12 | 2019-11 | 2019-10 | 2019-09 | 2019-08 | 2019-07 | 2019-06 | 2019-05 | 2019-04 | 2019-03 | 2019-02 | 2019-01 | 2018-12 | 2018-11 | 2018-10 |
|---|---|---|---|---|---|---|---|---|---|---|---|---|---|---|---|---|---|---|---|---|
| pm25 | 45 | 29 | 32 | 46 | 50 | 50 | 32 | 19 | 27 | 24 | 17 | 21 | 33 | 28 | 35 | 49 | 61 | 45 | 36 | 35 |
| co | 673 | 608 | 619 | 764 | 1 | 822 | 582 | 521 | 582 | 606 | 577 | 582 | 531 | 421 | 586 | 786 | 922 | 774 | 656 | 752 |
| no2 | 22 | 24 | 23 | 13 | 26 | 33 | 25 | 20 | 23 | 24 | 22 | 20 | 22 | 29 | 33 | 23 | 32 | 30 | 33 | 30 |
| o3 | 140 | 111 | 97 | 80 | 66 | 48 | 49 | 73 | 99 | 155 | 115 | 117 | 114 | 128 | 93 | 75 | 60 | 45 | 65 | 79 |
| pm10 | 86 | 58 | 60 | 64 | 74 | 89 | 61 | 29 | 44 | 44 | 31 | 34 | 55 | 51 | 61 | 69 | 89 | 68 | 56 | 56 |
| so2 | 14 | 9 | 9.5 | 8.4 | 9.4 | 9.6 | 10 | 7.9 | 9.8 | 12 | 12 | 11 | 11 | 11 | 11 | 8.2 | 9.7 | 8.6 | 9.1 | 9.3 |