Air Pollution in Pumingsi: Real-time Air Quality Index and smog alert.
Pollution and air quality forecast for Pumingsi. Today is Tuesday, June 16, 2026. The following air pollution values have been recorded for Pumingsi:- particulate matter (PM2.5) dust - 61 (Unhealthy)
- nitrogen dioxide (NO2) - 22 (Good)
- particulate matter (PM10) suspended dust - 69 (Unhealthy for Sensitive Groups)
- carbon monoxide (CO) - 219 (Good)
- ozone (O3) - 0 (Good)
- sulfur dioxide (SO2) - 8 (Good)

What is the air quality in Pumingsi today? Is the air polluted in Pumingsi?. Is there smog?
What is the current level of PM2.5 in Pumingsi? (particulate matter (PM2.5) dust)
Today's PM2.5 level is:
61 (Unhealthy)
For comparison, the highest level of PM2.5 in Pumingsi in the last 7 days was: 28 (Friday, May 27, 2022) and the lowest: 28 (Friday, May 27, 2022).
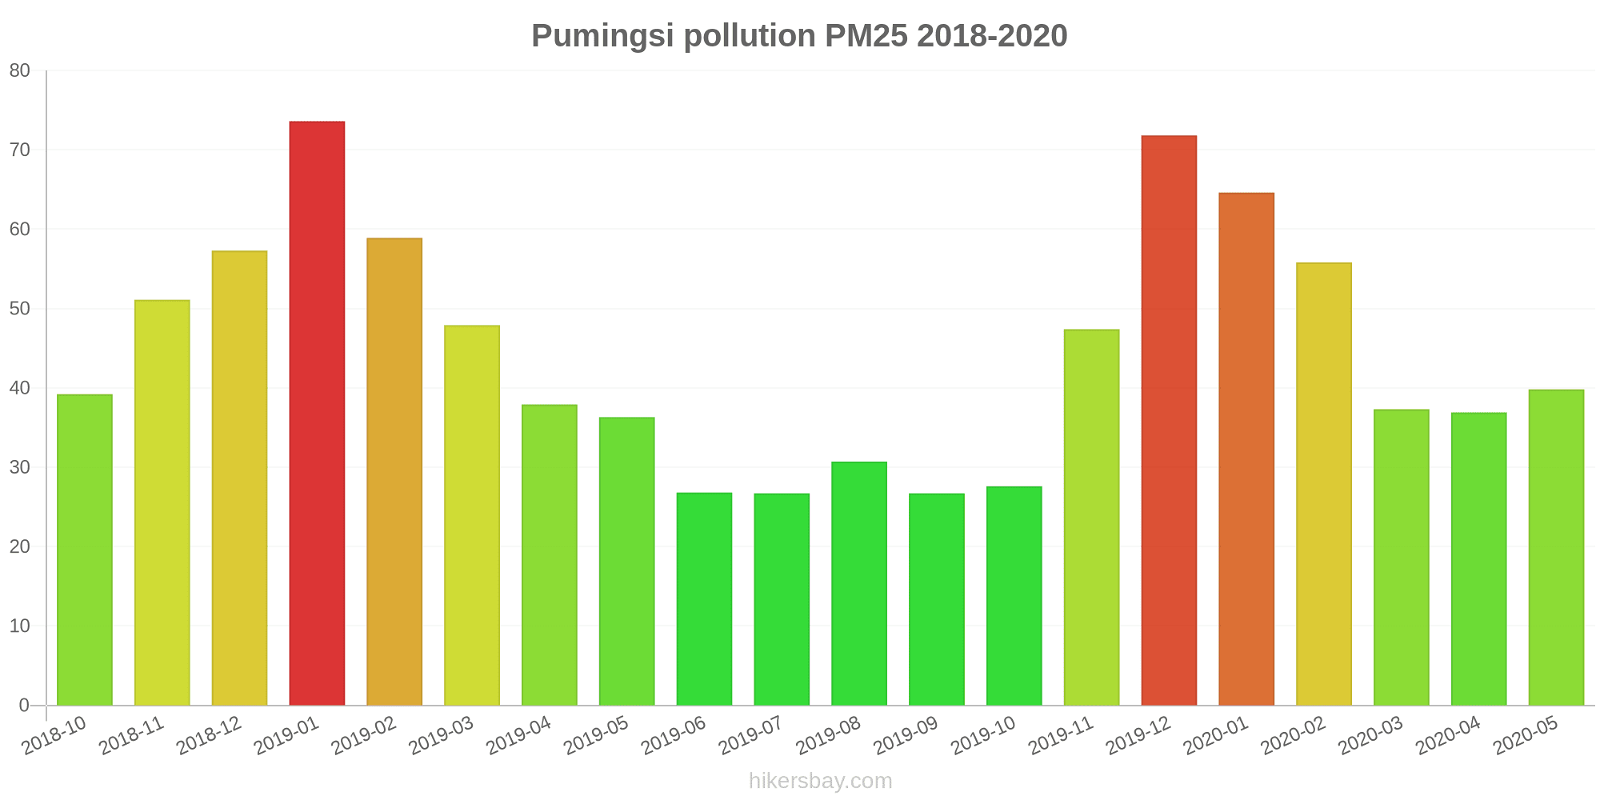
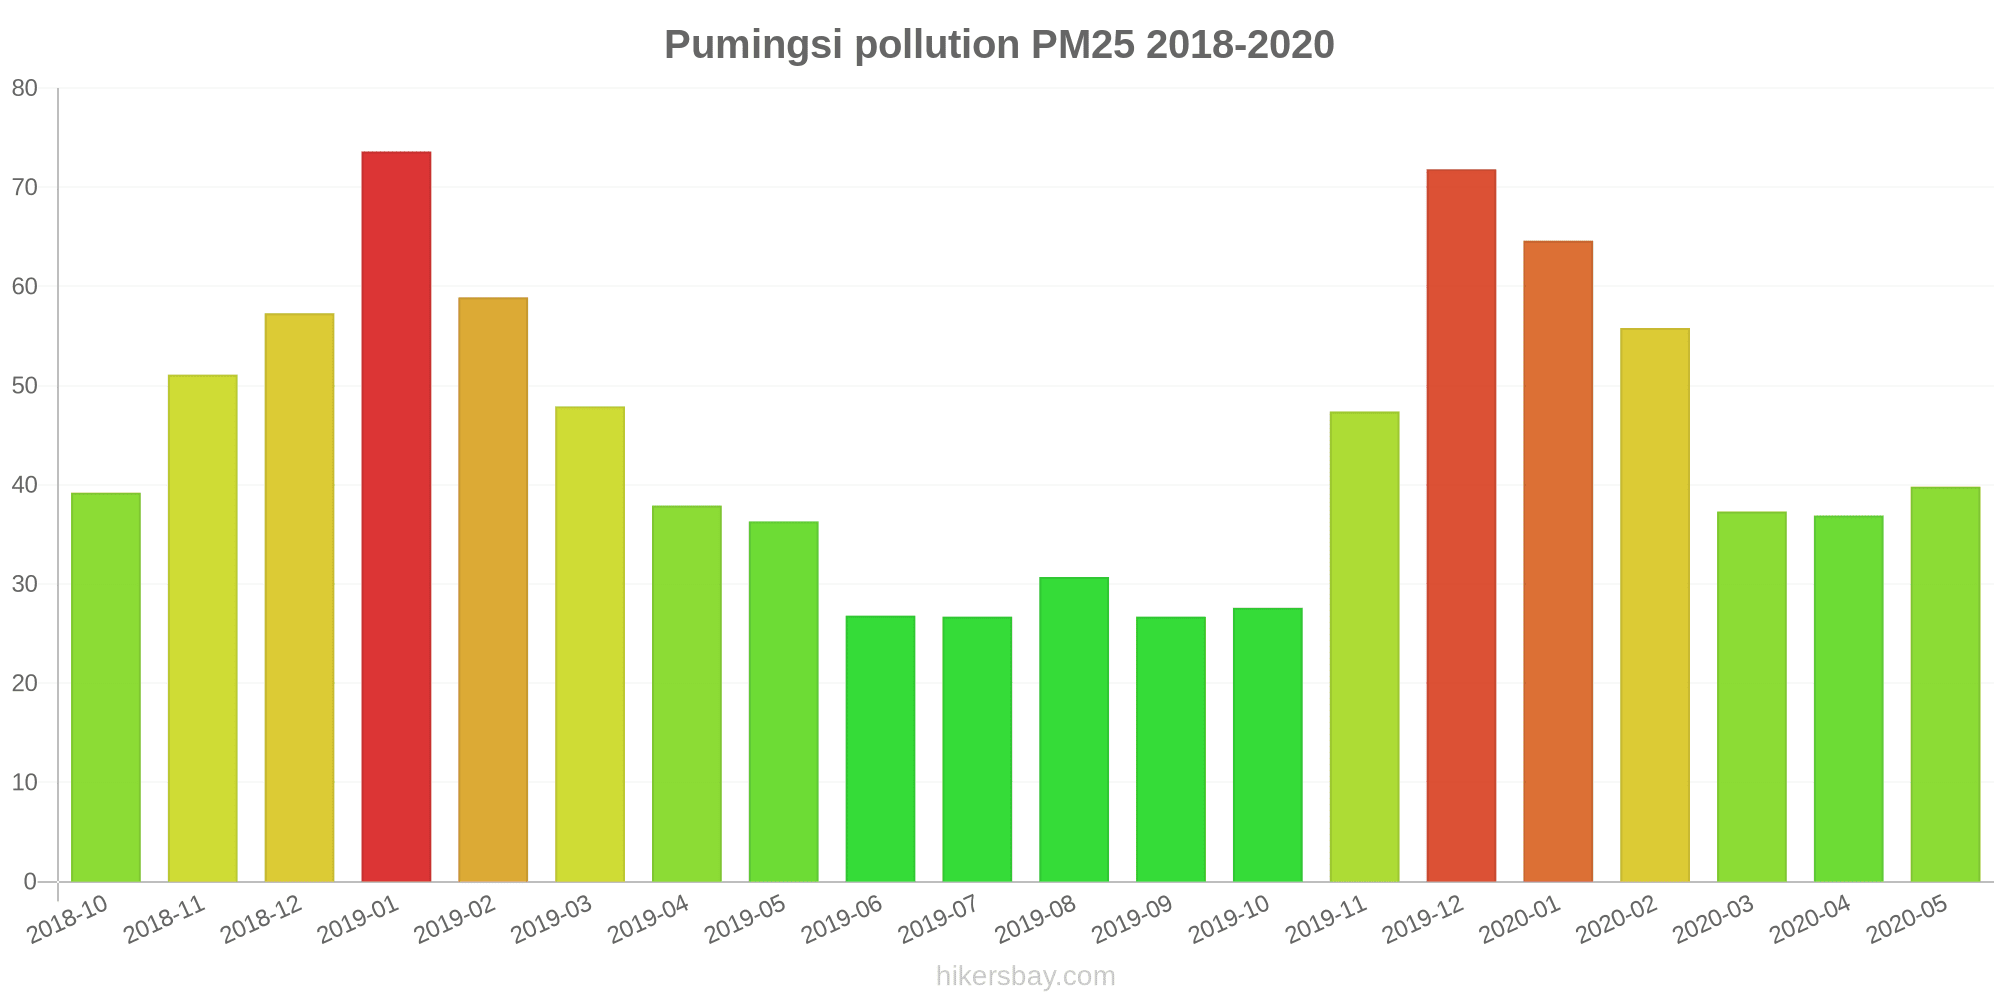
The highest PM2.5 values were recorded: 74 (January 2019).
The lowest level of particulate matter PM2.5 pollution occurs in month: September (27).
How high is the level of NO2? (nitrogen dioxide (NO2))
22 (Good)
What is the level of PM10 today in Pumingsi? (particulate matter (PM10) suspended dust)
The current level of particulate matter PM10 in Pumingsi is:
69 (Unhealthy for Sensitive Groups)
The highest PM10 values usually occur in month: 109 (January 2019).
The lowest value of particulate matter PM10 pollution in Pumingsi is usually recorded in: October (39).
How high is the CO level? (carbon monoxide (CO))
219 (Good)
How is the O3 level today in Pumingsi? (ozone (O3))
0 (Good)
What is the level of SO2 pollution? (sulfur dioxide (SO2))
8 (Good)
Current data Friday, May 27, 2022, 3:00 PM
PM2,5 61 (Unhealthy)
NO2 22 (Good)
PM10 69 (Unhealthy for Sensitive Groups)
CO 219 (Good)
O3 0 (Good)
SO2 8 (Good)
Data on air pollution from recent days in Pumingsi
index
2022-05-27
pm25
28
Moderate
no2
22
Good
pm10
35
Moderate
co
579
Good
o3
22
Good
so2
5
Good
data source »
Air pollution in Pumingsi from October 2018 to May 2020
index
2020-05
2020-04
2020-03
2020-02
2020-01
2019-12
2019-11
2019-10
2019-09
2019-08
2019-07
2019-06
2019-05
2019-04
2019-03
2019-02
2019-01
2018-12
2018-11
2018-10
pm25
40 (Unhealthy for Sensitive Groups)
37 (Unhealthy for Sensitive Groups)
37 (Unhealthy for Sensitive Groups)
56 (Unhealthy)
65 (Unhealthy)
72 (Unhealthy)
47 (Unhealthy for Sensitive Groups)
28 (Moderate)
27 (Moderate)
31 (Moderate)
27 (Moderate)
27 (Moderate)
36 (Unhealthy for Sensitive Groups)
38 (Unhealthy for Sensitive Groups)
48 (Unhealthy for Sensitive Groups)
59 (Unhealthy)
74 (Unhealthy)
57 (Unhealthy)
51 (Unhealthy for Sensitive Groups)
39 (Unhealthy for Sensitive Groups)
co
449 (Good)
476 (Good)
375 (Good)
549 (Good)
821 (Good)
540 (Good)
548 (Good)
550 (Good)
551 (Good)
565 (Good)
540 (Good)
574 (Good)
556 (Good)
620 (Good)
453 (Good)
428 (Good)
727 (Good)
548 (Good)
568 (Good)
652 (Good)
no2
39 (Good)
37 (Good)
38 (Good)
26 (Good)
37 (Good)
47 (Moderate)
36 (Good)
31 (Good)
31 (Good)
29 (Good)
24 (Good)
25 (Good)
29 (Good)
34 (Good)
43 (Moderate)
31 (Good)
47 (Moderate)
33 (Good)
40 (Good)
35 (Good)
o3
164 (Unhealthy)
132 (Unhealthy for Sensitive Groups)
109 (Moderate)
92 (Moderate)
71 (Moderate)
58 (Good)
67 (Good)
84 (Moderate)
99 (Moderate)
151 (Unhealthy)
136 (Unhealthy for Sensitive Groups)
140 (Unhealthy for Sensitive Groups)
124 (Unhealthy for Sensitive Groups)
131 (Unhealthy for Sensitive Groups)
101 (Moderate)
77 (Moderate)
63 (Good)
47 (Good)
62 (Good)
81 (Moderate)
pm10
71 (Unhealthy for Sensitive Groups)
59 (Unhealthy for Sensitive Groups)
75 (Unhealthy for Sensitive Groups)
81 (Unhealthy)
88 (Unhealthy)
108 (Unhealthy)
72 (Unhealthy for Sensitive Groups)
39 (Moderate)
41 (Moderate)
42 (Moderate)
42 (Moderate)
42 (Moderate)
59 (Unhealthy for Sensitive Groups)
63 (Unhealthy for Sensitive Groups)
75 (Unhealthy for Sensitive Groups)
83 (Unhealthy)
109 (Unhealthy)
96 (Unhealthy)
83 (Unhealthy)
68 (Unhealthy for Sensitive Groups)
so2
5.2 (Good)
5.4 (Good)
5.5 (Good)
4.1 (Good)
4.7 (Good)
5 (Good)
6.5 (Good)
5.6 (Good)
5.5 (Good)
5.5 (Good)
5.5 (Good)
5.2 (Good)
5.4 (Good)
6.5 (Good)
6.6 (Good)
5.5 (Good)
8.4 (Good)
7.4 (Good)
8.5 (Good)
7.6 (Good)
data source »
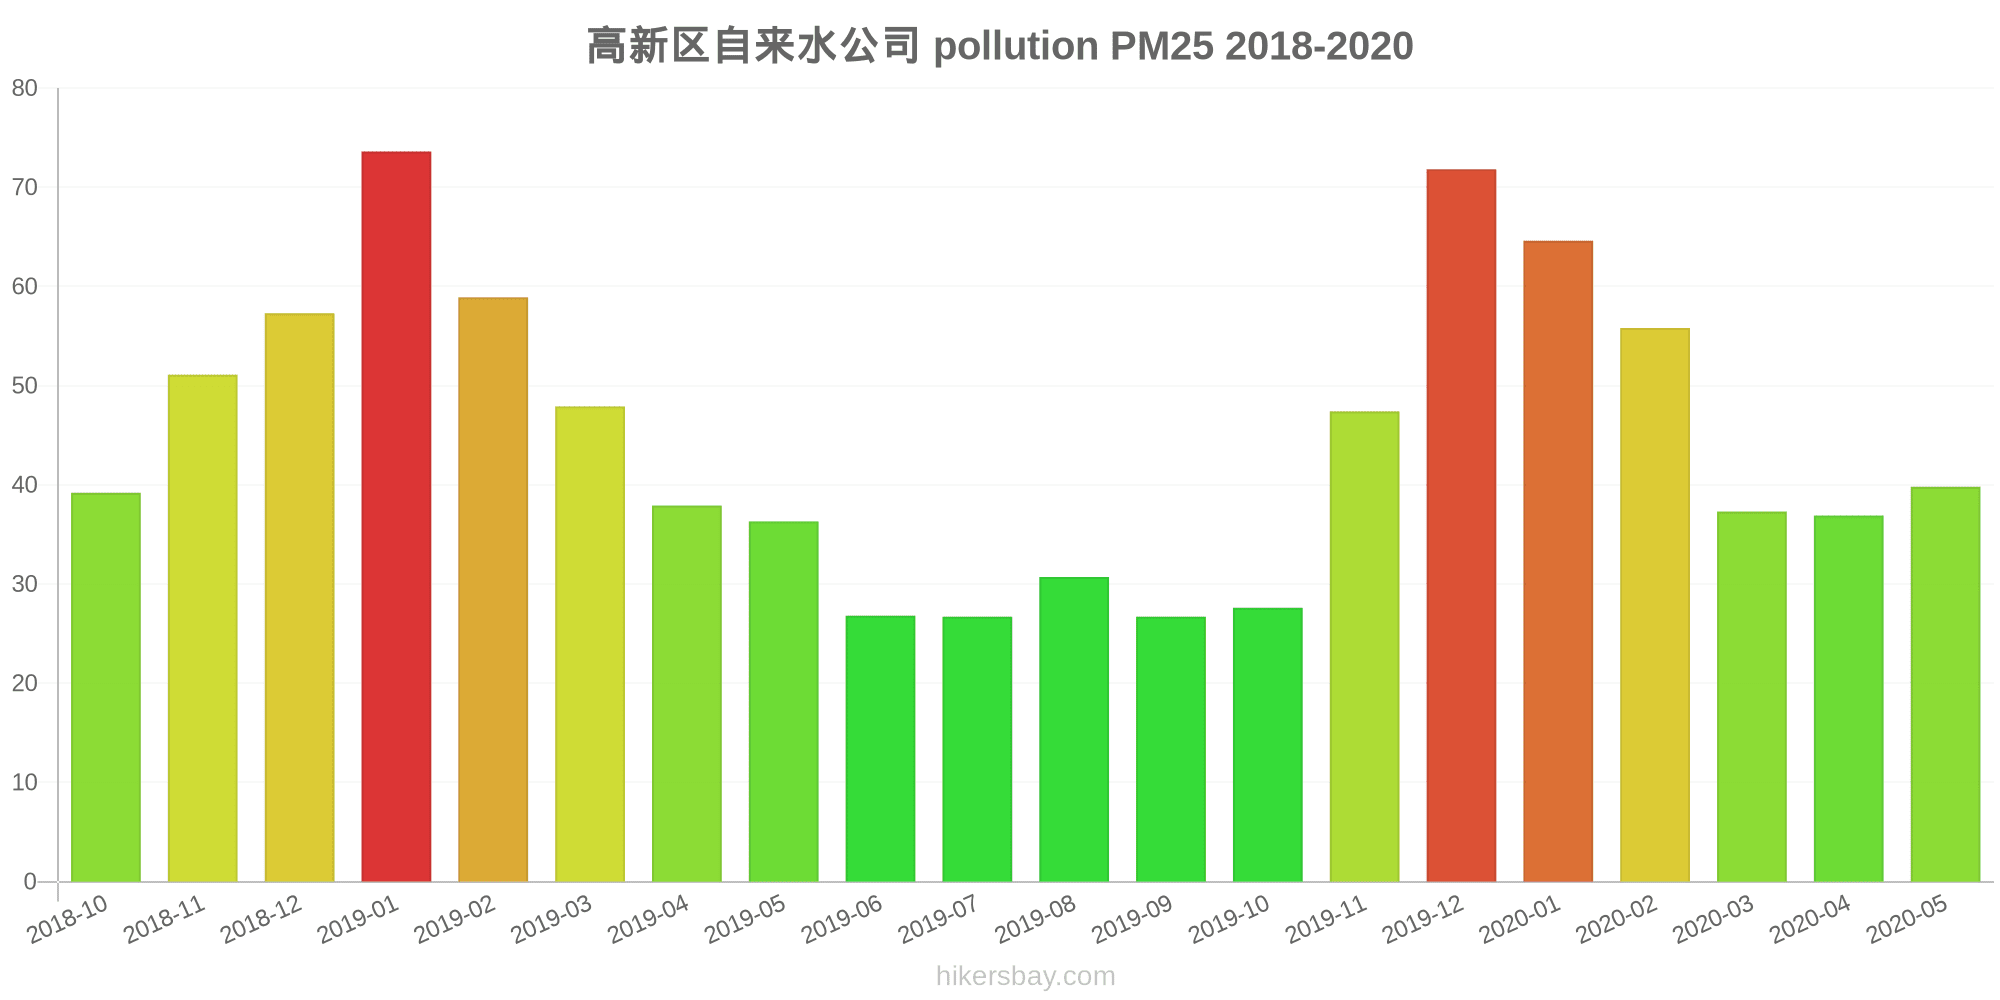
高新区自来水公司
Friday, May 27, 2022, 3:00 PM
PM2,5 61 (Unhealthy)
particulate matter (PM2.5) dust
NO2 22 (Good)
nitrogen dioxide (NO2)
PM10 69 (Unhealthy for Sensitive Groups)
particulate matter (PM10) suspended dust
CO 219 (Good)
carbon monoxide (CO)
O3 0.05 (Good)
ozone (O3)
SO2 7.7 (Good)
sulfur dioxide (SO2)
高新区自来水公司
index
2022-05-27
pm25
28
no2
22
pm10
35
co
579
o3
22
so2
4.6
高新区自来水公司
2018-10 2020-05

index
2020-05
2020-04
2020-03
2020-02
2020-01
2019-12
2019-11
2019-10
2019-09
2019-08
2019-07
2019-06
2019-05
2019-04
2019-03
2019-02
2019-01
2018-12
2018-11
2018-10
pm25
40
37
37
56
65
72
47
28
27
31
27
27
36
38
48
59
74
57
51
39
co
449
476
375
549
821
540
548
550
551
565
540
574
556
620
453
428
727
548
568
652
no2
39
37
38
26
37
47
36
31
31
29
24
25
29
34
43
31
47
33
40
35
o3
164
132
109
92
71
58
67
84
99
151
136
140
124
131
101
77
63
47
62
81
pm10
71
59
75
81
88
108
72
39
41
42
42
42
59
63
75
83
109
96
83
68
so2
5.2
5.4
5.5
4.1
4.7
5
6.5
5.6
5.5
5.5
5.5
5.2
5.4
6.5
6.6
5.5
8.4
7.4
8.5
7.6
* Pollution data source:
https://openaq.org
(ChinaAQIData)
The data is licensed under CC-By 4.0
PM2,5 61 (Unhealthy)
NO2 22 (Good)
PM10 69 (Unhealthy for Sensitive Groups)
CO 219 (Good)
O3 0 (Good)
SO2 8 (Good)
Data on air pollution from recent days in Pumingsi
| index | 2022-05-27 |
|---|---|
| pm25 | 28 Moderate |
| no2 | 22 Good |
| pm10 | 35 Moderate |
| co | 579 Good |
| o3 | 22 Good |
| so2 | 5 Good |
| index | 2020-05 | 2020-04 | 2020-03 | 2020-02 | 2020-01 | 2019-12 | 2019-11 | 2019-10 | 2019-09 | 2019-08 | 2019-07 | 2019-06 | 2019-05 | 2019-04 | 2019-03 | 2019-02 | 2019-01 | 2018-12 | 2018-11 | 2018-10 |
|---|---|---|---|---|---|---|---|---|---|---|---|---|---|---|---|---|---|---|---|---|
| pm25 | 40 (Unhealthy for Sensitive Groups) | 37 (Unhealthy for Sensitive Groups) | 37 (Unhealthy for Sensitive Groups) | 56 (Unhealthy) | 65 (Unhealthy) | 72 (Unhealthy) | 47 (Unhealthy for Sensitive Groups) | 28 (Moderate) | 27 (Moderate) | 31 (Moderate) | 27 (Moderate) | 27 (Moderate) | 36 (Unhealthy for Sensitive Groups) | 38 (Unhealthy for Sensitive Groups) | 48 (Unhealthy for Sensitive Groups) | 59 (Unhealthy) | 74 (Unhealthy) | 57 (Unhealthy) | 51 (Unhealthy for Sensitive Groups) | 39 (Unhealthy for Sensitive Groups) |
| co | 449 (Good) | 476 (Good) | 375 (Good) | 549 (Good) | 821 (Good) | 540 (Good) | 548 (Good) | 550 (Good) | 551 (Good) | 565 (Good) | 540 (Good) | 574 (Good) | 556 (Good) | 620 (Good) | 453 (Good) | 428 (Good) | 727 (Good) | 548 (Good) | 568 (Good) | 652 (Good) |
| no2 | 39 (Good) | 37 (Good) | 38 (Good) | 26 (Good) | 37 (Good) | 47 (Moderate) | 36 (Good) | 31 (Good) | 31 (Good) | 29 (Good) | 24 (Good) | 25 (Good) | 29 (Good) | 34 (Good) | 43 (Moderate) | 31 (Good) | 47 (Moderate) | 33 (Good) | 40 (Good) | 35 (Good) |
| o3 | 164 (Unhealthy) | 132 (Unhealthy for Sensitive Groups) | 109 (Moderate) | 92 (Moderate) | 71 (Moderate) | 58 (Good) | 67 (Good) | 84 (Moderate) | 99 (Moderate) | 151 (Unhealthy) | 136 (Unhealthy for Sensitive Groups) | 140 (Unhealthy for Sensitive Groups) | 124 (Unhealthy for Sensitive Groups) | 131 (Unhealthy for Sensitive Groups) | 101 (Moderate) | 77 (Moderate) | 63 (Good) | 47 (Good) | 62 (Good) | 81 (Moderate) |
| pm10 | 71 (Unhealthy for Sensitive Groups) | 59 (Unhealthy for Sensitive Groups) | 75 (Unhealthy for Sensitive Groups) | 81 (Unhealthy) | 88 (Unhealthy) | 108 (Unhealthy) | 72 (Unhealthy for Sensitive Groups) | 39 (Moderate) | 41 (Moderate) | 42 (Moderate) | 42 (Moderate) | 42 (Moderate) | 59 (Unhealthy for Sensitive Groups) | 63 (Unhealthy for Sensitive Groups) | 75 (Unhealthy for Sensitive Groups) | 83 (Unhealthy) | 109 (Unhealthy) | 96 (Unhealthy) | 83 (Unhealthy) | 68 (Unhealthy for Sensitive Groups) |
| so2 | 5.2 (Good) | 5.4 (Good) | 5.5 (Good) | 4.1 (Good) | 4.7 (Good) | 5 (Good) | 6.5 (Good) | 5.6 (Good) | 5.5 (Good) | 5.5 (Good) | 5.5 (Good) | 5.2 (Good) | 5.4 (Good) | 6.5 (Good) | 6.6 (Good) | 5.5 (Good) | 8.4 (Good) | 7.4 (Good) | 8.5 (Good) | 7.6 (Good) |
PM2,5 61 (Unhealthy)
particulate matter (PM2.5) dustNO2 22 (Good)
nitrogen dioxide (NO2)PM10 69 (Unhealthy for Sensitive Groups)
particulate matter (PM10) suspended dustCO 219 (Good)
carbon monoxide (CO)O3 0.05 (Good)
ozone (O3)SO2 7.7 (Good)
sulfur dioxide (SO2)高新区自来水公司
| index | 2022-05-27 |
|---|---|
| pm25 | 28 |
| no2 | 22 |
| pm10 | 35 |
| co | 579 |
| o3 | 22 |
| so2 | 4.6 |
高新区自来水公司
| index | 2020-05 | 2020-04 | 2020-03 | 2020-02 | 2020-01 | 2019-12 | 2019-11 | 2019-10 | 2019-09 | 2019-08 | 2019-07 | 2019-06 | 2019-05 | 2019-04 | 2019-03 | 2019-02 | 2019-01 | 2018-12 | 2018-11 | 2018-10 |
|---|---|---|---|---|---|---|---|---|---|---|---|---|---|---|---|---|---|---|---|---|
| pm25 | 40 | 37 | 37 | 56 | 65 | 72 | 47 | 28 | 27 | 31 | 27 | 27 | 36 | 38 | 48 | 59 | 74 | 57 | 51 | 39 |
| co | 449 | 476 | 375 | 549 | 821 | 540 | 548 | 550 | 551 | 565 | 540 | 574 | 556 | 620 | 453 | 428 | 727 | 548 | 568 | 652 |
| no2 | 39 | 37 | 38 | 26 | 37 | 47 | 36 | 31 | 31 | 29 | 24 | 25 | 29 | 34 | 43 | 31 | 47 | 33 | 40 | 35 |
| o3 | 164 | 132 | 109 | 92 | 71 | 58 | 67 | 84 | 99 | 151 | 136 | 140 | 124 | 131 | 101 | 77 | 63 | 47 | 62 | 81 |
| pm10 | 71 | 59 | 75 | 81 | 88 | 108 | 72 | 39 | 41 | 42 | 42 | 42 | 59 | 63 | 75 | 83 | 109 | 96 | 83 | 68 |
| so2 | 5.2 | 5.4 | 5.5 | 4.1 | 4.7 | 5 | 6.5 | 5.6 | 5.5 | 5.5 | 5.5 | 5.2 | 5.4 | 6.5 | 6.6 | 5.5 | 8.4 | 7.4 | 8.5 | 7.6 |