Air Pollution in Shangjiawan: Real-time Air Quality Index and smog alert.
Pollution and air quality forecast for Shangjiawan. Today is Tuesday, June 16, 2026. The following air pollution values have been recorded for Shangjiawan:- particulate matter (PM2.5) dust - 61 (Unhealthy)
- nitrogen dioxide (NO2) - 22 (Good)
- particulate matter (PM10) suspended dust - 69 (Unhealthy for Sensitive Groups)
- carbon monoxide (CO) - 219 (Good)
- ozone (O3) - 0 (Good)
- sulfur dioxide (SO2) - 8 (Good)

What is the air quality in Shangjiawan today? Is the air polluted in Shangjiawan?. Is there smog?
What is the current level of PM2.5 in Shangjiawan? (particulate matter (PM2.5) dust)
Today's PM2.5 level is:
61 (Unhealthy)
For comparison, the highest level of PM2.5 in Shangjiawan in the last 7 days was: 28 (Friday, May 27, 2022) and the lowest: 28 (Friday, May 27, 2022).
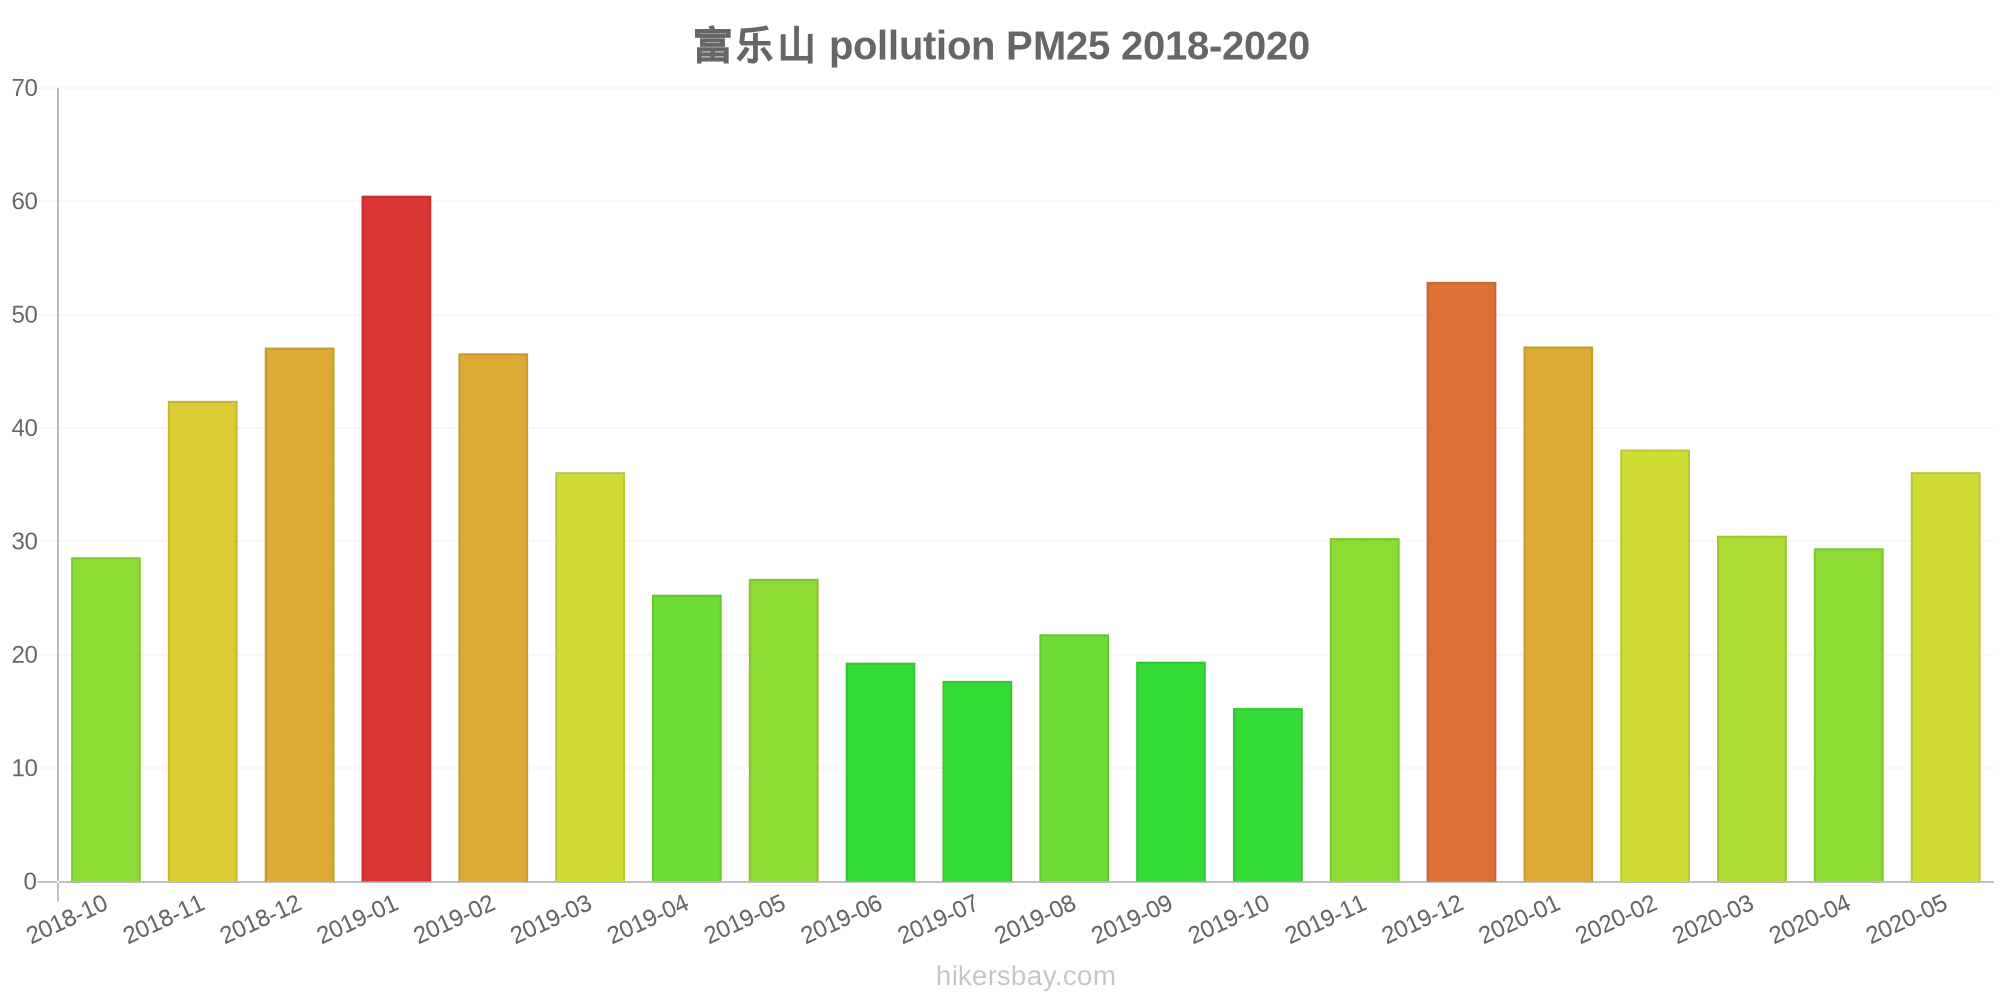
The highest PM2.5 values were recorded: 61 (January 2019).
The lowest level of particulate matter PM2.5 pollution occurs in month: October (15).
How high is the level of NO2? (nitrogen dioxide (NO2))
22 (Good)
What is the level of PM10 today in Shangjiawan? (particulate matter (PM10) suspended dust)
The current level of particulate matter PM10 in Shangjiawan is:
69 (Unhealthy for Sensitive Groups)
The highest PM10 values usually occur in month: 79 (January 2019).
The lowest value of particulate matter PM10 pollution in Shangjiawan is usually recorded in: October (26).
How high is the CO level? (carbon monoxide (CO))
219 (Good)
How is the O3 level today in Shangjiawan? (ozone (O3))
0 (Good)
What is the level of SO2 pollution? (sulfur dioxide (SO2))
8 (Good)
Current data Friday, May 27, 2022, 3:00 PM
PM2,5 61 (Unhealthy)
NO2 22 (Good)
PM10 69 (Unhealthy for Sensitive Groups)
CO 219 (Good)
O3 0 (Good)
SO2 8 (Good)
Data on air pollution from recent days in Shangjiawan
index
2022-05-27
pm25
28
Moderate
no2
22
Good
pm10
35
Moderate
co
579
Good
o3
22
Good
so2
5
Good
data source »
Air pollution in Shangjiawan from October 2018 to May 2020

index
2020-05
2020-04
2020-03
2020-02
2020-01
2019-12
2019-11
2019-10
2019-09
2019-08
2019-07
2019-06
2019-05
2019-04
2019-03
2019-02
2019-01
2018-12
2018-11
2018-10
pm25
36 (Unhealthy for Sensitive Groups)
29 (Moderate)
31 (Moderate)
38 (Unhealthy for Sensitive Groups)
47 (Unhealthy for Sensitive Groups)
53 (Unhealthy for Sensitive Groups)
30 (Moderate)
15 (Moderate)
19 (Moderate)
22 (Moderate)
18 (Moderate)
19 (Moderate)
27 (Moderate)
25 (Moderate)
36 (Unhealthy for Sensitive Groups)
47 (Unhealthy for Sensitive Groups)
61 (Unhealthy)
47 (Unhealthy for Sensitive Groups)
42 (Unhealthy for Sensitive Groups)
29 (Moderate)
co
866 (Good)
563 (Good)
697 (Good)
787 (Good)
875 (Good)
725 (Good)
703 (Good)
733 (Good)
637 (Good)
618 (Good)
624 (Good)
576 (Good)
558 (Good)
592 (Good)
472 (Good)
513 (Good)
875 (Good)
827 (Good)
813 (Good)
702 (Good)
no2
18 (Good)
19 (Good)
26 (Good)
16 (Good)
23 (Good)
27 (Good)
20 (Good)
13 (Good)
16 (Good)
17 (Good)
21 (Good)
16 (Good)
17 (Good)
13 (Good)
22 (Good)
16 (Good)
28 (Good)
19 (Good)
23 (Good)
18 (Good)
o3
167 (Unhealthy)
159 (Unhealthy)
119 (Moderate)
92 (Moderate)
78 (Moderate)
70 (Moderate)
73 (Moderate)
82 (Moderate)
96 (Moderate)
136 (Unhealthy for Sensitive Groups)
117 (Moderate)
134 (Unhealthy for Sensitive Groups)
123 (Unhealthy for Sensitive Groups)
125 (Unhealthy for Sensitive Groups)
109 (Moderate)
85 (Moderate)
76 (Moderate)
59 (Good)
72 (Moderate)
85 (Moderate)
pm10
62 (Unhealthy for Sensitive Groups)
46 (Moderate)
53 (Unhealthy for Sensitive Groups)
64 (Unhealthy for Sensitive Groups)
65 (Unhealthy for Sensitive Groups)
74 (Unhealthy for Sensitive Groups)
46 (Moderate)
26 (Moderate)
29 (Moderate)
34 (Moderate)
29 (Moderate)
33 (Moderate)
46 (Moderate)
42 (Moderate)
58 (Unhealthy for Sensitive Groups)
66 (Unhealthy for Sensitive Groups)
79 (Unhealthy for Sensitive Groups)
73 (Unhealthy for Sensitive Groups)
62 (Unhealthy for Sensitive Groups)
46 (Moderate)
so2
6.3 (Good)
5.8 (Good)
4.5 (Good)
4.5 (Good)
5.6 (Good)
5.1 (Good)
4.9 (Good)
4.7 (Good)
4.9 (Good)
5.7 (Good)
4.4 (Good)
2.7 (Good)
2.7 (Good)
3.9 (Good)
4.3 (Good)
2.6 (Good)
3.2 (Good)
2.5 (Good)
3 (Good)
2.2 (Good)
data source »
富乐山
Friday, May 27, 2022, 3:00 PM
PM2,5 61 (Unhealthy)
particulate matter (PM2.5) dust
NO2 22 (Good)
nitrogen dioxide (NO2)
PM10 69 (Unhealthy for Sensitive Groups)
particulate matter (PM10) suspended dust
CO 219 (Good)
carbon monoxide (CO)
O3 0.05 (Good)
ozone (O3)
SO2 7.7 (Good)
sulfur dioxide (SO2)
富乐山
index
2022-05-27
pm25
28
no2
22
pm10
35
co
579
o3
22
so2
4.6
富乐山
2018-10 2020-05

index
2020-05
2020-04
2020-03
2020-02
2020-01
2019-12
2019-11
2019-10
2019-09
2019-08
2019-07
2019-06
2019-05
2019-04
2019-03
2019-02
2019-01
2018-12
2018-11
2018-10
pm25
36
29
31
38
47
53
30
15
19
22
18
19
27
25
36
47
61
47
42
29
co
866
563
697
787
875
725
703
733
637
618
624
576
558
592
472
513
875
827
813
702
no2
18
19
26
16
23
27
20
13
16
17
21
16
17
13
22
16
28
19
23
18
o3
167
159
119
92
78
70
73
82
96
136
117
134
123
125
109
85
76
59
72
85
pm10
62
46
53
64
65
74
46
26
29
34
29
33
46
42
58
66
79
73
62
46
so2
6.3
5.8
4.5
4.5
5.6
5.1
4.9
4.7
4.9
5.7
4.4
2.7
2.7
3.9
4.3
2.6
3.2
2.5
3
2.2
* Pollution data source:
https://openaq.org
(ChinaAQIData)
The data is licensed under CC-By 4.0
PM2,5 61 (Unhealthy)
NO2 22 (Good)
PM10 69 (Unhealthy for Sensitive Groups)
CO 219 (Good)
O3 0 (Good)
SO2 8 (Good)
Data on air pollution from recent days in Shangjiawan
| index | 2022-05-27 |
|---|---|
| pm25 | 28 Moderate |
| no2 | 22 Good |
| pm10 | 35 Moderate |
| co | 579 Good |
| o3 | 22 Good |
| so2 | 5 Good |

| index | 2020-05 | 2020-04 | 2020-03 | 2020-02 | 2020-01 | 2019-12 | 2019-11 | 2019-10 | 2019-09 | 2019-08 | 2019-07 | 2019-06 | 2019-05 | 2019-04 | 2019-03 | 2019-02 | 2019-01 | 2018-12 | 2018-11 | 2018-10 |
|---|---|---|---|---|---|---|---|---|---|---|---|---|---|---|---|---|---|---|---|---|
| pm25 | 36 (Unhealthy for Sensitive Groups) | 29 (Moderate) | 31 (Moderate) | 38 (Unhealthy for Sensitive Groups) | 47 (Unhealthy for Sensitive Groups) | 53 (Unhealthy for Sensitive Groups) | 30 (Moderate) | 15 (Moderate) | 19 (Moderate) | 22 (Moderate) | 18 (Moderate) | 19 (Moderate) | 27 (Moderate) | 25 (Moderate) | 36 (Unhealthy for Sensitive Groups) | 47 (Unhealthy for Sensitive Groups) | 61 (Unhealthy) | 47 (Unhealthy for Sensitive Groups) | 42 (Unhealthy for Sensitive Groups) | 29 (Moderate) |
| co | 866 (Good) | 563 (Good) | 697 (Good) | 787 (Good) | 875 (Good) | 725 (Good) | 703 (Good) | 733 (Good) | 637 (Good) | 618 (Good) | 624 (Good) | 576 (Good) | 558 (Good) | 592 (Good) | 472 (Good) | 513 (Good) | 875 (Good) | 827 (Good) | 813 (Good) | 702 (Good) |
| no2 | 18 (Good) | 19 (Good) | 26 (Good) | 16 (Good) | 23 (Good) | 27 (Good) | 20 (Good) | 13 (Good) | 16 (Good) | 17 (Good) | 21 (Good) | 16 (Good) | 17 (Good) | 13 (Good) | 22 (Good) | 16 (Good) | 28 (Good) | 19 (Good) | 23 (Good) | 18 (Good) |
| o3 | 167 (Unhealthy) | 159 (Unhealthy) | 119 (Moderate) | 92 (Moderate) | 78 (Moderate) | 70 (Moderate) | 73 (Moderate) | 82 (Moderate) | 96 (Moderate) | 136 (Unhealthy for Sensitive Groups) | 117 (Moderate) | 134 (Unhealthy for Sensitive Groups) | 123 (Unhealthy for Sensitive Groups) | 125 (Unhealthy for Sensitive Groups) | 109 (Moderate) | 85 (Moderate) | 76 (Moderate) | 59 (Good) | 72 (Moderate) | 85 (Moderate) |
| pm10 | 62 (Unhealthy for Sensitive Groups) | 46 (Moderate) | 53 (Unhealthy for Sensitive Groups) | 64 (Unhealthy for Sensitive Groups) | 65 (Unhealthy for Sensitive Groups) | 74 (Unhealthy for Sensitive Groups) | 46 (Moderate) | 26 (Moderate) | 29 (Moderate) | 34 (Moderate) | 29 (Moderate) | 33 (Moderate) | 46 (Moderate) | 42 (Moderate) | 58 (Unhealthy for Sensitive Groups) | 66 (Unhealthy for Sensitive Groups) | 79 (Unhealthy for Sensitive Groups) | 73 (Unhealthy for Sensitive Groups) | 62 (Unhealthy for Sensitive Groups) | 46 (Moderate) |
| so2 | 6.3 (Good) | 5.8 (Good) | 4.5 (Good) | 4.5 (Good) | 5.6 (Good) | 5.1 (Good) | 4.9 (Good) | 4.7 (Good) | 4.9 (Good) | 5.7 (Good) | 4.4 (Good) | 2.7 (Good) | 2.7 (Good) | 3.9 (Good) | 4.3 (Good) | 2.6 (Good) | 3.2 (Good) | 2.5 (Good) | 3 (Good) | 2.2 (Good) |
PM2,5 61 (Unhealthy)
particulate matter (PM2.5) dustNO2 22 (Good)
nitrogen dioxide (NO2)PM10 69 (Unhealthy for Sensitive Groups)
particulate matter (PM10) suspended dustCO 219 (Good)
carbon monoxide (CO)O3 0.05 (Good)
ozone (O3)SO2 7.7 (Good)
sulfur dioxide (SO2)富乐山
| index | 2022-05-27 |
|---|---|
| pm25 | 28 |
| no2 | 22 |
| pm10 | 35 |
| co | 579 |
| o3 | 22 |
| so2 | 4.6 |
富乐山
| index | 2020-05 | 2020-04 | 2020-03 | 2020-02 | 2020-01 | 2019-12 | 2019-11 | 2019-10 | 2019-09 | 2019-08 | 2019-07 | 2019-06 | 2019-05 | 2019-04 | 2019-03 | 2019-02 | 2019-01 | 2018-12 | 2018-11 | 2018-10 |
|---|---|---|---|---|---|---|---|---|---|---|---|---|---|---|---|---|---|---|---|---|
| pm25 | 36 | 29 | 31 | 38 | 47 | 53 | 30 | 15 | 19 | 22 | 18 | 19 | 27 | 25 | 36 | 47 | 61 | 47 | 42 | 29 |
| co | 866 | 563 | 697 | 787 | 875 | 725 | 703 | 733 | 637 | 618 | 624 | 576 | 558 | 592 | 472 | 513 | 875 | 827 | 813 | 702 |
| no2 | 18 | 19 | 26 | 16 | 23 | 27 | 20 | 13 | 16 | 17 | 21 | 16 | 17 | 13 | 22 | 16 | 28 | 19 | 23 | 18 |
| o3 | 167 | 159 | 119 | 92 | 78 | 70 | 73 | 82 | 96 | 136 | 117 | 134 | 123 | 125 | 109 | 85 | 76 | 59 | 72 | 85 |
| pm10 | 62 | 46 | 53 | 64 | 65 | 74 | 46 | 26 | 29 | 34 | 29 | 33 | 46 | 42 | 58 | 66 | 79 | 73 | 62 | 46 |
| so2 | 6.3 | 5.8 | 4.5 | 4.5 | 5.6 | 5.1 | 4.9 | 4.7 | 4.9 | 5.7 | 4.4 | 2.7 | 2.7 | 3.9 | 4.3 | 2.6 | 3.2 | 2.5 | 3 | 2.2 |