Air Pollution in Wanjiayuan: Real-time Air Quality Index and smog alert.
Pollution and air quality forecast for Wanjiayuan. Today is Tuesday, June 16, 2026. The following air pollution values have been recorded for Wanjiayuan:- particulate matter (PM2.5) dust - 61 (Unhealthy)
- nitrogen dioxide (NO2) - 22 (Good)
- particulate matter (PM10) suspended dust - 69 (Unhealthy for Sensitive Groups)
- carbon monoxide (CO) - 219 (Good)
- ozone (O3) - 0 (Good)
- sulfur dioxide (SO2) - 8 (Good)

What is the air quality in Wanjiayuan today? Is the air polluted in Wanjiayuan?. Is there smog?
What is the current level of PM2.5 in Wanjiayuan? (particulate matter (PM2.5) dust)
Today's PM2.5 level is:
61 (Unhealthy)
For comparison, the highest level of PM2.5 in Wanjiayuan in the last 7 days was: 28 (Friday, May 27, 2022) and the lowest: 28 (Friday, May 27, 2022).
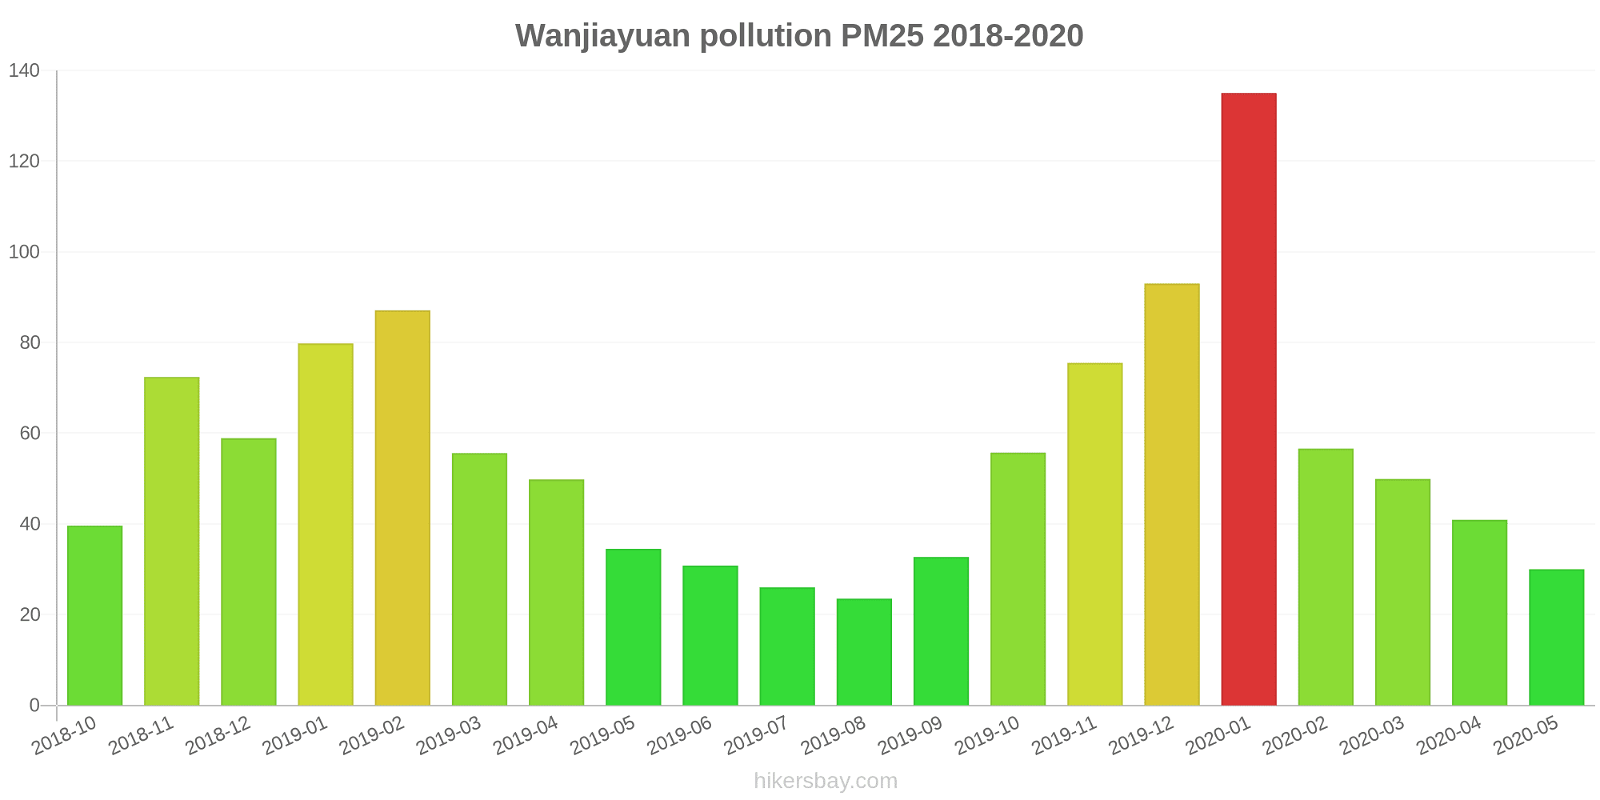
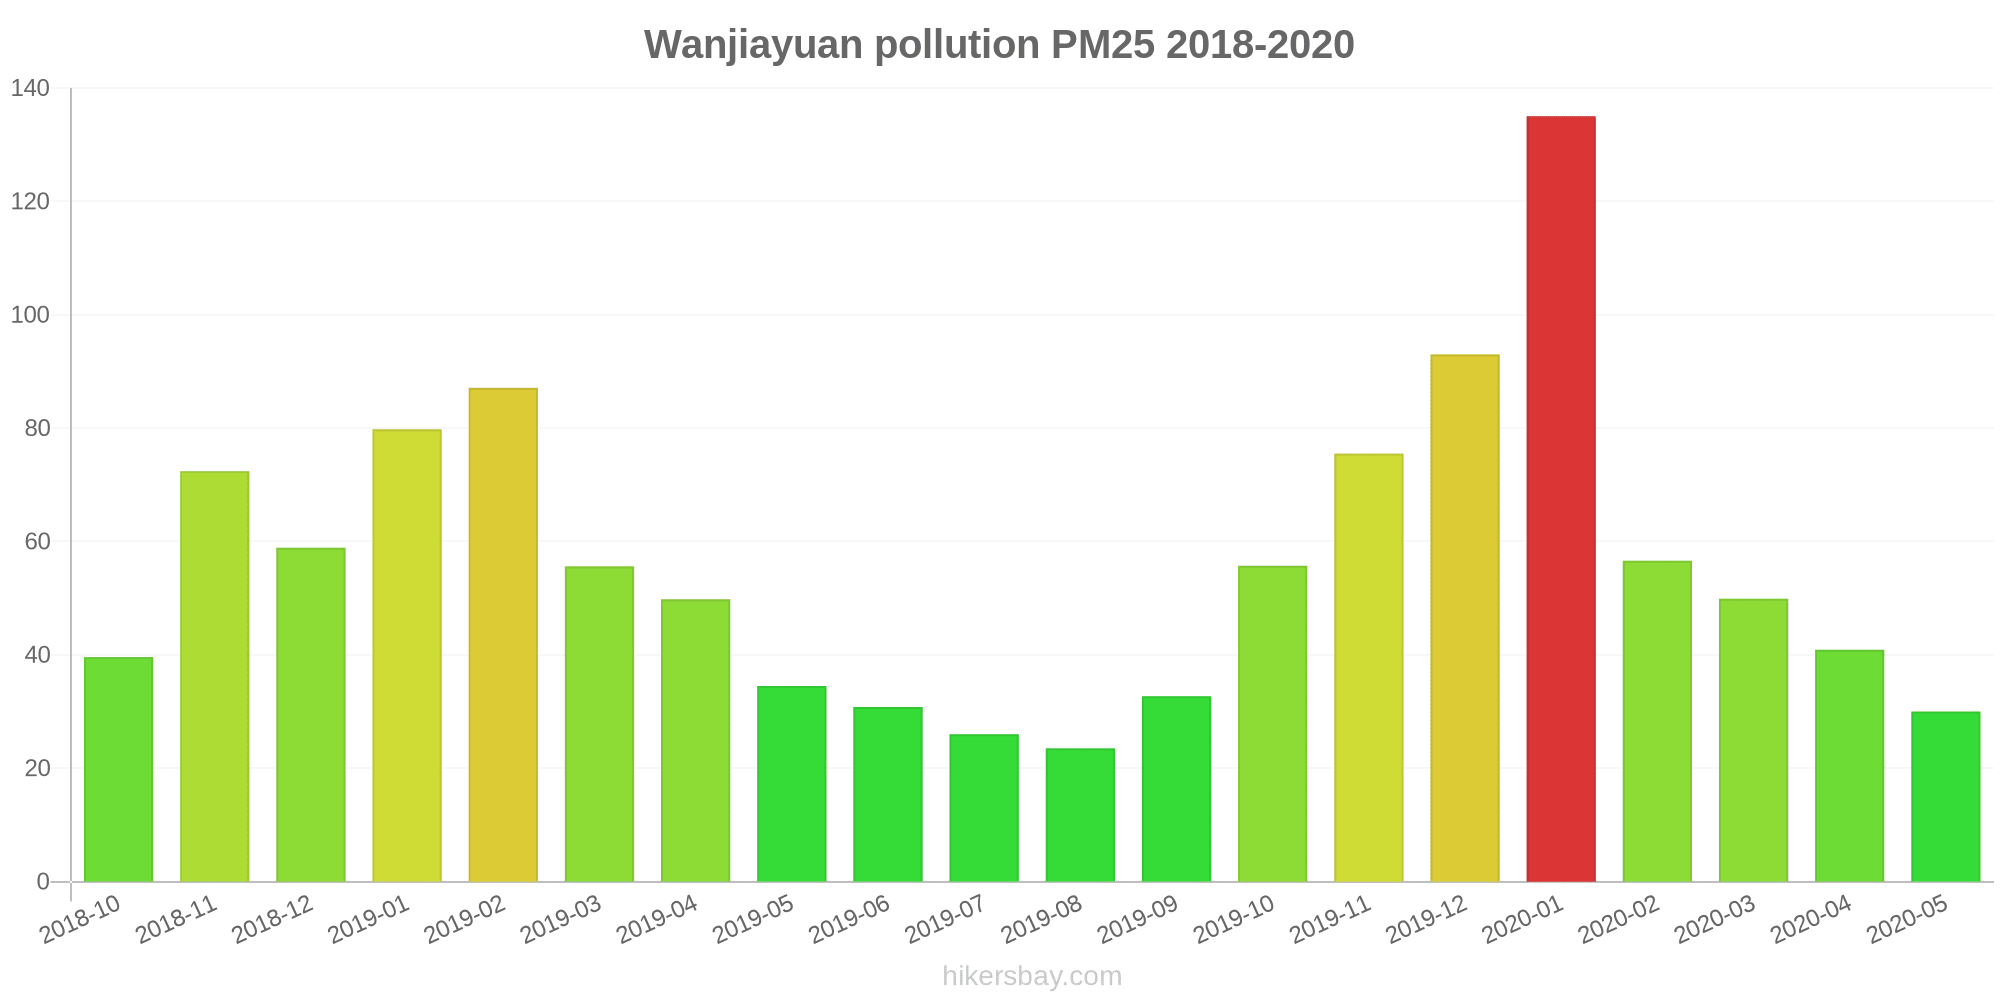
The highest PM2.5 values were recorded: 135 (January 2020).
The lowest level of particulate matter PM2.5 pollution occurs in month: August (24).
How high is the level of NO2? (nitrogen dioxide (NO2))
22 (Good)
What is the level of PM10 today in Wanjiayuan? (particulate matter (PM10) suspended dust)
The current level of particulate matter PM10 in Wanjiayuan is:
69 (Unhealthy for Sensitive Groups)
The highest PM10 values usually occur in month: 149 (January 2019).
The lowest value of particulate matter PM10 pollution in Wanjiayuan is usually recorded in: August (53).
How high is the CO level? (carbon monoxide (CO))
219 (Good)
How is the O3 level today in Wanjiayuan? (ozone (O3))
0 (Good)
What is the level of SO2 pollution? (sulfur dioxide (SO2))
8 (Good)
Current data Friday, May 27, 2022, 3:00 PM
PM2,5 61 (Unhealthy)
NO2 22 (Good)
PM10 69 (Unhealthy for Sensitive Groups)
CO 219 (Good)
O3 0 (Good)
SO2 8 (Good)
Data on air pollution from recent days in Wanjiayuan
index
2022-05-27
pm25
28
Moderate
no2
22
Good
pm10
35
Moderate
co
579
Good
o3
22
Good
so2
5
Good
data source »
Air pollution in Wanjiayuan from October 2018 to May 2020
index
2020-05
2020-04
2020-03
2020-02
2020-01
2019-12
2019-11
2019-10
2019-09
2019-08
2019-07
2019-06
2019-05
2019-04
2019-03
2019-02
2019-01
2018-12
2018-11
2018-10
pm25
30 (Moderate)
41 (Unhealthy for Sensitive Groups)
50 (Unhealthy for Sensitive Groups)
57 (Unhealthy)
135 (Very bad Hazardous)
93 (Very Unhealthy)
76 (Very Unhealthy)
56 (Unhealthy)
33 (Moderate)
24 (Moderate)
26 (Moderate)
31 (Moderate)
35 (Moderate)
50 (Unhealthy for Sensitive Groups)
56 (Unhealthy)
87 (Very Unhealthy)
80 (Very Unhealthy)
59 (Unhealthy)
72 (Unhealthy)
40 (Unhealthy for Sensitive Groups)
co
645 (Good)
618 (Good)
670 (Good)
825 (Good)
1 (Good)
977 (Good)
850 (Good)
657 (Good)
625 (Good)
687 (Good)
572 (Good)
598 (Good)
589 (Good)
670 (Good)
599 (Good)
933 (Good)
1 (Good)
1 (Good)
1 (Good)
785 (Good)
no2
21 (Good)
30 (Good)
28 (Good)
19 (Good)
36 (Good)
43 (Moderate)
45 (Moderate)
45 (Moderate)
28 (Good)
20 (Good)
15 (Good)
20 (Good)
22 (Good)
25 (Good)
34 (Good)
33 (Good)
48 (Moderate)
41 (Moderate)
43 (Moderate)
44 (Moderate)
o3
135 (Unhealthy for Sensitive Groups)
137 (Unhealthy for Sensitive Groups)
110 (Moderate)
87 (Moderate)
73 (Moderate)
60 (Good)
97 (Moderate)
122 (Unhealthy for Sensitive Groups)
161 (Unhealthy)
142 (Unhealthy for Sensitive Groups)
159 (Unhealthy)
170 (Unhealthy)
138 (Unhealthy for Sensitive Groups)
116 (Moderate)
113 (Moderate)
93 (Moderate)
63 (Good)
51 (Good)
83 (Moderate)
97 (Moderate)
pm10
63 (Unhealthy for Sensitive Groups)
79 (Unhealthy for Sensitive Groups)
81 (Unhealthy)
68 (Unhealthy for Sensitive Groups)
143 (Very Unhealthy)
106 (Unhealthy)
125 (Very Unhealthy)
111 (Very Unhealthy)
73 (Unhealthy for Sensitive Groups)
53 (Unhealthy for Sensitive Groups)
53 (Unhealthy for Sensitive Groups)
73 (Unhealthy for Sensitive Groups)
85 (Unhealthy)
85 (Unhealthy)
99 (Unhealthy)
124 (Very Unhealthy)
149 (Very Unhealthy)
128 (Very Unhealthy)
137 (Very Unhealthy)
99 (Unhealthy)
so2
7.1 (Good)
11 (Good)
8.7 (Good)
5.3 (Good)
8.1 (Good)
8.4 (Good)
16 (Good)
15 (Good)
13 (Good)
12 (Good)
8.9 (Good)
7.9 (Good)
8.1 (Good)
8 (Good)
11 (Good)
18 (Good)
27 (Good)
25 (Good)
20 (Good)
19 (Good)
data source »
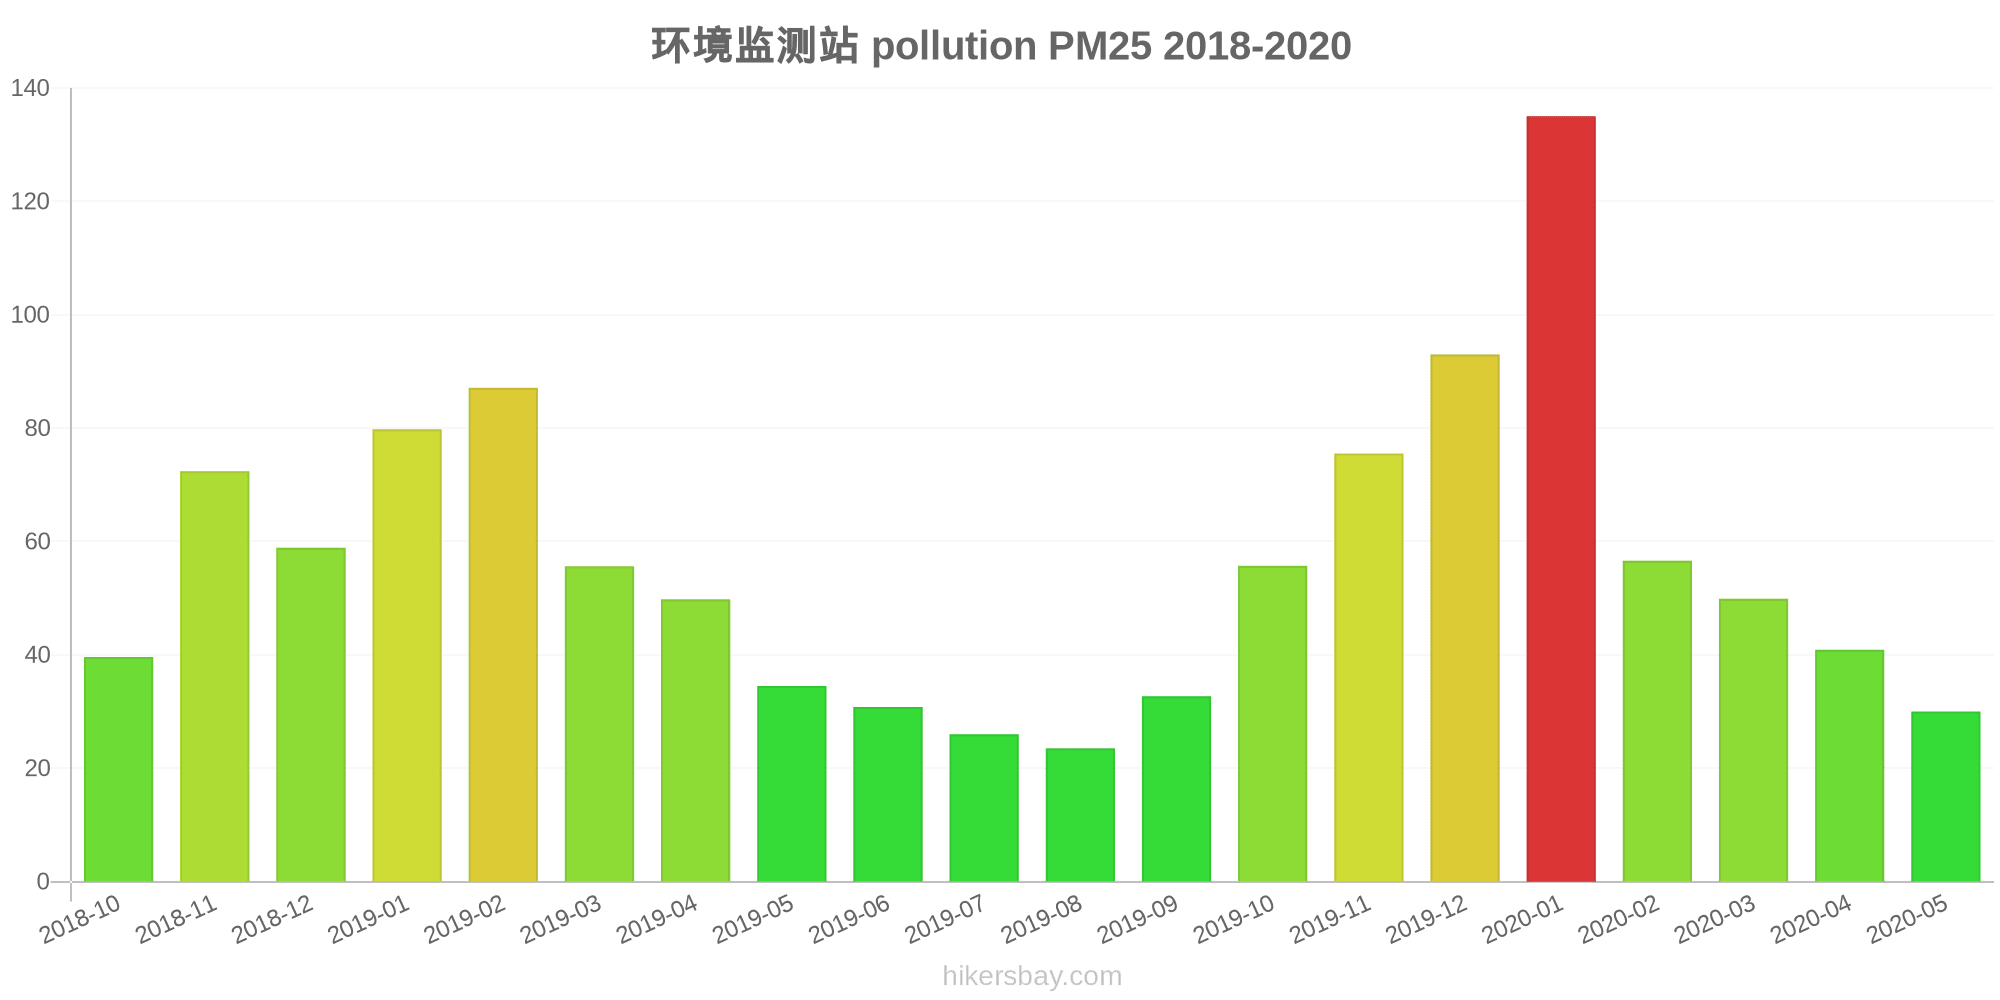
环境监测站
Friday, May 27, 2022, 3:00 PM
PM2,5 61 (Unhealthy)
particulate matter (PM2.5) dust
NO2 22 (Good)
nitrogen dioxide (NO2)
PM10 69 (Unhealthy for Sensitive Groups)
particulate matter (PM10) suspended dust
CO 219 (Good)
carbon monoxide (CO)
O3 0.05 (Good)
ozone (O3)
SO2 7.7 (Good)
sulfur dioxide (SO2)
环境监测站
index
2022-05-27
pm25
28
no2
22
pm10
35
co
579
o3
22
so2
4.6
环境监测站
2018-10 2020-05

index
2020-05
2020-04
2020-03
2020-02
2020-01
2019-12
2019-11
2019-10
2019-09
2019-08
2019-07
2019-06
2019-05
2019-04
2019-03
2019-02
2019-01
2018-12
2018-11
2018-10
pm25
30
41
50
57
135
93
76
56
33
24
26
31
35
50
56
87
80
59
72
40
co
645
618
670
825
1
977
850
657
625
687
572
598
589
670
599
933
1
1
1
785
no2
21
30
28
19
36
43
45
45
28
20
15
20
22
25
34
33
48
41
43
44
o3
135
137
110
87
73
60
97
122
161
142
159
170
138
116
113
93
63
51
83
97
pm10
63
79
81
68
143
106
125
111
73
53
53
73
85
85
99
124
149
128
137
99
so2
7.1
11
8.7
5.3
8.1
8.4
16
15
13
12
8.9
7.9
8.1
8
11
18
27
25
20
19
* Pollution data source:
https://openaq.org
(ChinaAQIData)
The data is licensed under CC-By 4.0
PM2,5 61 (Unhealthy)
NO2 22 (Good)
PM10 69 (Unhealthy for Sensitive Groups)
CO 219 (Good)
O3 0 (Good)
SO2 8 (Good)
Data on air pollution from recent days in Wanjiayuan
| index | 2022-05-27 |
|---|---|
| pm25 | 28 Moderate |
| no2 | 22 Good |
| pm10 | 35 Moderate |
| co | 579 Good |
| o3 | 22 Good |
| so2 | 5 Good |
| index | 2020-05 | 2020-04 | 2020-03 | 2020-02 | 2020-01 | 2019-12 | 2019-11 | 2019-10 | 2019-09 | 2019-08 | 2019-07 | 2019-06 | 2019-05 | 2019-04 | 2019-03 | 2019-02 | 2019-01 | 2018-12 | 2018-11 | 2018-10 |
|---|---|---|---|---|---|---|---|---|---|---|---|---|---|---|---|---|---|---|---|---|
| pm25 | 30 (Moderate) | 41 (Unhealthy for Sensitive Groups) | 50 (Unhealthy for Sensitive Groups) | 57 (Unhealthy) | 135 (Very bad Hazardous) | 93 (Very Unhealthy) | 76 (Very Unhealthy) | 56 (Unhealthy) | 33 (Moderate) | 24 (Moderate) | 26 (Moderate) | 31 (Moderate) | 35 (Moderate) | 50 (Unhealthy for Sensitive Groups) | 56 (Unhealthy) | 87 (Very Unhealthy) | 80 (Very Unhealthy) | 59 (Unhealthy) | 72 (Unhealthy) | 40 (Unhealthy for Sensitive Groups) |
| co | 645 (Good) | 618 (Good) | 670 (Good) | 825 (Good) | 1 (Good) | 977 (Good) | 850 (Good) | 657 (Good) | 625 (Good) | 687 (Good) | 572 (Good) | 598 (Good) | 589 (Good) | 670 (Good) | 599 (Good) | 933 (Good) | 1 (Good) | 1 (Good) | 1 (Good) | 785 (Good) |
| no2 | 21 (Good) | 30 (Good) | 28 (Good) | 19 (Good) | 36 (Good) | 43 (Moderate) | 45 (Moderate) | 45 (Moderate) | 28 (Good) | 20 (Good) | 15 (Good) | 20 (Good) | 22 (Good) | 25 (Good) | 34 (Good) | 33 (Good) | 48 (Moderate) | 41 (Moderate) | 43 (Moderate) | 44 (Moderate) |
| o3 | 135 (Unhealthy for Sensitive Groups) | 137 (Unhealthy for Sensitive Groups) | 110 (Moderate) | 87 (Moderate) | 73 (Moderate) | 60 (Good) | 97 (Moderate) | 122 (Unhealthy for Sensitive Groups) | 161 (Unhealthy) | 142 (Unhealthy for Sensitive Groups) | 159 (Unhealthy) | 170 (Unhealthy) | 138 (Unhealthy for Sensitive Groups) | 116 (Moderate) | 113 (Moderate) | 93 (Moderate) | 63 (Good) | 51 (Good) | 83 (Moderate) | 97 (Moderate) |
| pm10 | 63 (Unhealthy for Sensitive Groups) | 79 (Unhealthy for Sensitive Groups) | 81 (Unhealthy) | 68 (Unhealthy for Sensitive Groups) | 143 (Very Unhealthy) | 106 (Unhealthy) | 125 (Very Unhealthy) | 111 (Very Unhealthy) | 73 (Unhealthy for Sensitive Groups) | 53 (Unhealthy for Sensitive Groups) | 53 (Unhealthy for Sensitive Groups) | 73 (Unhealthy for Sensitive Groups) | 85 (Unhealthy) | 85 (Unhealthy) | 99 (Unhealthy) | 124 (Very Unhealthy) | 149 (Very Unhealthy) | 128 (Very Unhealthy) | 137 (Very Unhealthy) | 99 (Unhealthy) |
| so2 | 7.1 (Good) | 11 (Good) | 8.7 (Good) | 5.3 (Good) | 8.1 (Good) | 8.4 (Good) | 16 (Good) | 15 (Good) | 13 (Good) | 12 (Good) | 8.9 (Good) | 7.9 (Good) | 8.1 (Good) | 8 (Good) | 11 (Good) | 18 (Good) | 27 (Good) | 25 (Good) | 20 (Good) | 19 (Good) |
PM2,5 61 (Unhealthy)
particulate matter (PM2.5) dustNO2 22 (Good)
nitrogen dioxide (NO2)PM10 69 (Unhealthy for Sensitive Groups)
particulate matter (PM10) suspended dustCO 219 (Good)
carbon monoxide (CO)O3 0.05 (Good)
ozone (O3)SO2 7.7 (Good)
sulfur dioxide (SO2)环境监测站
| index | 2022-05-27 |
|---|---|
| pm25 | 28 |
| no2 | 22 |
| pm10 | 35 |
| co | 579 |
| o3 | 22 |
| so2 | 4.6 |
环境监测站
| index | 2020-05 | 2020-04 | 2020-03 | 2020-02 | 2020-01 | 2019-12 | 2019-11 | 2019-10 | 2019-09 | 2019-08 | 2019-07 | 2019-06 | 2019-05 | 2019-04 | 2019-03 | 2019-02 | 2019-01 | 2018-12 | 2018-11 | 2018-10 |
|---|---|---|---|---|---|---|---|---|---|---|---|---|---|---|---|---|---|---|---|---|
| pm25 | 30 | 41 | 50 | 57 | 135 | 93 | 76 | 56 | 33 | 24 | 26 | 31 | 35 | 50 | 56 | 87 | 80 | 59 | 72 | 40 |
| co | 645 | 618 | 670 | 825 | 1 | 977 | 850 | 657 | 625 | 687 | 572 | 598 | 589 | 670 | 599 | 933 | 1 | 1 | 1 | 785 |
| no2 | 21 | 30 | 28 | 19 | 36 | 43 | 45 | 45 | 28 | 20 | 15 | 20 | 22 | 25 | 34 | 33 | 48 | 41 | 43 | 44 |
| o3 | 135 | 137 | 110 | 87 | 73 | 60 | 97 | 122 | 161 | 142 | 159 | 170 | 138 | 116 | 113 | 93 | 63 | 51 | 83 | 97 |
| pm10 | 63 | 79 | 81 | 68 | 143 | 106 | 125 | 111 | 73 | 53 | 53 | 73 | 85 | 85 | 99 | 124 | 149 | 128 | 137 | 99 |
| so2 | 7.1 | 11 | 8.7 | 5.3 | 8.1 | 8.4 | 16 | 15 | 13 | 12 | 8.9 | 7.9 | 8.1 | 8 | 11 | 18 | 27 | 25 | 20 | 19 |