Air Pollution in Jindaoying: Real-time Air Quality Index and smog alert.
Pollution and air quality forecast for Jindaoying. Today is Tuesday, June 16, 2026. The following air pollution values have been recorded for Jindaoying:- particulate matter (PM2.5) dust - 61 (Unhealthy)
- nitrogen dioxide (NO2) - 22 (Good)
- particulate matter (PM10) suspended dust - 69 (Unhealthy for Sensitive Groups)
- carbon monoxide (CO) - 219 (Good)
- ozone (O3) - 0 (Good)
- sulfur dioxide (SO2) - 8 (Good)

What is the air quality in Jindaoying today? Is the air polluted in Jindaoying?. Is there smog?
What is the current level of PM2.5 in Jindaoying? (particulate matter (PM2.5) dust)
Today's PM2.5 level is:
61 (Unhealthy)
For comparison, the highest level of PM2.5 in Jindaoying in the last 7 days was: 28 (Friday, May 27, 2022) and the lowest: 28 (Friday, May 27, 2022).
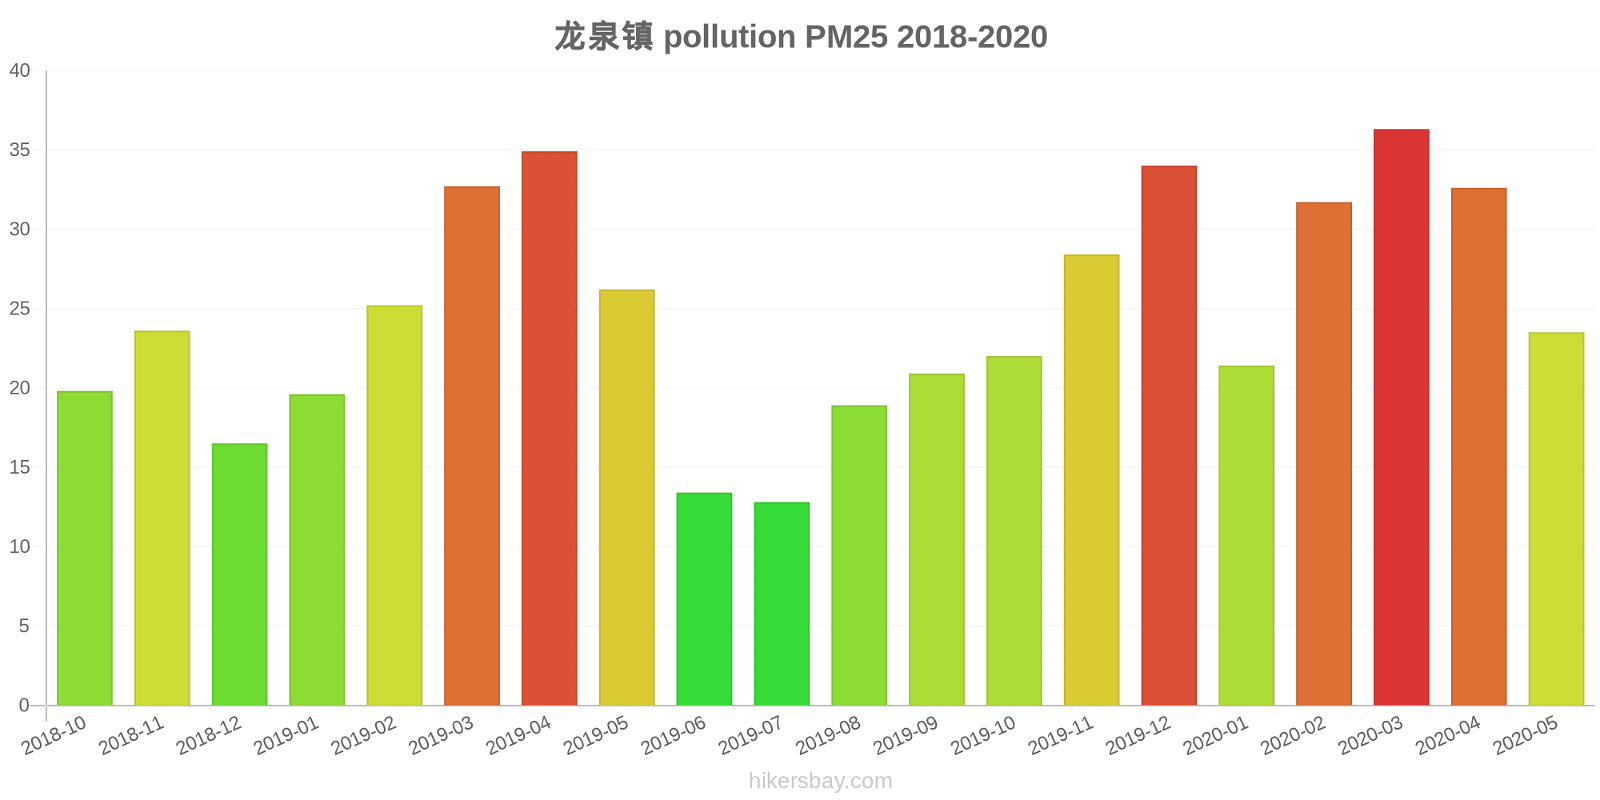
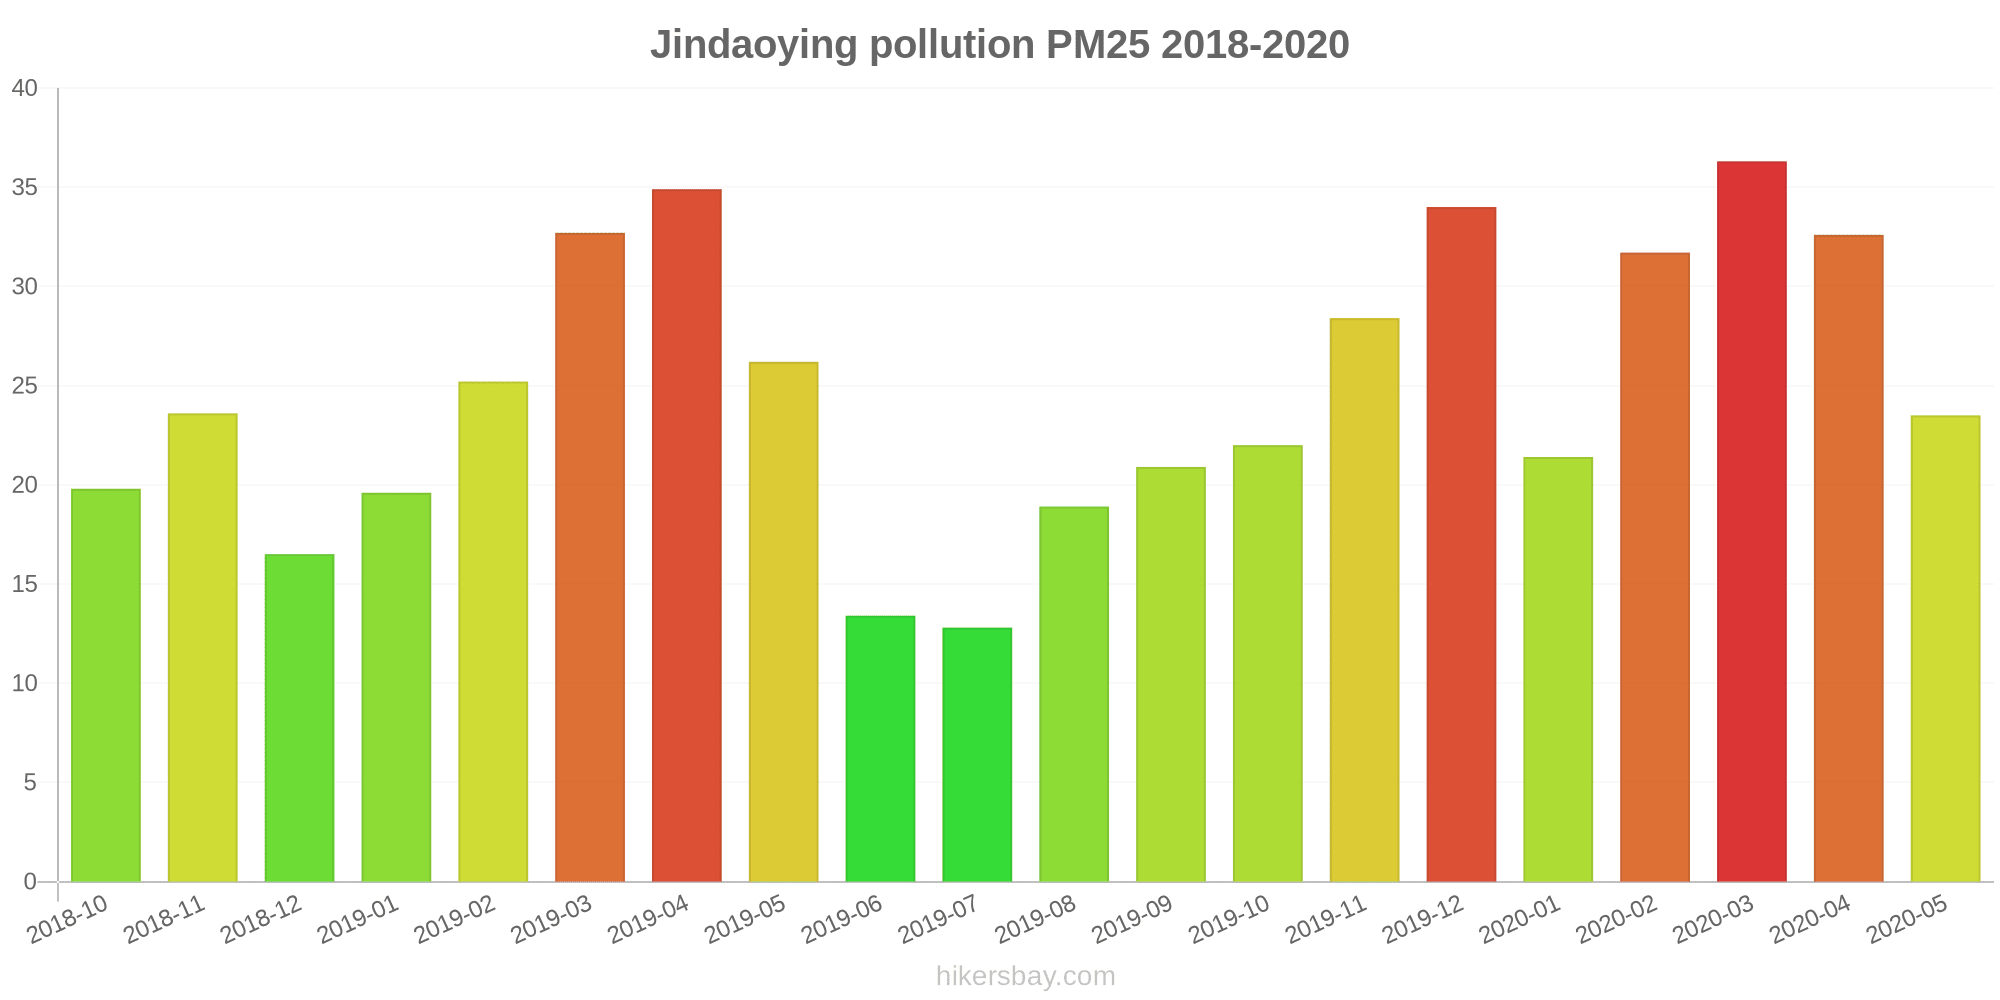
The highest PM2.5 values were recorded: 36 (March 2020).
The lowest level of particulate matter PM2.5 pollution occurs in month: July (13).
How high is the level of NO2? (nitrogen dioxide (NO2))
22 (Good)
What is the level of PM10 today in Jindaoying? (particulate matter (PM10) suspended dust)
The current level of particulate matter PM10 in Jindaoying is:
69 (Unhealthy for Sensitive Groups)
The highest PM10 values usually occur in month: 66 (December 2019).
The lowest value of particulate matter PM10 pollution in Jindaoying is usually recorded in: July (24).
How high is the CO level? (carbon monoxide (CO))
219 (Good)
How is the O3 level today in Jindaoying? (ozone (O3))
0 (Good)
What is the level of SO2 pollution? (sulfur dioxide (SO2))
8 (Good)
Current data Friday, May 27, 2022, 3:00 PM
PM2,5 61 (Unhealthy)
NO2 22 (Good)
PM10 69 (Unhealthy for Sensitive Groups)
CO 219 (Good)
O3 0 (Good)
SO2 8 (Good)
Data on air pollution from recent days in Jindaoying
index
2022-05-27
pm25
28
Moderate
no2
22
Good
pm10
35
Moderate
co
579
Good
o3
22
Good
so2
5
Good
data source »
Air pollution in Jindaoying from October 2018 to May 2020

index
2020-05
2020-04
2020-03
2020-02
2020-01
2019-12
2019-11
2019-10
2019-09
2019-08
2019-07
2019-06
2019-05
2019-04
2019-03
2019-02
2019-01
2018-12
2018-11
2018-10
pm25
24 (Moderate)
33 (Moderate)
36 (Unhealthy for Sensitive Groups)
32 (Moderate)
21 (Moderate)
34 (Moderate)
28 (Moderate)
22 (Moderate)
21 (Moderate)
19 (Moderate)
13 (Good)
13 (Moderate)
26 (Moderate)
35 (Moderate)
33 (Moderate)
25 (Moderate)
20 (Moderate)
17 (Moderate)
24 (Moderate)
20 (Moderate)
co
556 (Good)
694 (Good)
661 (Good)
669 (Good)
768 (Good)
965 (Good)
851 (Good)
769 (Good)
630 (Good)
621 (Good)
612 (Good)
504 (Good)
635 (Good)
752 (Good)
726 (Good)
736 (Good)
1 (Good)
871 (Good)
971 (Good)
922 (Good)
no2
32 (Good)
33 (Good)
33 (Good)
18 (Good)
28 (Good)
39 (Good)
36 (Good)
29 (Good)
27 (Good)
27 (Good)
21 (Good)
23 (Good)
26 (Good)
38 (Good)
38 (Good)
30 (Good)
36 (Good)
35 (Good)
39 (Good)
30 (Good)
o3
133 (Unhealthy for Sensitive Groups)
129 (Unhealthy for Sensitive Groups)
128 (Unhealthy for Sensitive Groups)
105 (Moderate)
78 (Moderate)
75 (Moderate)
83 (Moderate)
88 (Moderate)
98 (Moderate)
130 (Unhealthy for Sensitive Groups)
87 (Moderate)
105 (Moderate)
142 (Unhealthy for Sensitive Groups)
136 (Unhealthy for Sensitive Groups)
113 (Moderate)
91 (Moderate)
76 (Moderate)
64 (Good)
76 (Moderate)
73 (Moderate)
pm10
48 (Moderate)
55 (Unhealthy for Sensitive Groups)
61 (Unhealthy for Sensitive Groups)
41 (Moderate)
38 (Moderate)
66 (Unhealthy for Sensitive Groups)
57 (Unhealthy for Sensitive Groups)
39 (Moderate)
33 (Moderate)
33 (Moderate)
24 (Moderate)
25 (Moderate)
53 (Unhealthy for Sensitive Groups)
62 (Unhealthy for Sensitive Groups)
61 (Unhealthy for Sensitive Groups)
42 (Moderate)
43 (Moderate)
39 (Moderate)
56 (Unhealthy for Sensitive Groups)
46 (Moderate)
so2
9.5 (Good)
7.4 (Good)
7.8 (Good)
7.1 (Good)
11 (Good)
9.6 (Good)
11 (Good)
10 (Good)
9.2 (Good)
8.3 (Good)
8.7 (Good)
8.8 (Good)
9.4 (Good)
10 (Good)
11 (Good)
15 (Good)
12 (Good)
13 (Good)
12 (Good)
11 (Good)
data source »
龙泉镇
Friday, May 27, 2022, 3:00 PM
PM2,5 61 (Unhealthy)
particulate matter (PM2.5) dust
NO2 22 (Good)
nitrogen dioxide (NO2)
PM10 69 (Unhealthy for Sensitive Groups)
particulate matter (PM10) suspended dust
CO 219 (Good)
carbon monoxide (CO)
O3 0.05 (Good)
ozone (O3)
SO2 7.7 (Good)
sulfur dioxide (SO2)
龙泉镇
index
2022-05-27
pm25
28
no2
22
pm10
35
co
579
o3
22
so2
4.6
龙泉镇
2018-10 2020-05
index
2020-05
2020-04
2020-03
2020-02
2020-01
2019-12
2019-11
2019-10
2019-09
2019-08
2019-07
2019-06
2019-05
2019-04
2019-03
2019-02
2019-01
2018-12
2018-11
2018-10
pm25
24
33
36
32
21
34
28
22
21
19
13
13
26
35
33
25
20
17
24
20
co
556
694
661
669
768
965
851
769
630
621
612
504
635
752
726
736
1
871
971
922
no2
32
33
33
18
28
39
36
29
27
27
21
23
26
38
38
30
36
35
39
30
o3
133
129
128
105
78
75
83
88
98
130
87
105
142
136
113
91
76
64
76
73
pm10
48
55
61
41
38
66
57
39
33
33
24
25
53
62
61
42
43
39
56
46
so2
9.5
7.4
7.8
7.1
11
9.6
11
10
9.2
8.3
8.7
8.8
9.4
10
11
15
12
13
12
11
* Pollution data source:
https://openaq.org
(ChinaAQIData)
The data is licensed under CC-By 4.0
PM2,5 61 (Unhealthy)
NO2 22 (Good)
PM10 69 (Unhealthy for Sensitive Groups)
CO 219 (Good)
O3 0 (Good)
SO2 8 (Good)
Data on air pollution from recent days in Jindaoying
| index | 2022-05-27 |
|---|---|
| pm25 | 28 Moderate |
| no2 | 22 Good |
| pm10 | 35 Moderate |
| co | 579 Good |
| o3 | 22 Good |
| so2 | 5 Good |
| index | 2020-05 | 2020-04 | 2020-03 | 2020-02 | 2020-01 | 2019-12 | 2019-11 | 2019-10 | 2019-09 | 2019-08 | 2019-07 | 2019-06 | 2019-05 | 2019-04 | 2019-03 | 2019-02 | 2019-01 | 2018-12 | 2018-11 | 2018-10 |
|---|---|---|---|---|---|---|---|---|---|---|---|---|---|---|---|---|---|---|---|---|
| pm25 | 24 (Moderate) | 33 (Moderate) | 36 (Unhealthy for Sensitive Groups) | 32 (Moderate) | 21 (Moderate) | 34 (Moderate) | 28 (Moderate) | 22 (Moderate) | 21 (Moderate) | 19 (Moderate) | 13 (Good) | 13 (Moderate) | 26 (Moderate) | 35 (Moderate) | 33 (Moderate) | 25 (Moderate) | 20 (Moderate) | 17 (Moderate) | 24 (Moderate) | 20 (Moderate) |
| co | 556 (Good) | 694 (Good) | 661 (Good) | 669 (Good) | 768 (Good) | 965 (Good) | 851 (Good) | 769 (Good) | 630 (Good) | 621 (Good) | 612 (Good) | 504 (Good) | 635 (Good) | 752 (Good) | 726 (Good) | 736 (Good) | 1 (Good) | 871 (Good) | 971 (Good) | 922 (Good) |
| no2 | 32 (Good) | 33 (Good) | 33 (Good) | 18 (Good) | 28 (Good) | 39 (Good) | 36 (Good) | 29 (Good) | 27 (Good) | 27 (Good) | 21 (Good) | 23 (Good) | 26 (Good) | 38 (Good) | 38 (Good) | 30 (Good) | 36 (Good) | 35 (Good) | 39 (Good) | 30 (Good) |
| o3 | 133 (Unhealthy for Sensitive Groups) | 129 (Unhealthy for Sensitive Groups) | 128 (Unhealthy for Sensitive Groups) | 105 (Moderate) | 78 (Moderate) | 75 (Moderate) | 83 (Moderate) | 88 (Moderate) | 98 (Moderate) | 130 (Unhealthy for Sensitive Groups) | 87 (Moderate) | 105 (Moderate) | 142 (Unhealthy for Sensitive Groups) | 136 (Unhealthy for Sensitive Groups) | 113 (Moderate) | 91 (Moderate) | 76 (Moderate) | 64 (Good) | 76 (Moderate) | 73 (Moderate) |
| pm10 | 48 (Moderate) | 55 (Unhealthy for Sensitive Groups) | 61 (Unhealthy for Sensitive Groups) | 41 (Moderate) | 38 (Moderate) | 66 (Unhealthy for Sensitive Groups) | 57 (Unhealthy for Sensitive Groups) | 39 (Moderate) | 33 (Moderate) | 33 (Moderate) | 24 (Moderate) | 25 (Moderate) | 53 (Unhealthy for Sensitive Groups) | 62 (Unhealthy for Sensitive Groups) | 61 (Unhealthy for Sensitive Groups) | 42 (Moderate) | 43 (Moderate) | 39 (Moderate) | 56 (Unhealthy for Sensitive Groups) | 46 (Moderate) |
| so2 | 9.5 (Good) | 7.4 (Good) | 7.8 (Good) | 7.1 (Good) | 11 (Good) | 9.6 (Good) | 11 (Good) | 10 (Good) | 9.2 (Good) | 8.3 (Good) | 8.7 (Good) | 8.8 (Good) | 9.4 (Good) | 10 (Good) | 11 (Good) | 15 (Good) | 12 (Good) | 13 (Good) | 12 (Good) | 11 (Good) |
PM2,5 61 (Unhealthy)
particulate matter (PM2.5) dustNO2 22 (Good)
nitrogen dioxide (NO2)PM10 69 (Unhealthy for Sensitive Groups)
particulate matter (PM10) suspended dustCO 219 (Good)
carbon monoxide (CO)O3 0.05 (Good)
ozone (O3)SO2 7.7 (Good)
sulfur dioxide (SO2)龙泉镇
| index | 2022-05-27 |
|---|---|
| pm25 | 28 |
| no2 | 22 |
| pm10 | 35 |
| co | 579 |
| o3 | 22 |
| so2 | 4.6 |
龙泉镇

| index | 2020-05 | 2020-04 | 2020-03 | 2020-02 | 2020-01 | 2019-12 | 2019-11 | 2019-10 | 2019-09 | 2019-08 | 2019-07 | 2019-06 | 2019-05 | 2019-04 | 2019-03 | 2019-02 | 2019-01 | 2018-12 | 2018-11 | 2018-10 |
|---|---|---|---|---|---|---|---|---|---|---|---|---|---|---|---|---|---|---|---|---|
| pm25 | 24 | 33 | 36 | 32 | 21 | 34 | 28 | 22 | 21 | 19 | 13 | 13 | 26 | 35 | 33 | 25 | 20 | 17 | 24 | 20 |
| co | 556 | 694 | 661 | 669 | 768 | 965 | 851 | 769 | 630 | 621 | 612 | 504 | 635 | 752 | 726 | 736 | 1 | 871 | 971 | 922 |
| no2 | 32 | 33 | 33 | 18 | 28 | 39 | 36 | 29 | 27 | 27 | 21 | 23 | 26 | 38 | 38 | 30 | 36 | 35 | 39 | 30 |
| o3 | 133 | 129 | 128 | 105 | 78 | 75 | 83 | 88 | 98 | 130 | 87 | 105 | 142 | 136 | 113 | 91 | 76 | 64 | 76 | 73 |
| pm10 | 48 | 55 | 61 | 41 | 38 | 66 | 57 | 39 | 33 | 33 | 24 | 25 | 53 | 62 | 61 | 42 | 43 | 39 | 56 | 46 |
| so2 | 9.5 | 7.4 | 7.8 | 7.1 | 11 | 9.6 | 11 | 10 | 9.2 | 8.3 | 8.7 | 8.8 | 9.4 | 10 | 11 | 15 | 12 | 13 | 12 | 11 |