Air Pollution in Liaojiawan: Real-time Air Quality Index and smog alert.
Pollution and air quality forecast for Liaojiawan. Today is Thursday, June 18, 2026. The following air pollution values have been recorded for Liaojiawan:- particulate matter (PM2.5) dust - 61 (Unhealthy)
- nitrogen dioxide (NO2) - 22 (Good)
- particulate matter (PM10) suspended dust - 69 (Unhealthy for Sensitive Groups)
- carbon monoxide (CO) - 219 (Good)
- ozone (O3) - 0 (Good)
- sulfur dioxide (SO2) - 8 (Good)

What is the air quality in Liaojiawan today? Is the air polluted in Liaojiawan?. Is there smog?
What is the current level of PM2.5 in Liaojiawan? (particulate matter (PM2.5) dust)
Today's PM2.5 level is:
61 (Unhealthy)
For comparison, the highest level of PM2.5 in Liaojiawan in the last 7 days was: 28 (Friday, May 27, 2022) and the lowest: 28 (Friday, May 27, 2022).
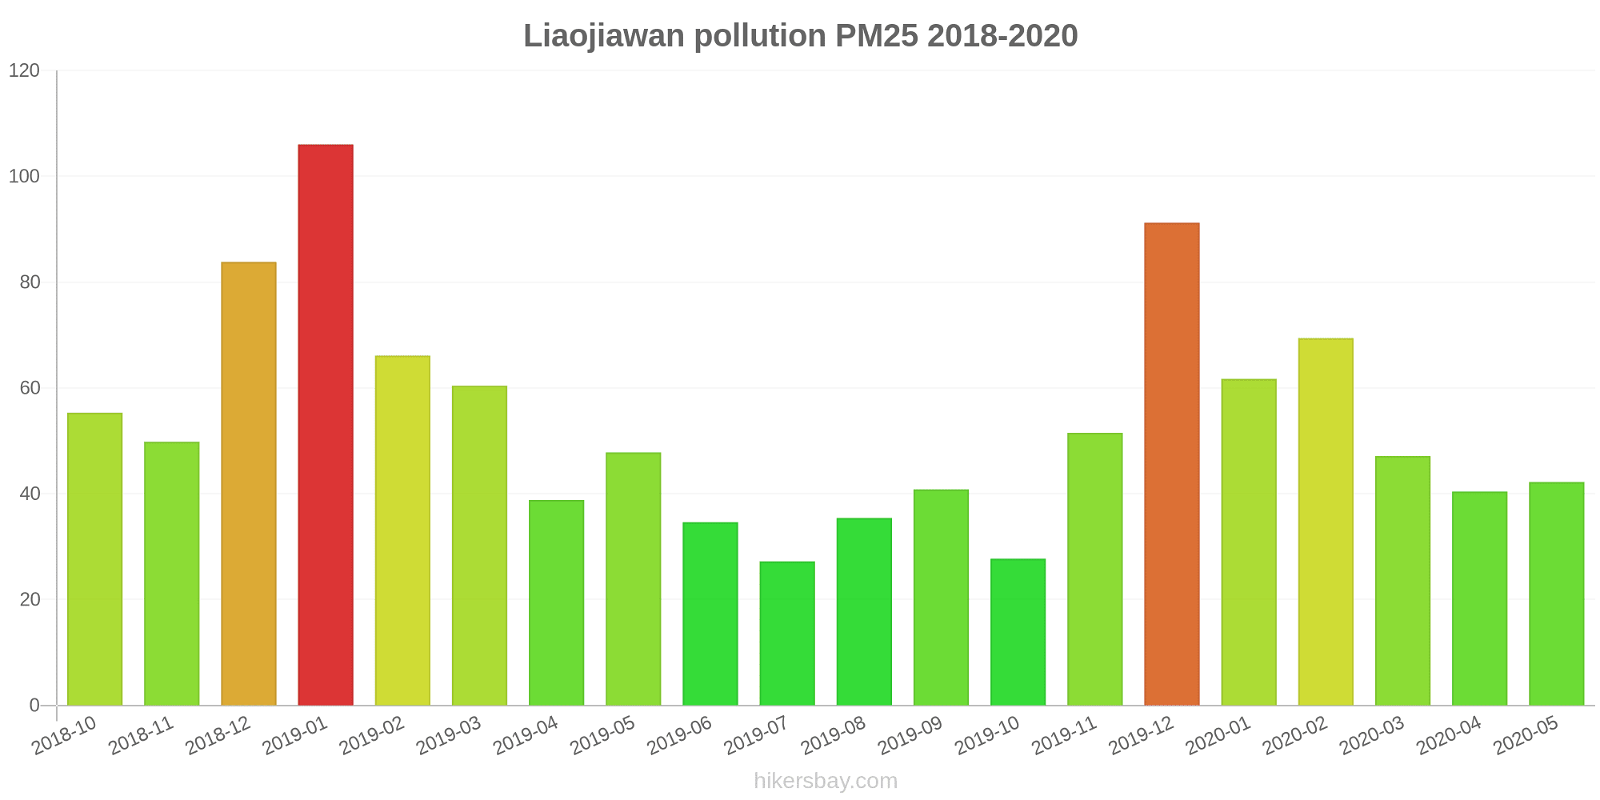
The highest PM2.5 values were recorded: 106 (January 2019).
The lowest level of particulate matter PM2.5 pollution occurs in month: July (27).
How high is the level of NO2? (nitrogen dioxide (NO2))
22 (Good)
What is the level of PM10 today in Liaojiawan? (particulate matter (PM10) suspended dust)
The current level of particulate matter PM10 in Liaojiawan is:
69 (Unhealthy for Sensitive Groups)
The highest PM10 values usually occur in month: 147 (January 2019).
The lowest value of particulate matter PM10 pollution in Liaojiawan is usually recorded in: October (46).
How high is the CO level? (carbon monoxide (CO))
219 (Good)
How is the O3 level today in Liaojiawan? (ozone (O3))
0 (Good)
What is the level of SO2 pollution? (sulfur dioxide (SO2))
8 (Good)
Current data Friday, May 27, 2022, 3:00 PM
PM2,5 61 (Unhealthy)
NO2 22 (Good)
PM10 69 (Unhealthy for Sensitive Groups)
CO 219 (Good)
O3 0 (Good)
SO2 8 (Good)
Data on air pollution from recent days in Liaojiawan
index
2022-05-27
pm25
28
Moderate
no2
22
Good
pm10
35
Moderate
co
579
Good
o3
22
Good
so2
5
Good
data source »
Air pollution in Liaojiawan from October 2018 to May 2020
index
2020-05
2020-04
2020-03
2020-02
2020-01
2019-12
2019-11
2019-10
2019-09
2019-08
2019-07
2019-06
2019-05
2019-04
2019-03
2019-02
2019-01
2018-12
2018-11
2018-10
pm25
42 (Unhealthy for Sensitive Groups)
40 (Unhealthy for Sensitive Groups)
47 (Unhealthy for Sensitive Groups)
69 (Unhealthy)
62 (Unhealthy)
91 (Very Unhealthy)
52 (Unhealthy for Sensitive Groups)
28 (Moderate)
41 (Unhealthy for Sensitive Groups)
35 (Unhealthy for Sensitive Groups)
27 (Moderate)
35 (Moderate)
48 (Unhealthy for Sensitive Groups)
39 (Unhealthy for Sensitive Groups)
60 (Unhealthy)
66 (Unhealthy)
106 (Very Unhealthy)
84 (Very Unhealthy)
50 (Unhealthy for Sensitive Groups)
55 (Unhealthy)
co
931 (Good)
935 (Good)
905 (Good)
1 (Good)
1 (Good)
1 (Good)
809 (Good)
643 (Good)
835 (Good)
731 (Good)
921 (Good)
1 (Good)
1 (Good)
963 (Good)
1 (Good)
1 (Good)
1 (Good)
1 (Good)
1 (Good)
906 (Good)
no2
38 (Good)
43 (Moderate)
37 (Good)
26 (Good)
36 (Good)
49 (Moderate)
41 (Moderate)
37 (Good)
38 (Good)
36 (Good)
38 (Good)
40 (Moderate)
44 (Moderate)
47 (Moderate)
49 (Moderate)
36 (Good)
51 (Moderate)
41 (Moderate)
35 (Good)
37 (Good)
o3
113 (Moderate)
94 (Moderate)
74 (Moderate)
60 (Good)
50 (Good)
64 (Good)
54 (Good)
74 (Moderate)
113 (Moderate)
142 (Unhealthy for Sensitive Groups)
107 (Moderate)
106 (Moderate)
107 (Moderate)
117 (Moderate)
107 (Moderate)
98 (Moderate)
75 (Moderate)
58 (Good)
64 (Good)
75 (Moderate)
pm10
79 (Unhealthy for Sensitive Groups)
71 (Unhealthy for Sensitive Groups)
80 (Unhealthy for Sensitive Groups)
87 (Unhealthy)
88 (Unhealthy)
129 (Very Unhealthy)
81 (Unhealthy)
46 (Moderate)
66 (Unhealthy for Sensitive Groups)
65 (Unhealthy for Sensitive Groups)
49 (Moderate)
54 (Unhealthy for Sensitive Groups)
77 (Unhealthy for Sensitive Groups)
70 (Unhealthy for Sensitive Groups)
98 (Unhealthy)
94 (Unhealthy)
147 (Very Unhealthy)
120 (Very Unhealthy)
76 (Unhealthy for Sensitive Groups)
87 (Unhealthy)
so2
8 (Good)
9.1 (Good)
6.4 (Good)
5.5 (Good)
6.7 (Good)
9.9 (Good)
16 (Good)
8.3 (Good)
8.4 (Good)
18 (Good)
17 (Good)
13 (Good)
17 (Good)
11 (Good)
12 (Good)
9.5 (Good)
9.7 (Good)
9.3 (Good)
7.1 (Good)
4.7 (Good)
data source »
市政中心
Friday, May 27, 2022, 3:00 PM
PM2,5 61 (Unhealthy)
particulate matter (PM2.5) dust
NO2 22 (Good)
nitrogen dioxide (NO2)
PM10 69 (Unhealthy for Sensitive Groups)
particulate matter (PM10) suspended dust
CO 219 (Good)
carbon monoxide (CO)
O3 0.05 (Good)
ozone (O3)
SO2 7.7 (Good)
sulfur dioxide (SO2)
市政中心
index
2022-05-27
pm25
28
no2
22
pm10
35
co
579
o3
22
so2
4.6
市政中心
2018-10 2020-05

index
2020-05
2020-04
2020-03
2020-02
2020-01
2019-12
2019-11
2019-10
2019-09
2019-08
2019-07
2019-06
2019-05
2019-04
2019-03
2019-02
2019-01
2018-12
2018-11
2018-10
pm25
42
40
47
69
62
91
52
28
41
35
27
35
48
39
60
66
106
84
50
55
co
931
935
905
1
1
1
809
643
835
731
921
1
1
963
1
1
1
1
1
906
no2
38
43
37
26
36
49
41
37
38
36
38
40
44
47
49
36
51
41
35
37
o3
113
94
74
60
50
64
54
74
113
142
107
106
107
117
107
98
75
58
64
75
so2
8
9.1
6.4
5.5
6.7
9.9
16
8.3
8.4
18
17
13
17
11
12
9.5
9.7
9.3
7.1
4.7
pm10
79
71
80
87
88
129
81
46
66
65
49
54
77
70
98
94
147
120
76
87
* Pollution data source:
https://openaq.org
(ChinaAQIData)
The data is licensed under CC-By 4.0
PM2,5 61 (Unhealthy)
NO2 22 (Good)
PM10 69 (Unhealthy for Sensitive Groups)
CO 219 (Good)
O3 0 (Good)
SO2 8 (Good)
Data on air pollution from recent days in Liaojiawan
| index | 2022-05-27 |
|---|---|
| pm25 | 28 Moderate |
| no2 | 22 Good |
| pm10 | 35 Moderate |
| co | 579 Good |
| o3 | 22 Good |
| so2 | 5 Good |

| index | 2020-05 | 2020-04 | 2020-03 | 2020-02 | 2020-01 | 2019-12 | 2019-11 | 2019-10 | 2019-09 | 2019-08 | 2019-07 | 2019-06 | 2019-05 | 2019-04 | 2019-03 | 2019-02 | 2019-01 | 2018-12 | 2018-11 | 2018-10 |
|---|---|---|---|---|---|---|---|---|---|---|---|---|---|---|---|---|---|---|---|---|
| pm25 | 42 (Unhealthy for Sensitive Groups) | 40 (Unhealthy for Sensitive Groups) | 47 (Unhealthy for Sensitive Groups) | 69 (Unhealthy) | 62 (Unhealthy) | 91 (Very Unhealthy) | 52 (Unhealthy for Sensitive Groups) | 28 (Moderate) | 41 (Unhealthy for Sensitive Groups) | 35 (Unhealthy for Sensitive Groups) | 27 (Moderate) | 35 (Moderate) | 48 (Unhealthy for Sensitive Groups) | 39 (Unhealthy for Sensitive Groups) | 60 (Unhealthy) | 66 (Unhealthy) | 106 (Very Unhealthy) | 84 (Very Unhealthy) | 50 (Unhealthy for Sensitive Groups) | 55 (Unhealthy) |
| co | 931 (Good) | 935 (Good) | 905 (Good) | 1 (Good) | 1 (Good) | 1 (Good) | 809 (Good) | 643 (Good) | 835 (Good) | 731 (Good) | 921 (Good) | 1 (Good) | 1 (Good) | 963 (Good) | 1 (Good) | 1 (Good) | 1 (Good) | 1 (Good) | 1 (Good) | 906 (Good) |
| no2 | 38 (Good) | 43 (Moderate) | 37 (Good) | 26 (Good) | 36 (Good) | 49 (Moderate) | 41 (Moderate) | 37 (Good) | 38 (Good) | 36 (Good) | 38 (Good) | 40 (Moderate) | 44 (Moderate) | 47 (Moderate) | 49 (Moderate) | 36 (Good) | 51 (Moderate) | 41 (Moderate) | 35 (Good) | 37 (Good) |
| o3 | 113 (Moderate) | 94 (Moderate) | 74 (Moderate) | 60 (Good) | 50 (Good) | 64 (Good) | 54 (Good) | 74 (Moderate) | 113 (Moderate) | 142 (Unhealthy for Sensitive Groups) | 107 (Moderate) | 106 (Moderate) | 107 (Moderate) | 117 (Moderate) | 107 (Moderate) | 98 (Moderate) | 75 (Moderate) | 58 (Good) | 64 (Good) | 75 (Moderate) |
| pm10 | 79 (Unhealthy for Sensitive Groups) | 71 (Unhealthy for Sensitive Groups) | 80 (Unhealthy for Sensitive Groups) | 87 (Unhealthy) | 88 (Unhealthy) | 129 (Very Unhealthy) | 81 (Unhealthy) | 46 (Moderate) | 66 (Unhealthy for Sensitive Groups) | 65 (Unhealthy for Sensitive Groups) | 49 (Moderate) | 54 (Unhealthy for Sensitive Groups) | 77 (Unhealthy for Sensitive Groups) | 70 (Unhealthy for Sensitive Groups) | 98 (Unhealthy) | 94 (Unhealthy) | 147 (Very Unhealthy) | 120 (Very Unhealthy) | 76 (Unhealthy for Sensitive Groups) | 87 (Unhealthy) |
| so2 | 8 (Good) | 9.1 (Good) | 6.4 (Good) | 5.5 (Good) | 6.7 (Good) | 9.9 (Good) | 16 (Good) | 8.3 (Good) | 8.4 (Good) | 18 (Good) | 17 (Good) | 13 (Good) | 17 (Good) | 11 (Good) | 12 (Good) | 9.5 (Good) | 9.7 (Good) | 9.3 (Good) | 7.1 (Good) | 4.7 (Good) |
PM2,5 61 (Unhealthy)
particulate matter (PM2.5) dustNO2 22 (Good)
nitrogen dioxide (NO2)PM10 69 (Unhealthy for Sensitive Groups)
particulate matter (PM10) suspended dustCO 219 (Good)
carbon monoxide (CO)O3 0.05 (Good)
ozone (O3)SO2 7.7 (Good)
sulfur dioxide (SO2)市政中心
| index | 2022-05-27 |
|---|---|
| pm25 | 28 |
| no2 | 22 |
| pm10 | 35 |
| co | 579 |
| o3 | 22 |
| so2 | 4.6 |
市政中心

| index | 2020-05 | 2020-04 | 2020-03 | 2020-02 | 2020-01 | 2019-12 | 2019-11 | 2019-10 | 2019-09 | 2019-08 | 2019-07 | 2019-06 | 2019-05 | 2019-04 | 2019-03 | 2019-02 | 2019-01 | 2018-12 | 2018-11 | 2018-10 |
|---|---|---|---|---|---|---|---|---|---|---|---|---|---|---|---|---|---|---|---|---|
| pm25 | 42 | 40 | 47 | 69 | 62 | 91 | 52 | 28 | 41 | 35 | 27 | 35 | 48 | 39 | 60 | 66 | 106 | 84 | 50 | 55 |
| co | 931 | 935 | 905 | 1 | 1 | 1 | 809 | 643 | 835 | 731 | 921 | 1 | 1 | 963 | 1 | 1 | 1 | 1 | 1 | 906 |
| no2 | 38 | 43 | 37 | 26 | 36 | 49 | 41 | 37 | 38 | 36 | 38 | 40 | 44 | 47 | 49 | 36 | 51 | 41 | 35 | 37 |
| o3 | 113 | 94 | 74 | 60 | 50 | 64 | 54 | 74 | 113 | 142 | 107 | 106 | 107 | 117 | 107 | 98 | 75 | 58 | 64 | 75 |
| so2 | 8 | 9.1 | 6.4 | 5.5 | 6.7 | 9.9 | 16 | 8.3 | 8.4 | 18 | 17 | 13 | 17 | 11 | 12 | 9.5 | 9.7 | 9.3 | 7.1 | 4.7 |
| pm10 | 79 | 71 | 80 | 87 | 88 | 129 | 81 | 46 | 66 | 65 | 49 | 54 | 77 | 70 | 98 | 94 | 147 | 120 | 76 | 87 |