Air Pollution in Qiantun: Real-time Air Quality Index and smog alert.
Pollution and air quality forecast for Qiantun. Today is Tuesday, June 2, 2026. The following air pollution values have been recorded for Qiantun:- particulate matter (PM10) suspended dust - 179 (Very bad Hazardous)
- particulate matter (PM2.5) dust - 35 (Unhealthy for Sensitive Groups)
- ozone (O3) - 0 (Good)
- nitrogen dioxide (NO2) - 0 (Good)
- sulfur dioxide (SO2) - 0 (Good)

What is the air quality in Qiantun today? Is the air polluted in Qiantun?. Is there smog?
What is the level of PM10 today in Qiantun? (particulate matter (PM10) suspended dust)
The current level of particulate matter PM10 in Qiantun is:
179 (Very bad Hazardous)
The highest PM10 values usually occur in month: 176 (January 2019).
The lowest value of particulate matter PM10 pollution in Qiantun is usually recorded in: August (51).
What is the current level of PM2.5 in Qiantun? (particulate matter (PM2.5) dust)
Today's PM2.5 level is:
35 (Unhealthy for Sensitive Groups)
For comparison, the highest level of PM2.5 in Qiantun in the last 7 days was: 56 (Friday, May 27, 2022) and the lowest: 56 (Friday, May 27, 2022).
The highest PM2.5 values were recorded: 122 (January 2019).
The lowest level of particulate matter PM2.5 pollution occurs in month: August (25).
How is the O3 level today in Qiantun? (ozone (O3))
0 (Good)
How high is the level of NO2? (nitrogen dioxide (NO2))
0 (Good)
What is the level of SO2 pollution? (sulfur dioxide (SO2))
0 (Good)
Current data Friday, May 27, 2022, 12:00 PM
PM10 179 (Very bad Hazardous)
PM2,5 35 (Unhealthy for Sensitive Groups)
O3 0 (Good)
NO2 0 (Good)
SO2 0 (Good)
Data on air pollution from recent days in Qiantun
index
2022-05-27
pm10
56
Unhealthy for Sensitive Groups
pm25
56
Unhealthy
o3
0
Good
no2
0
Good
so2
0
Good
data source »
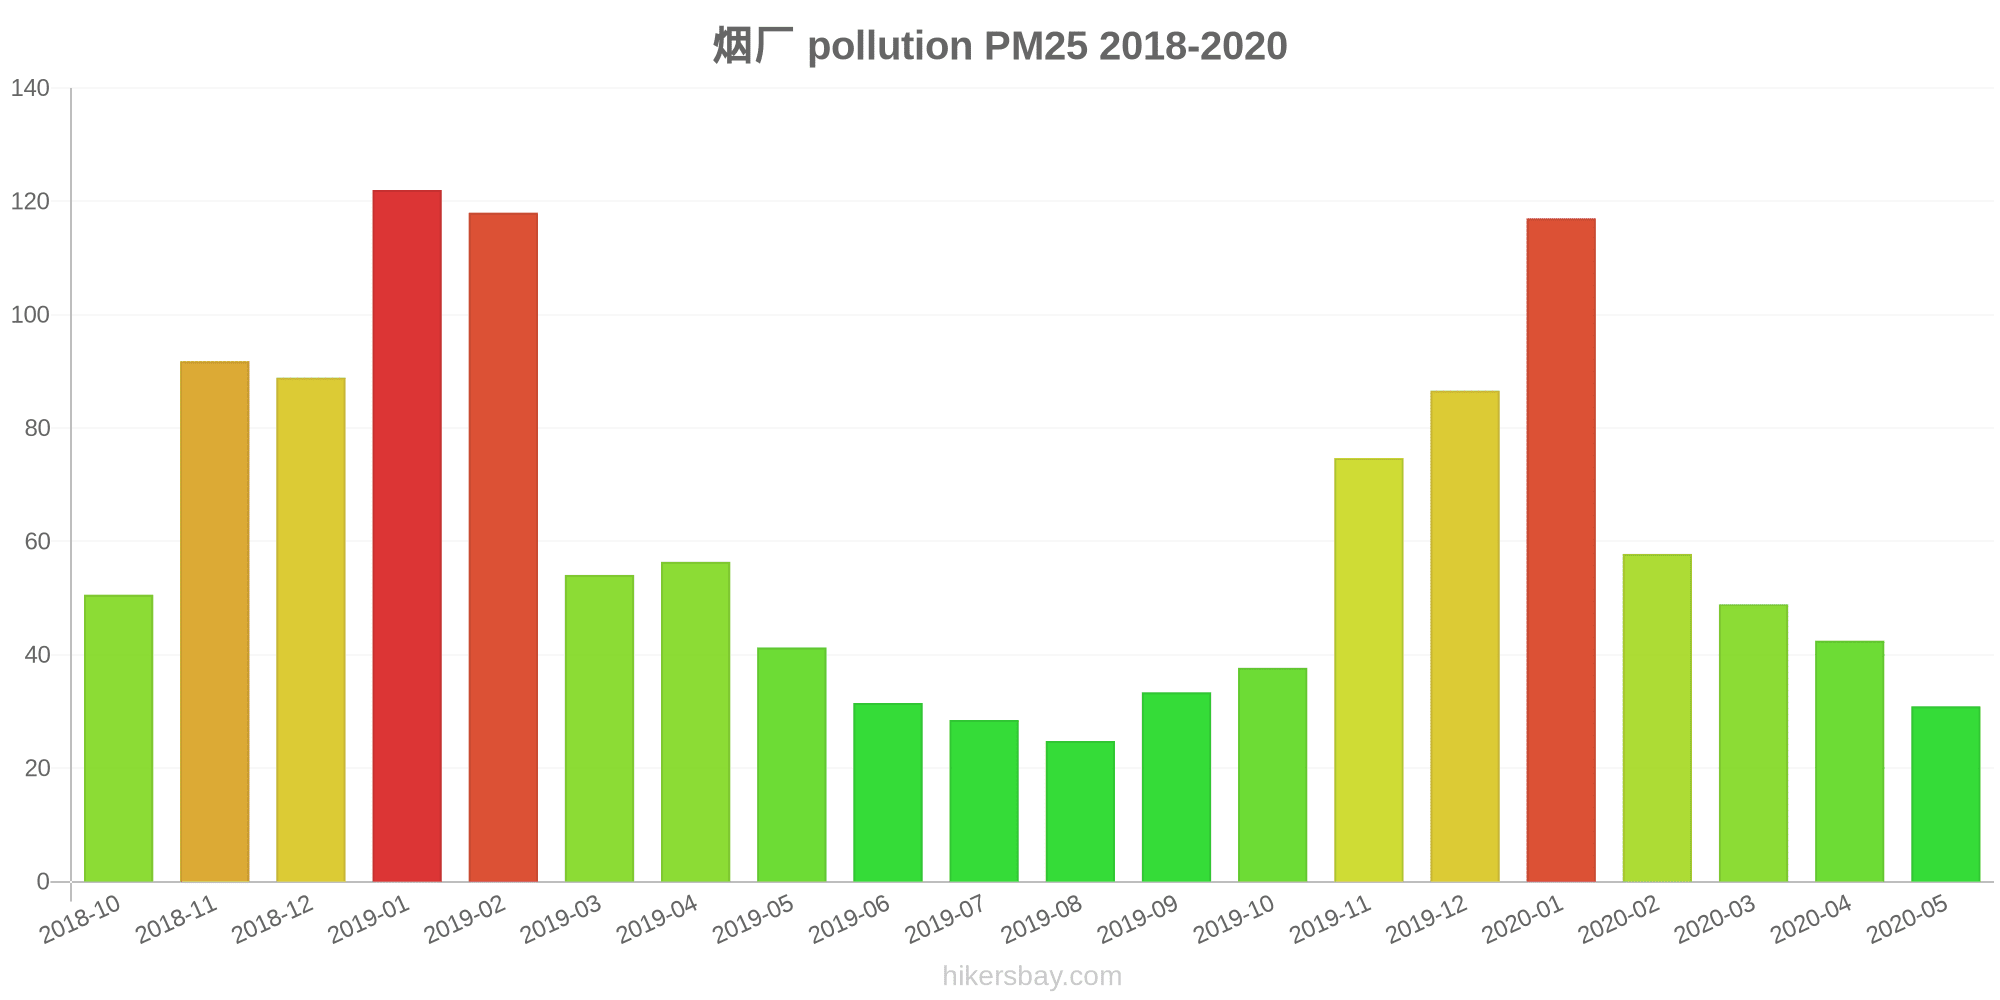
Air pollution in Qiantun from October 2018 to May 2020

index
2020-05
2020-04
2020-03
2020-02
2020-01
2019-12
2019-11
2019-10
2019-09
2019-08
2019-07
2019-06
2019-05
2019-04
2019-03
2019-02
2019-01
2018-12
2018-11
2018-10
pm25
31 (Moderate)
43 (Unhealthy for Sensitive Groups)
49 (Unhealthy for Sensitive Groups)
58 (Unhealthy)
117 (Very bad Hazardous)
87 (Very Unhealthy)
75 (Unhealthy)
38 (Unhealthy for Sensitive Groups)
33 (Moderate)
25 (Moderate)
29 (Moderate)
32 (Moderate)
41 (Unhealthy for Sensitive Groups)
56 (Unhealthy)
54 (Unhealthy for Sensitive Groups)
118 (Very bad Hazardous)
122 (Very bad Hazardous)
89 (Very Unhealthy)
92 (Very Unhealthy)
51 (Unhealthy for Sensitive Groups)
co
728 (Good)
625 (Good)
733 (Good)
701 (Good)
1 (Good)
1 (Good)
1 (Good)
954 (Good)
942 (Good)
789 (Good)
688 (Good)
623 (Good)
680 (Good)
804 (Good)
500 (Good)
1 (Good)
1 (Good)
1 (Good)
1 (Good)
917 (Good)
no2
22 (Good)
47 (Moderate)
41 (Moderate)
24 (Good)
53 (Moderate)
50 (Moderate)
56 (Moderate)
52 (Moderate)
46 (Moderate)
34 (Good)
36 (Good)
35 (Good)
39 (Good)
43 (Moderate)
49 (Moderate)
46 (Moderate)
65 (Moderate)
60 (Moderate)
58 (Moderate)
56 (Moderate)
o3
164 (Unhealthy)
148 (Unhealthy for Sensitive Groups)
127 (Unhealthy for Sensitive Groups)
109 (Moderate)
80 (Moderate)
62 (Good)
82 (Moderate)
116 (Moderate)
182 (Very Unhealthy)
174 (Unhealthy)
199 (Very Unhealthy)
189 (Very Unhealthy)
179 (Unhealthy)
141 (Unhealthy for Sensitive Groups)
126 (Unhealthy for Sensitive Groups)
93 (Moderate)
52 (Good)
43 (Good)
72 (Moderate)
102 (Moderate)
pm10
84 (Unhealthy)
96 (Unhealthy)
99 (Unhealthy)
77 (Unhealthy for Sensitive Groups)
136 (Very Unhealthy)
114 (Very Unhealthy)
126 (Very Unhealthy)
87 (Unhealthy)
66 (Unhealthy for Sensitive Groups)
51 (Unhealthy for Sensitive Groups)
61 (Unhealthy for Sensitive Groups)
79 (Unhealthy for Sensitive Groups)
112 (Very Unhealthy)
122 (Very Unhealthy)
120 (Very Unhealthy)
162 (Very bad Hazardous)
176 (Very bad Hazardous)
162 (Very bad Hazardous)
146 (Very Unhealthy)
93 (Unhealthy)
so2
10 (Good)
13 (Good)
13 (Good)
9.8 (Good)
11 (Good)
11 (Good)
14 (Good)
9.4 (Good)
6.8 (Good)
4.6 (Good)
4 (Good)
5.5 (Good)
8.3 (Good)
8.6 (Good)
10 (Good)
13 (Good)
18 (Good)
21 (Good)
17 (Good)
18 (Good)
data source »
烟厂
Friday, May 27, 2022, 12:00 PM
PM10 179 (Very bad Hazardous)
particulate matter (PM10) suspended dust
PM2,5 35 (Unhealthy for Sensitive Groups)
particulate matter (PM2.5) dust
O3 0.04 (Good)
ozone (O3)
NO2 0 (Good)
nitrogen dioxide (NO2)
SO2 0 (Good)
sulfur dioxide (SO2)
烟厂
index
2022-05-27
pm10
56
pm25
56
o3
0.03
no2
0
so2
0
烟厂
2018-10 2020-05

index
2020-05
2020-04
2020-03
2020-02
2020-01
2019-12
2019-11
2019-10
2019-09
2019-08
2019-07
2019-06
2019-05
2019-04
2019-03
2019-02
2019-01
2018-12
2018-11
2018-10
pm25
31
43
49
58
117
87
75
38
33
25
29
32
41
56
54
118
122
89
92
51
co
728
625
733
701
1
1
1
954
942
789
688
623
680
804
500
1
1
1
1
917
no2
22
47
41
24
53
50
56
52
46
34
36
35
39
43
49
46
65
60
58
56
o3
164
148
127
109
80
62
82
116
182
174
199
189
179
141
126
93
52
43
72
102
pm10
84
96
99
77
136
114
126
87
66
51
61
79
112
122
120
162
176
162
146
93
so2
10
13
13
9.8
11
11
14
9.4
6.8
4.6
4
5.5
8.3
8.6
10
13
18
21
17
18
* Pollution data source:
https://openaq.org
(ChinaAQIData)
The data is licensed under CC-By 4.0
PM10 179 (Very bad Hazardous)
PM2,5 35 (Unhealthy for Sensitive Groups)
O3 0 (Good)
NO2 0 (Good)
SO2 0 (Good)
Data on air pollution from recent days in Qiantun
| index | 2022-05-27 |
|---|---|
| pm10 | 56 Unhealthy for Sensitive Groups |
| pm25 | 56 Unhealthy |
| o3 | 0 Good |
| no2 | 0 Good |
| so2 | 0 Good |

| index | 2020-05 | 2020-04 | 2020-03 | 2020-02 | 2020-01 | 2019-12 | 2019-11 | 2019-10 | 2019-09 | 2019-08 | 2019-07 | 2019-06 | 2019-05 | 2019-04 | 2019-03 | 2019-02 | 2019-01 | 2018-12 | 2018-11 | 2018-10 |
|---|---|---|---|---|---|---|---|---|---|---|---|---|---|---|---|---|---|---|---|---|
| pm25 | 31 (Moderate) | 43 (Unhealthy for Sensitive Groups) | 49 (Unhealthy for Sensitive Groups) | 58 (Unhealthy) | 117 (Very bad Hazardous) | 87 (Very Unhealthy) | 75 (Unhealthy) | 38 (Unhealthy for Sensitive Groups) | 33 (Moderate) | 25 (Moderate) | 29 (Moderate) | 32 (Moderate) | 41 (Unhealthy for Sensitive Groups) | 56 (Unhealthy) | 54 (Unhealthy for Sensitive Groups) | 118 (Very bad Hazardous) | 122 (Very bad Hazardous) | 89 (Very Unhealthy) | 92 (Very Unhealthy) | 51 (Unhealthy for Sensitive Groups) |
| co | 728 (Good) | 625 (Good) | 733 (Good) | 701 (Good) | 1 (Good) | 1 (Good) | 1 (Good) | 954 (Good) | 942 (Good) | 789 (Good) | 688 (Good) | 623 (Good) | 680 (Good) | 804 (Good) | 500 (Good) | 1 (Good) | 1 (Good) | 1 (Good) | 1 (Good) | 917 (Good) |
| no2 | 22 (Good) | 47 (Moderate) | 41 (Moderate) | 24 (Good) | 53 (Moderate) | 50 (Moderate) | 56 (Moderate) | 52 (Moderate) | 46 (Moderate) | 34 (Good) | 36 (Good) | 35 (Good) | 39 (Good) | 43 (Moderate) | 49 (Moderate) | 46 (Moderate) | 65 (Moderate) | 60 (Moderate) | 58 (Moderate) | 56 (Moderate) |
| o3 | 164 (Unhealthy) | 148 (Unhealthy for Sensitive Groups) | 127 (Unhealthy for Sensitive Groups) | 109 (Moderate) | 80 (Moderate) | 62 (Good) | 82 (Moderate) | 116 (Moderate) | 182 (Very Unhealthy) | 174 (Unhealthy) | 199 (Very Unhealthy) | 189 (Very Unhealthy) | 179 (Unhealthy) | 141 (Unhealthy for Sensitive Groups) | 126 (Unhealthy for Sensitive Groups) | 93 (Moderate) | 52 (Good) | 43 (Good) | 72 (Moderate) | 102 (Moderate) |
| pm10 | 84 (Unhealthy) | 96 (Unhealthy) | 99 (Unhealthy) | 77 (Unhealthy for Sensitive Groups) | 136 (Very Unhealthy) | 114 (Very Unhealthy) | 126 (Very Unhealthy) | 87 (Unhealthy) | 66 (Unhealthy for Sensitive Groups) | 51 (Unhealthy for Sensitive Groups) | 61 (Unhealthy for Sensitive Groups) | 79 (Unhealthy for Sensitive Groups) | 112 (Very Unhealthy) | 122 (Very Unhealthy) | 120 (Very Unhealthy) | 162 (Very bad Hazardous) | 176 (Very bad Hazardous) | 162 (Very bad Hazardous) | 146 (Very Unhealthy) | 93 (Unhealthy) |
| so2 | 10 (Good) | 13 (Good) | 13 (Good) | 9.8 (Good) | 11 (Good) | 11 (Good) | 14 (Good) | 9.4 (Good) | 6.8 (Good) | 4.6 (Good) | 4 (Good) | 5.5 (Good) | 8.3 (Good) | 8.6 (Good) | 10 (Good) | 13 (Good) | 18 (Good) | 21 (Good) | 17 (Good) | 18 (Good) |
PM10 179 (Very bad Hazardous)
particulate matter (PM10) suspended dustPM2,5 35 (Unhealthy for Sensitive Groups)
particulate matter (PM2.5) dustO3 0.04 (Good)
ozone (O3)NO2 0 (Good)
nitrogen dioxide (NO2)SO2 0 (Good)
sulfur dioxide (SO2)烟厂
| index | 2022-05-27 |
|---|---|
| pm10 | 56 |
| pm25 | 56 |
| o3 | 0.03 |
| no2 | 0 |
| so2 | 0 |
烟厂
| index | 2020-05 | 2020-04 | 2020-03 | 2020-02 | 2020-01 | 2019-12 | 2019-11 | 2019-10 | 2019-09 | 2019-08 | 2019-07 | 2019-06 | 2019-05 | 2019-04 | 2019-03 | 2019-02 | 2019-01 | 2018-12 | 2018-11 | 2018-10 |
|---|---|---|---|---|---|---|---|---|---|---|---|---|---|---|---|---|---|---|---|---|
| pm25 | 31 | 43 | 49 | 58 | 117 | 87 | 75 | 38 | 33 | 25 | 29 | 32 | 41 | 56 | 54 | 118 | 122 | 89 | 92 | 51 |
| co | 728 | 625 | 733 | 701 | 1 | 1 | 1 | 954 | 942 | 789 | 688 | 623 | 680 | 804 | 500 | 1 | 1 | 1 | 1 | 917 |
| no2 | 22 | 47 | 41 | 24 | 53 | 50 | 56 | 52 | 46 | 34 | 36 | 35 | 39 | 43 | 49 | 46 | 65 | 60 | 58 | 56 |
| o3 | 164 | 148 | 127 | 109 | 80 | 62 | 82 | 116 | 182 | 174 | 199 | 189 | 179 | 141 | 126 | 93 | 52 | 43 | 72 | 102 |
| pm10 | 84 | 96 | 99 | 77 | 136 | 114 | 126 | 87 | 66 | 51 | 61 | 79 | 112 | 122 | 120 | 162 | 176 | 162 | 146 | 93 |
| so2 | 10 | 13 | 13 | 9.8 | 11 | 11 | 14 | 9.4 | 6.8 | 4.6 | 4 | 5.5 | 8.3 | 8.6 | 10 | 13 | 18 | 21 | 17 | 18 |