Air Pollution in Punta Arenas: Real-time Air Quality Index and smog alert.
Pollution and air quality forecast for Punta Arenas. Today is Thursday, May 14, 2026. The following air pollution values have been recorded for Punta Arenas:- particulate matter (PM2.5) dust - 18 (Moderate)

What is the air quality in Punta Arenas today? Is the air polluted in Punta Arenas?. Is there smog?
What is the current level of PM2.5 in Punta Arenas? (particulate matter (PM2.5) dust)
Today's PM2.5 level is:
18 (Moderate)
For comparison, the highest level of PM2.5 in Punta Arenas in the last 7 days was: 20 (Monday, April 15, 2024) and the lowest: 12 (Thursday, April 11, 2024).
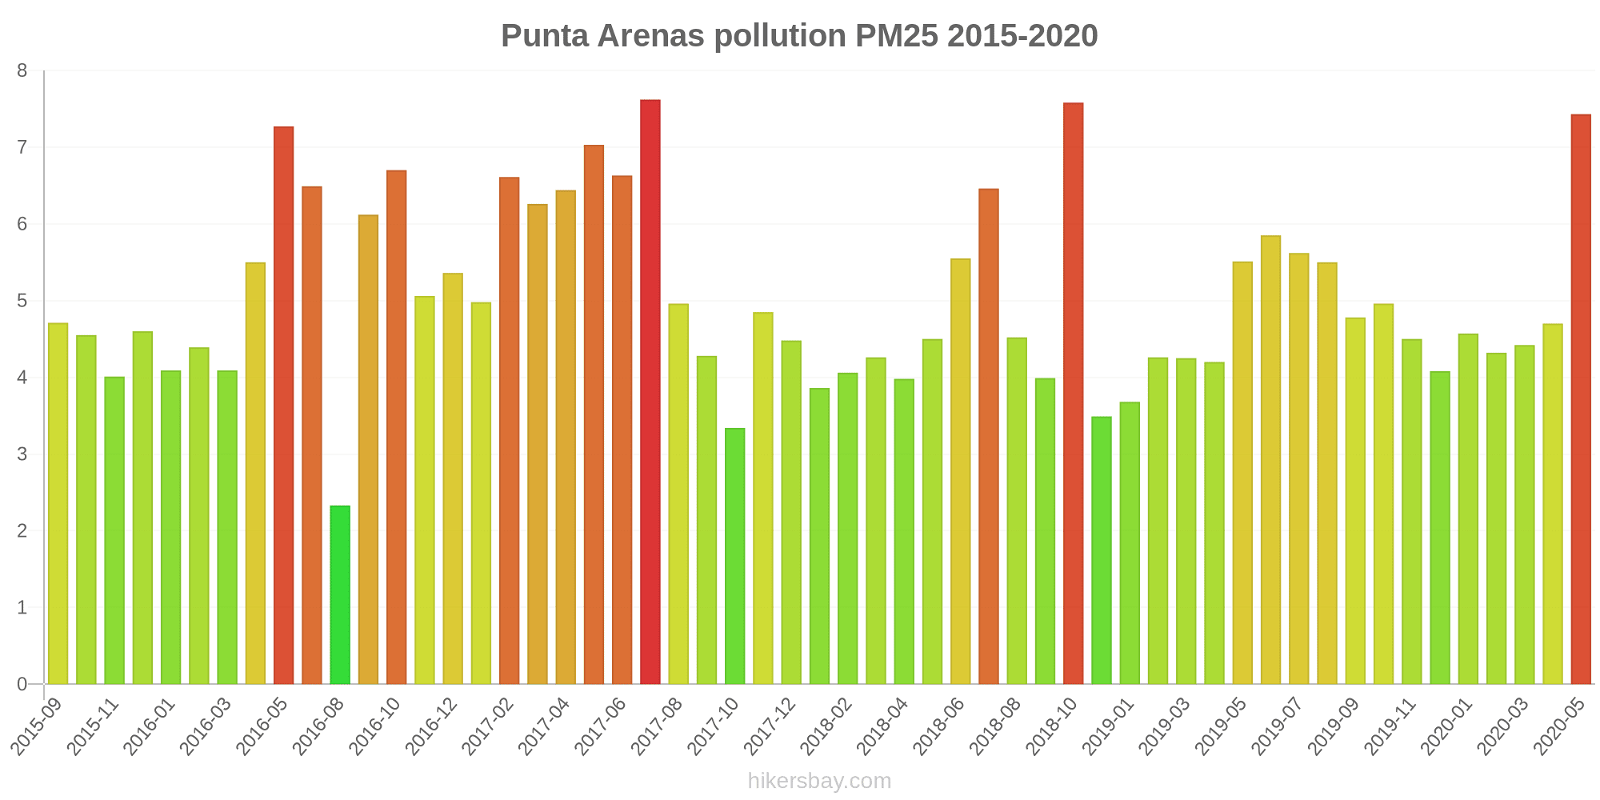
The highest PM2.5 values were recorded: 7.6 (July 2017).
The lowest level of particulate matter PM2.5 pollution occurs in month: August (2.3).
Current data Tuesday, April 16, 2024, 9:00 AM
PM2,5 18 (Moderate)
Data on air pollution from recent days in Punta Arenas
index
2024-04-09
2024-04-10
2024-04-11
2024-04-12
2024-04-13
2024-04-15
2024-04-16
pm25
13
Moderate
14
Moderate
12
Good
12
Good
14
Moderate
20
Moderate
17
Moderate
data source »
Air pollution in Punta Arenas from September 2015 to May 2020

index
2020-05
2020-04
2020-03
2020-02
2020-01
2019-12
2019-11
2019-10
2019-09
2019-08
2019-07
2019-06
2019-05
2019-04
2019-03
2019-02
2019-01
2018-11
2018-10
2018-09
2018-08
2018-07
2018-06
2018-05
2018-04
2018-03
2018-02
2018-01
2017-12
2017-11
2017-10
2017-09
2017-08
2017-07
2017-06
2017-05
2017-04
2017-03
2017-02
2017-01
2016-12
2016-11
2016-10
2016-09
2016-08
2016-06
2016-05
2016-04
2016-03
2016-02
2016-01
2015-12
2015-11
2015-10
2015-09
pm25
7.4 (Good)
4.7 (Good)
4.4 (Good)
4.3 (Good)
4.6 (Good)
4.1 (Good)
4.5 (Good)
5 (Good)
4.8 (Good)
5.5 (Good)
5.6 (Good)
5.8 (Good)
5.5 (Good)
4.2 (Good)
4.3 (Good)
4.3 (Good)
3.7 (Good)
3.5 (Good)
7.6 (Good)
4 (Good)
4.5 (Good)
6.5 (Good)
5.5 (Good)
4.5 (Good)
4 (Good)
4.3 (Good)
4.1 (Good)
3.9 (Good)
4.5 (Good)
4.8 (Good)
3.3 (Good)
4.3 (Good)
5 (Good)
7.6 (Good)
6.6 (Good)
7 (Good)
6.4 (Good)
6.3 (Good)
6.6 (Good)
5 (Good)
5.4 (Good)
5.1 (Good)
6.7 (Good)
6.1 (Good)
2.3 (Good)
6.5 (Good)
7.3 (Good)
5.5 (Good)
4.1 (Good)
4.4 (Good)
4.1 (Good)
4.6 (Good)
4 (Good)
4.5 (Good)
4.7 (Good)
data source »
Quality of life in Punta Arenas
Green and Parks in the City
Punta Arenas
71%
Argentina: 65%
Uruguay: 65%
Paraguay: 46%
Bolivia: 55%
Montenegro: 53%
particulate matter PM2.5
Punta Arenas
5 (Good)
Pleasure of spending time in the city
Punta Arenas
88%
Argentina: 64%
Uruguay: 67%
Paraguay: 49%
Bolivia: 40%
Montenegro: 69%
particulate matter PM10
Punta Arenas
11 (Good)
Air Pollution
Punta Arenas
5%
Argentina: 42%
Uruguay: 29%
Paraguay: 56%
Bolivia: 64%
Montenegro: 40%
Garbage Disposal
Punta Arenas
71%
Argentina: 48%
Uruguay: 34%
Paraguay: 30%
Bolivia: 34%
Montenegro: 42%
Availability and quality of drinking water
Punta Arenas
83%
Argentina: 69%
Uruguay: 73%
Paraguay: 57%
Montenegro: 71%
Cleanliness and tidiness
Punta Arenas
71%
Argentina: 43%
Uruguay: 38%
Paraguay: 26%
Bolivia: 32%
Montenegro: 51%
Noise and Light pollution
Punta Arenas
33%
Argentina: 53%
Uruguay: 48%
Paraguay: 52%
Bolivia: 59%
Montenegro: 32%
Water Pollution
Punta Arenas
45%
Argentina: 55%
Uruguay: 46%
Paraguay: 65%
Bolivia: 66%
Montenegro: 38%
Source: Numbeo
Punta Arenas
Tuesday, April 16, 2024, 9:00 AM
PM2,5 18 (Moderate)
particulate matter (PM2.5) dust
Punta Arenas
index
2024-04-16
2024-04-15
2024-04-13
2024-04-12
2024-04-11
2024-04-10
2024-04-09
pm25
17
20
14
12
12
14
13
Punta Arenas
2015-09 2020-05
index
2020-05
2020-04
2020-03
2020-02
2020-01
2019-12
2019-11
2019-10
2019-09
2019-08
2019-07
2019-06
2019-05
2019-04
2019-03
2019-02
2019-01
2018-11
2018-10
2018-09
2018-08
2018-07
2018-06
2018-05
2018-04
2018-03
2018-02
2018-01
2017-12
2017-11
2017-10
2017-09
2017-08
2017-07
2017-06
2017-05
2017-04
2017-03
2017-02
2017-01
2016-12
2016-11
2016-10
2016-09
2016-08
2016-06
2016-05
2016-04
2016-03
2016-02
2016-01
2015-12
2015-11
2015-10
2015-09
pm25
7.4
4.7
4.4
4.3
4.6
4.1
4.5
5
4.8
5.5
5.6
5.8
5.5
4.2
4.3
4.3
3.7
3.5
7.6
4
4.5
6.5
5.5
4.5
4
4.3
4.1
3.9
4.5
4.8
3.3
4.3
5
7.6
6.6
7
6.4
6.3
6.6
5
5.4
5.1
6.7
6.1
2.3
6.5
7.3
5.5
4.1
4.4
4.1
4.6
4
4.5
4.7
* Pollution data source:
https://openaq.org
(Chile - SINCA)
The data is licensed under CC-By 4.0
PM2,5 18 (Moderate)
Data on air pollution from recent days in Punta Arenas
| index | 2024-04-09 | 2024-04-10 | 2024-04-11 | 2024-04-12 | 2024-04-13 | 2024-04-15 | 2024-04-16 |
|---|---|---|---|---|---|---|---|
| pm25 | 13 Moderate |
14 Moderate |
12 Good |
12 Good |
14 Moderate |
20 Moderate |
17 Moderate |

| index | 2020-05 | 2020-04 | 2020-03 | 2020-02 | 2020-01 | 2019-12 | 2019-11 | 2019-10 | 2019-09 | 2019-08 | 2019-07 | 2019-06 | 2019-05 | 2019-04 | 2019-03 | 2019-02 | 2019-01 | 2018-11 | 2018-10 | 2018-09 | 2018-08 | 2018-07 | 2018-06 | 2018-05 | 2018-04 | 2018-03 | 2018-02 | 2018-01 | 2017-12 | 2017-11 | 2017-10 | 2017-09 | 2017-08 | 2017-07 | 2017-06 | 2017-05 | 2017-04 | 2017-03 | 2017-02 | 2017-01 | 2016-12 | 2016-11 | 2016-10 | 2016-09 | 2016-08 | 2016-06 | 2016-05 | 2016-04 | 2016-03 | 2016-02 | 2016-01 | 2015-12 | 2015-11 | 2015-10 | 2015-09 |
|---|---|---|---|---|---|---|---|---|---|---|---|---|---|---|---|---|---|---|---|---|---|---|---|---|---|---|---|---|---|---|---|---|---|---|---|---|---|---|---|---|---|---|---|---|---|---|---|---|---|---|---|---|---|---|---|
| pm25 | 7.4 (Good) | 4.7 (Good) | 4.4 (Good) | 4.3 (Good) | 4.6 (Good) | 4.1 (Good) | 4.5 (Good) | 5 (Good) | 4.8 (Good) | 5.5 (Good) | 5.6 (Good) | 5.8 (Good) | 5.5 (Good) | 4.2 (Good) | 4.3 (Good) | 4.3 (Good) | 3.7 (Good) | 3.5 (Good) | 7.6 (Good) | 4 (Good) | 4.5 (Good) | 6.5 (Good) | 5.5 (Good) | 4.5 (Good) | 4 (Good) | 4.3 (Good) | 4.1 (Good) | 3.9 (Good) | 4.5 (Good) | 4.8 (Good) | 3.3 (Good) | 4.3 (Good) | 5 (Good) | 7.6 (Good) | 6.6 (Good) | 7 (Good) | 6.4 (Good) | 6.3 (Good) | 6.6 (Good) | 5 (Good) | 5.4 (Good) | 5.1 (Good) | 6.7 (Good) | 6.1 (Good) | 2.3 (Good) | 6.5 (Good) | 7.3 (Good) | 5.5 (Good) | 4.1 (Good) | 4.4 (Good) | 4.1 (Good) | 4.6 (Good) | 4 (Good) | 4.5 (Good) | 4.7 (Good) |
Green and Parks in the City
Punta Arenas 71%
Argentina: 65% Uruguay: 65% Paraguay: 46% Bolivia: 55% Montenegro: 53%particulate matter PM2.5
Punta Arenas 5 (Good)
Pleasure of spending time in the city
Punta Arenas 88%
Argentina: 64% Uruguay: 67% Paraguay: 49% Bolivia: 40% Montenegro: 69%particulate matter PM10
Punta Arenas 11 (Good)
Air Pollution
Punta Arenas 5%
Argentina: 42% Uruguay: 29% Paraguay: 56% Bolivia: 64% Montenegro: 40%Garbage Disposal
Punta Arenas 71%
Argentina: 48% Uruguay: 34% Paraguay: 30% Bolivia: 34% Montenegro: 42%Availability and quality of drinking water
Punta Arenas 83%
Argentina: 69% Uruguay: 73% Paraguay: 57% Montenegro: 71%Cleanliness and tidiness
Punta Arenas 71%
Argentina: 43% Uruguay: 38% Paraguay: 26% Bolivia: 32% Montenegro: 51%Noise and Light pollution
Punta Arenas 33%
Argentina: 53% Uruguay: 48% Paraguay: 52% Bolivia: 59% Montenegro: 32%Water Pollution
Punta Arenas 45%
Argentina: 55% Uruguay: 46% Paraguay: 65% Bolivia: 66% Montenegro: 38%PM2,5 18 (Moderate)
particulate matter (PM2.5) dustPunta Arenas
| index | 2024-04-16 | 2024-04-15 | 2024-04-13 | 2024-04-12 | 2024-04-11 | 2024-04-10 | 2024-04-09 |
|---|---|---|---|---|---|---|---|
| pm25 | 17 | 20 | 14 | 12 | 12 | 14 | 13 |
Punta Arenas
| index | 2020-05 | 2020-04 | 2020-03 | 2020-02 | 2020-01 | 2019-12 | 2019-11 | 2019-10 | 2019-09 | 2019-08 | 2019-07 | 2019-06 | 2019-05 | 2019-04 | 2019-03 | 2019-02 | 2019-01 | 2018-11 | 2018-10 | 2018-09 | 2018-08 | 2018-07 | 2018-06 | 2018-05 | 2018-04 | 2018-03 | 2018-02 | 2018-01 | 2017-12 | 2017-11 | 2017-10 | 2017-09 | 2017-08 | 2017-07 | 2017-06 | 2017-05 | 2017-04 | 2017-03 | 2017-02 | 2017-01 | 2016-12 | 2016-11 | 2016-10 | 2016-09 | 2016-08 | 2016-06 | 2016-05 | 2016-04 | 2016-03 | 2016-02 | 2016-01 | 2015-12 | 2015-11 | 2015-10 | 2015-09 |
|---|---|---|---|---|---|---|---|---|---|---|---|---|---|---|---|---|---|---|---|---|---|---|---|---|---|---|---|---|---|---|---|---|---|---|---|---|---|---|---|---|---|---|---|---|---|---|---|---|---|---|---|---|---|---|---|
| pm25 | 7.4 | 4.7 | 4.4 | 4.3 | 4.6 | 4.1 | 4.5 | 5 | 4.8 | 5.5 | 5.6 | 5.8 | 5.5 | 4.2 | 4.3 | 4.3 | 3.7 | 3.5 | 7.6 | 4 | 4.5 | 6.5 | 5.5 | 4.5 | 4 | 4.3 | 4.1 | 3.9 | 4.5 | 4.8 | 3.3 | 4.3 | 5 | 7.6 | 6.6 | 7 | 6.4 | 6.3 | 6.6 | 5 | 5.4 | 5.1 | 6.7 | 6.1 | 2.3 | 6.5 | 7.3 | 5.5 | 4.1 | 4.4 | 4.1 | 4.6 | 4 | 4.5 | 4.7 |