Air Pollution in Provincia de Linares: Real-time Air Quality Index and smog alert.
Pollution and air quality forecast for Provincia de Linares. Today is Thursday, June 18, 2026. The following air pollution values have been recorded for Provincia de Linares:- particulate matter (PM2.5) dust - 78 (Very Unhealthy)

What is the air quality in Provincia de Linares today? Is the air polluted in Provincia de Linares?. Is there smog?
What is the current level of PM2.5 in Provincia de Linares? (particulate matter (PM2.5) dust)
Today's PM2.5 level is:
78 (Very Unhealthy)
For comparison, the highest level of PM2.5 in Provincia de Linares in the last 7 days was: 126 (Saturday, July 29, 2023) and the lowest: 21 (Thursday, August 3, 2023).
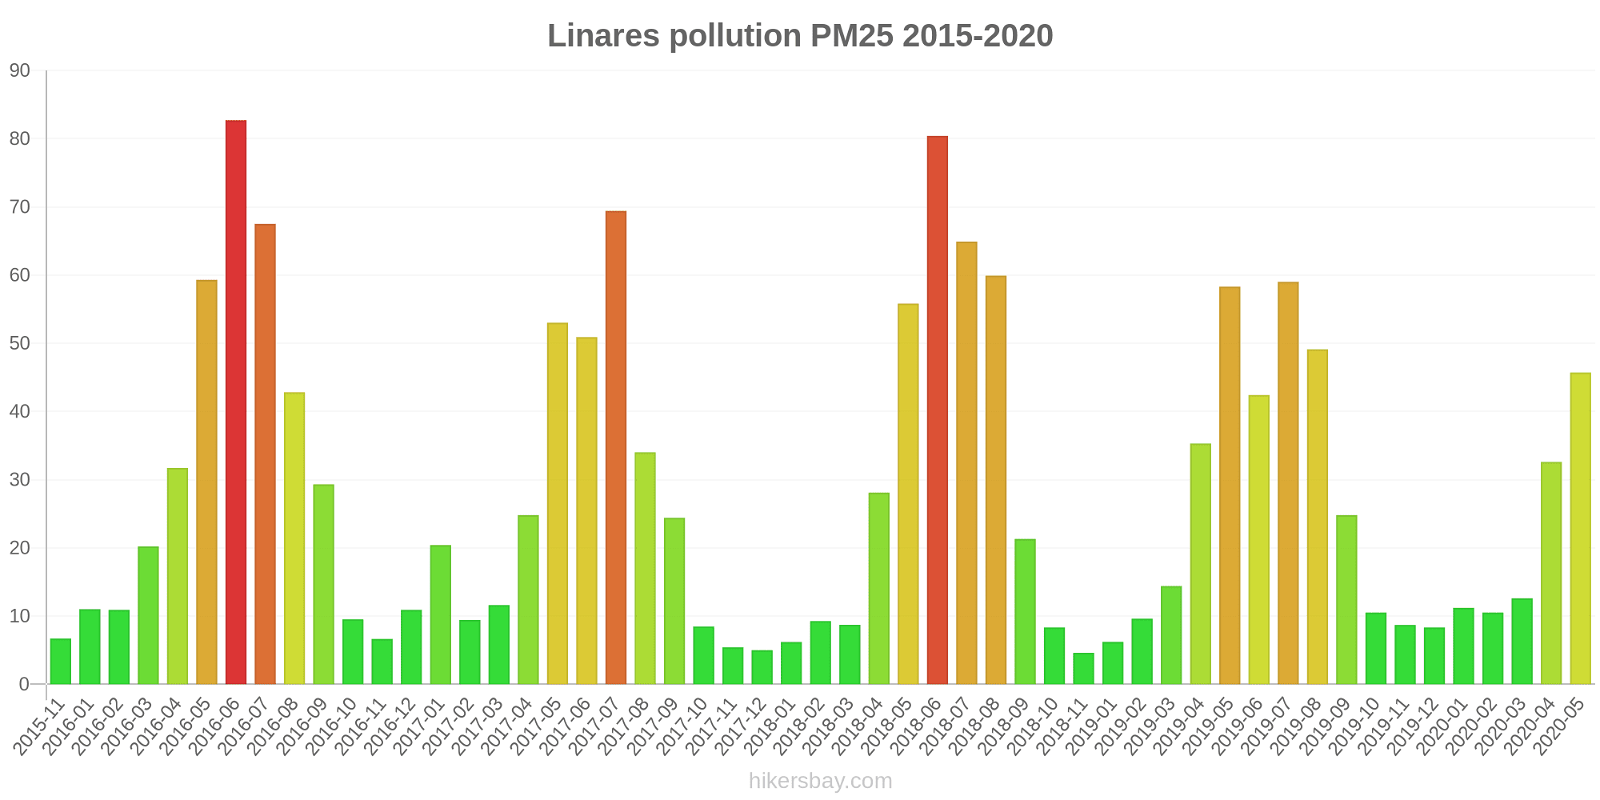
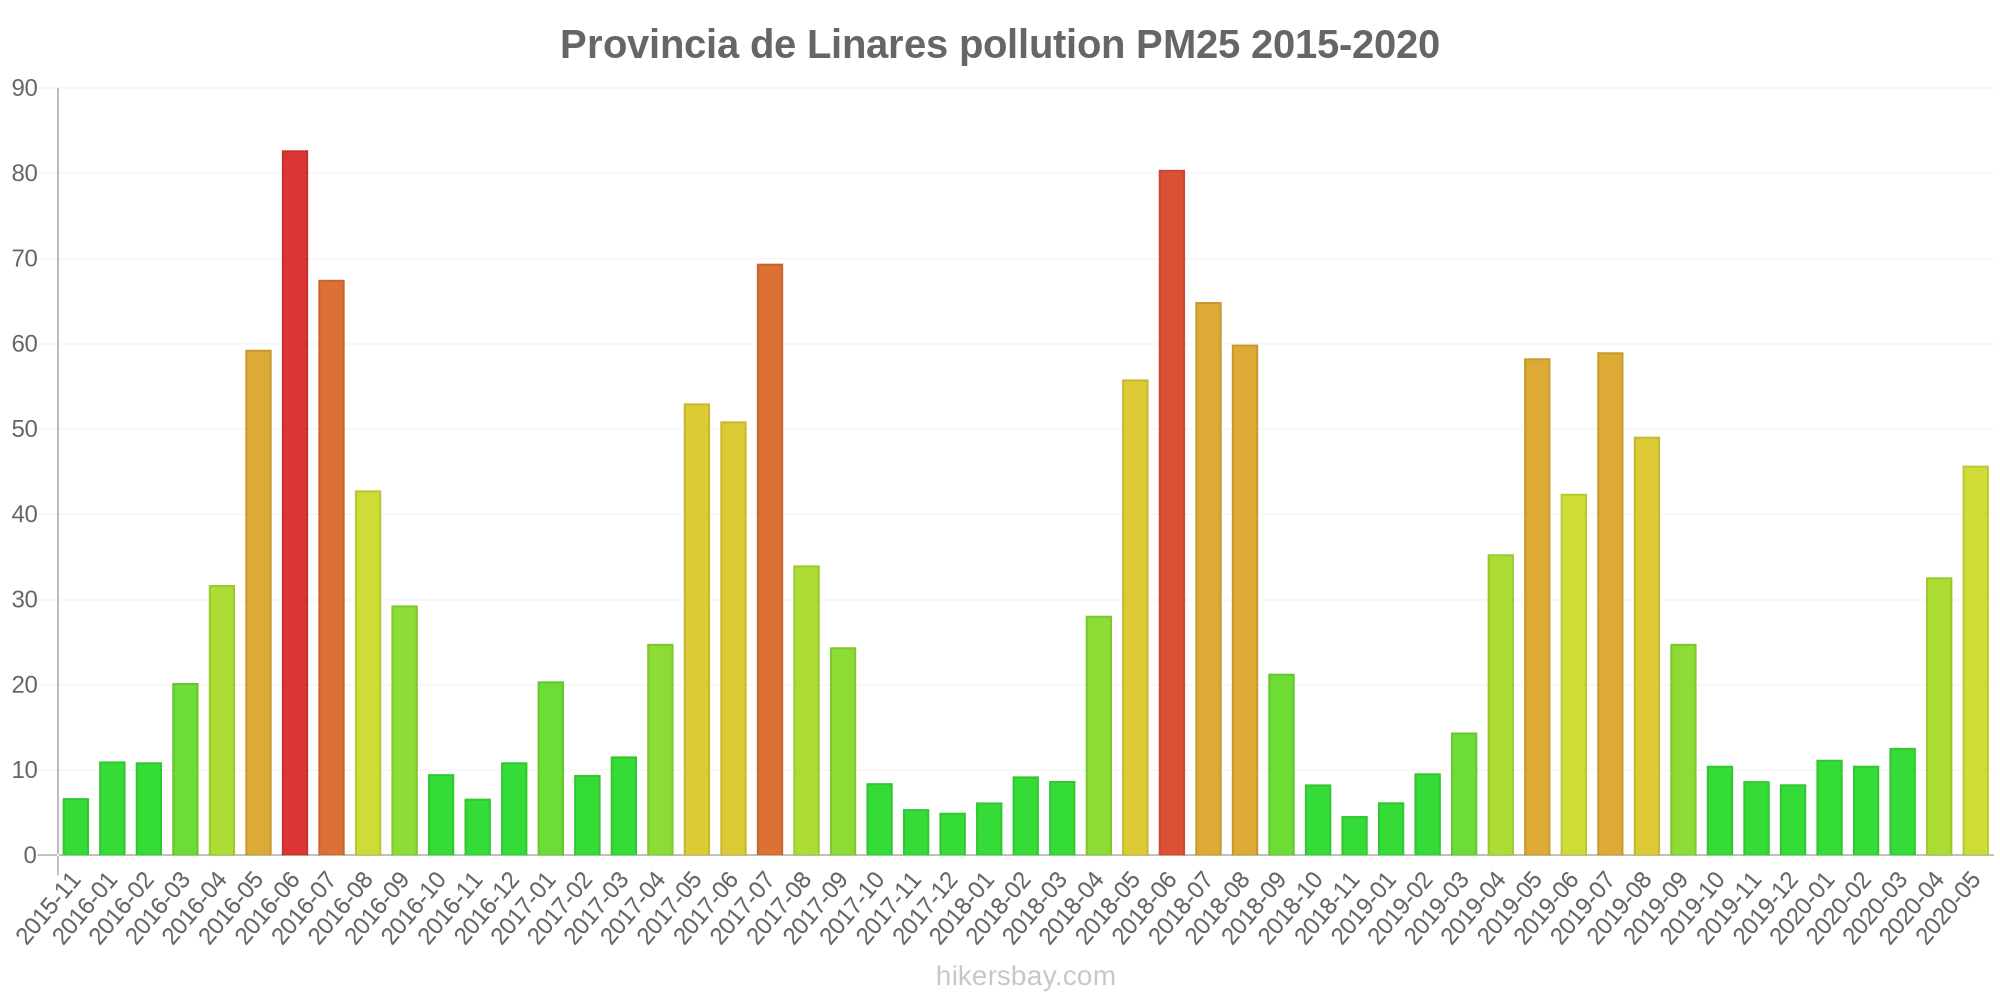
The highest PM2.5 values were recorded: 83 (June 2016).
The lowest level of particulate matter PM2.5 pollution occurs in month: November (4.6).
Current data Friday, July 28, 2023, 1:00 AM
PM2,5 78 (Very Unhealthy)
Data on air pollution from recent days in Provincia de Linares
index
2023-08-04
2023-08-02
2023-08-03
2023-08-01
2023-07-31
2023-07-30
2023-07-29
2023-07-28
pm25
36
Unhealthy for Sensitive Groups
28
Moderate
21
Moderate
45
Unhealthy for Sensitive Groups
73
Unhealthy
104
Very Unhealthy
126
Very bad Hazardous
106
Very Unhealthy
data source »
Air pollution in Provincia de Linares from November 2015 to May 2020

index
2020-05
2020-04
2020-03
2020-02
2020-01
2019-12
2019-11
2019-10
2019-09
2019-08
2019-07
2019-06
2019-05
2019-04
2019-03
2019-02
2019-01
2018-11
2018-10
2018-09
2018-08
2018-07
2018-06
2018-05
2018-04
2018-03
2018-02
2018-01
2017-12
2017-11
2017-10
2017-09
2017-08
2017-07
2017-06
2017-05
2017-04
2017-03
2017-02
2017-01
2016-12
2016-11
2016-10
2016-09
2016-08
2016-07
2016-06
2016-05
2016-04
2016-03
2016-02
2016-01
2015-11
pm25
46 (Unhealthy for Sensitive Groups)
33 (Moderate)
13 (Good)
11 (Good)
11 (Good)
8.3 (Good)
8.7 (Good)
11 (Good)
25 (Moderate)
49 (Unhealthy for Sensitive Groups)
59 (Unhealthy)
42 (Unhealthy for Sensitive Groups)
58 (Unhealthy)
35 (Unhealthy for Sensitive Groups)
14 (Moderate)
9.6 (Good)
6.2 (Good)
4.6 (Good)
8.3 (Good)
21 (Moderate)
60 (Unhealthy)
65 (Unhealthy)
80 (Very Unhealthy)
56 (Unhealthy)
28 (Moderate)
8.7 (Good)
9.3 (Good)
6.2 (Good)
5 (Good)
5.4 (Good)
8.4 (Good)
24 (Moderate)
34 (Moderate)
69 (Unhealthy)
51 (Unhealthy for Sensitive Groups)
53 (Unhealthy for Sensitive Groups)
25 (Moderate)
12 (Good)
9.4 (Good)
20 (Moderate)
11 (Good)
6.6 (Good)
9.5 (Good)
29 (Moderate)
43 (Unhealthy for Sensitive Groups)
68 (Unhealthy)
83 (Very Unhealthy)
59 (Unhealthy)
32 (Moderate)
20 (Moderate)
11 (Good)
11 (Good)
6.7 (Good)
data source »
Linares
Friday, July 28, 2023, 1:00 AM
PM2,5 78 (Very Unhealthy)
particulate matter (PM2.5) dust
Linares
index
2023-07-28
2023-07-29
2023-07-30
2023-07-31
2023-08-01
2023-08-03
2023-08-02
2023-08-04
pm25
106
126
104
73
45
21
28
36
Linares
2015-11 2020-05
index
2020-05
2020-04
2020-03
2020-02
2020-01
2019-12
2019-11
2019-10
2019-09
2019-08
2019-07
2019-06
2019-05
2019-04
2019-03
2019-02
2019-01
2018-11
2018-10
2018-09
2018-08
2018-07
2018-06
2018-05
2018-04
2018-03
2018-02
2018-01
2017-12
2017-11
2017-10
2017-09
2017-08
2017-07
2017-06
2017-05
2017-04
2017-03
2017-02
2017-01
2016-12
2016-11
2016-10
2016-09
2016-08
2016-07
2016-06
2016-05
2016-04
2016-03
2016-02
2016-01
2015-11
pm25
46
33
13
11
11
8.3
8.7
11
25
49
59
42
58
35
14
9.6
6.2
4.6
8.3
21
60
65
80
56
28
8.7
9.3
6.2
5
5.4
8.4
24
34
69
51
53
25
12
9.4
20
11
6.6
9.5
29
43
68
83
59
32
20
11
11
6.7
* Pollution data source:
https://openaq.org
(Chile - SINCA)
The data is licensed under CC-By 4.0
PM2,5 78 (Very Unhealthy)
Data on air pollution from recent days in Provincia de Linares
| index | 2023-08-04 | 2023-08-02 | 2023-08-03 | 2023-08-01 | 2023-07-31 | 2023-07-30 | 2023-07-29 | 2023-07-28 |
|---|---|---|---|---|---|---|---|---|
| pm25 | 36 Unhealthy for Sensitive Groups |
28 Moderate |
21 Moderate |
45 Unhealthy for Sensitive Groups |
73 Unhealthy |
104 Very Unhealthy |
126 Very bad Hazardous |
106 Very Unhealthy |
| index | 2020-05 | 2020-04 | 2020-03 | 2020-02 | 2020-01 | 2019-12 | 2019-11 | 2019-10 | 2019-09 | 2019-08 | 2019-07 | 2019-06 | 2019-05 | 2019-04 | 2019-03 | 2019-02 | 2019-01 | 2018-11 | 2018-10 | 2018-09 | 2018-08 | 2018-07 | 2018-06 | 2018-05 | 2018-04 | 2018-03 | 2018-02 | 2018-01 | 2017-12 | 2017-11 | 2017-10 | 2017-09 | 2017-08 | 2017-07 | 2017-06 | 2017-05 | 2017-04 | 2017-03 | 2017-02 | 2017-01 | 2016-12 | 2016-11 | 2016-10 | 2016-09 | 2016-08 | 2016-07 | 2016-06 | 2016-05 | 2016-04 | 2016-03 | 2016-02 | 2016-01 | 2015-11 |
|---|---|---|---|---|---|---|---|---|---|---|---|---|---|---|---|---|---|---|---|---|---|---|---|---|---|---|---|---|---|---|---|---|---|---|---|---|---|---|---|---|---|---|---|---|---|---|---|---|---|---|---|---|---|
| pm25 | 46 (Unhealthy for Sensitive Groups) | 33 (Moderate) | 13 (Good) | 11 (Good) | 11 (Good) | 8.3 (Good) | 8.7 (Good) | 11 (Good) | 25 (Moderate) | 49 (Unhealthy for Sensitive Groups) | 59 (Unhealthy) | 42 (Unhealthy for Sensitive Groups) | 58 (Unhealthy) | 35 (Unhealthy for Sensitive Groups) | 14 (Moderate) | 9.6 (Good) | 6.2 (Good) | 4.6 (Good) | 8.3 (Good) | 21 (Moderate) | 60 (Unhealthy) | 65 (Unhealthy) | 80 (Very Unhealthy) | 56 (Unhealthy) | 28 (Moderate) | 8.7 (Good) | 9.3 (Good) | 6.2 (Good) | 5 (Good) | 5.4 (Good) | 8.4 (Good) | 24 (Moderate) | 34 (Moderate) | 69 (Unhealthy) | 51 (Unhealthy for Sensitive Groups) | 53 (Unhealthy for Sensitive Groups) | 25 (Moderate) | 12 (Good) | 9.4 (Good) | 20 (Moderate) | 11 (Good) | 6.6 (Good) | 9.5 (Good) | 29 (Moderate) | 43 (Unhealthy for Sensitive Groups) | 68 (Unhealthy) | 83 (Very Unhealthy) | 59 (Unhealthy) | 32 (Moderate) | 20 (Moderate) | 11 (Good) | 11 (Good) | 6.7 (Good) |
PM2,5 78 (Very Unhealthy)
particulate matter (PM2.5) dustLinares
| index | 2023-07-28 | 2023-07-29 | 2023-07-30 | 2023-07-31 | 2023-08-01 | 2023-08-03 | 2023-08-02 | 2023-08-04 |
|---|---|---|---|---|---|---|---|---|
| pm25 | 106 | 126 | 104 | 73 | 45 | 21 | 28 | 36 |
Linares

| index | 2020-05 | 2020-04 | 2020-03 | 2020-02 | 2020-01 | 2019-12 | 2019-11 | 2019-10 | 2019-09 | 2019-08 | 2019-07 | 2019-06 | 2019-05 | 2019-04 | 2019-03 | 2019-02 | 2019-01 | 2018-11 | 2018-10 | 2018-09 | 2018-08 | 2018-07 | 2018-06 | 2018-05 | 2018-04 | 2018-03 | 2018-02 | 2018-01 | 2017-12 | 2017-11 | 2017-10 | 2017-09 | 2017-08 | 2017-07 | 2017-06 | 2017-05 | 2017-04 | 2017-03 | 2017-02 | 2017-01 | 2016-12 | 2016-11 | 2016-10 | 2016-09 | 2016-08 | 2016-07 | 2016-06 | 2016-05 | 2016-04 | 2016-03 | 2016-02 | 2016-01 | 2015-11 |
|---|---|---|---|---|---|---|---|---|---|---|---|---|---|---|---|---|---|---|---|---|---|---|---|---|---|---|---|---|---|---|---|---|---|---|---|---|---|---|---|---|---|---|---|---|---|---|---|---|---|---|---|---|---|
| pm25 | 46 | 33 | 13 | 11 | 11 | 8.3 | 8.7 | 11 | 25 | 49 | 59 | 42 | 58 | 35 | 14 | 9.6 | 6.2 | 4.6 | 8.3 | 21 | 60 | 65 | 80 | 56 | 28 | 8.7 | 9.3 | 6.2 | 5 | 5.4 | 8.4 | 24 | 34 | 69 | 51 | 53 | 25 | 12 | 9.4 | 20 | 11 | 6.6 | 9.5 | 29 | 43 | 68 | 83 | 59 | 32 | 20 | 11 | 11 | 6.7 |