Air Pollution in Point Edward: Real-time Air Quality Index and smog alert.
Pollution and air quality forecast for Point Edward. Today is Thursday, June 18, 2026. The following air pollution values have been recorded for Point Edward:- sulfur dioxide (SO2) - 0 (Good)
- nitrogen dioxide (NO2) - 0 (Good)
- particulate matter (PM2.5) dust - 3 (Good)
- ozone (O3) - 0 (Good)

What is the air quality in Point Edward today? Is the air polluted in Point Edward?. Is there smog?
What is the level of SO2 pollution? (sulfur dioxide (SO2))
0 (Good)
How high is the level of NO2? (nitrogen dioxide (NO2))
0 (Good)
What is the current level of PM2.5 in Point Edward? (particulate matter (PM2.5) dust)
Today's PM2.5 level is:
3 (Good)
For comparison, the highest level of PM2.5 in Point Edward in the last 7 days was: 11 (Tuesday, April 9, 2024) and the lowest: 2 (Friday, April 12, 2024).
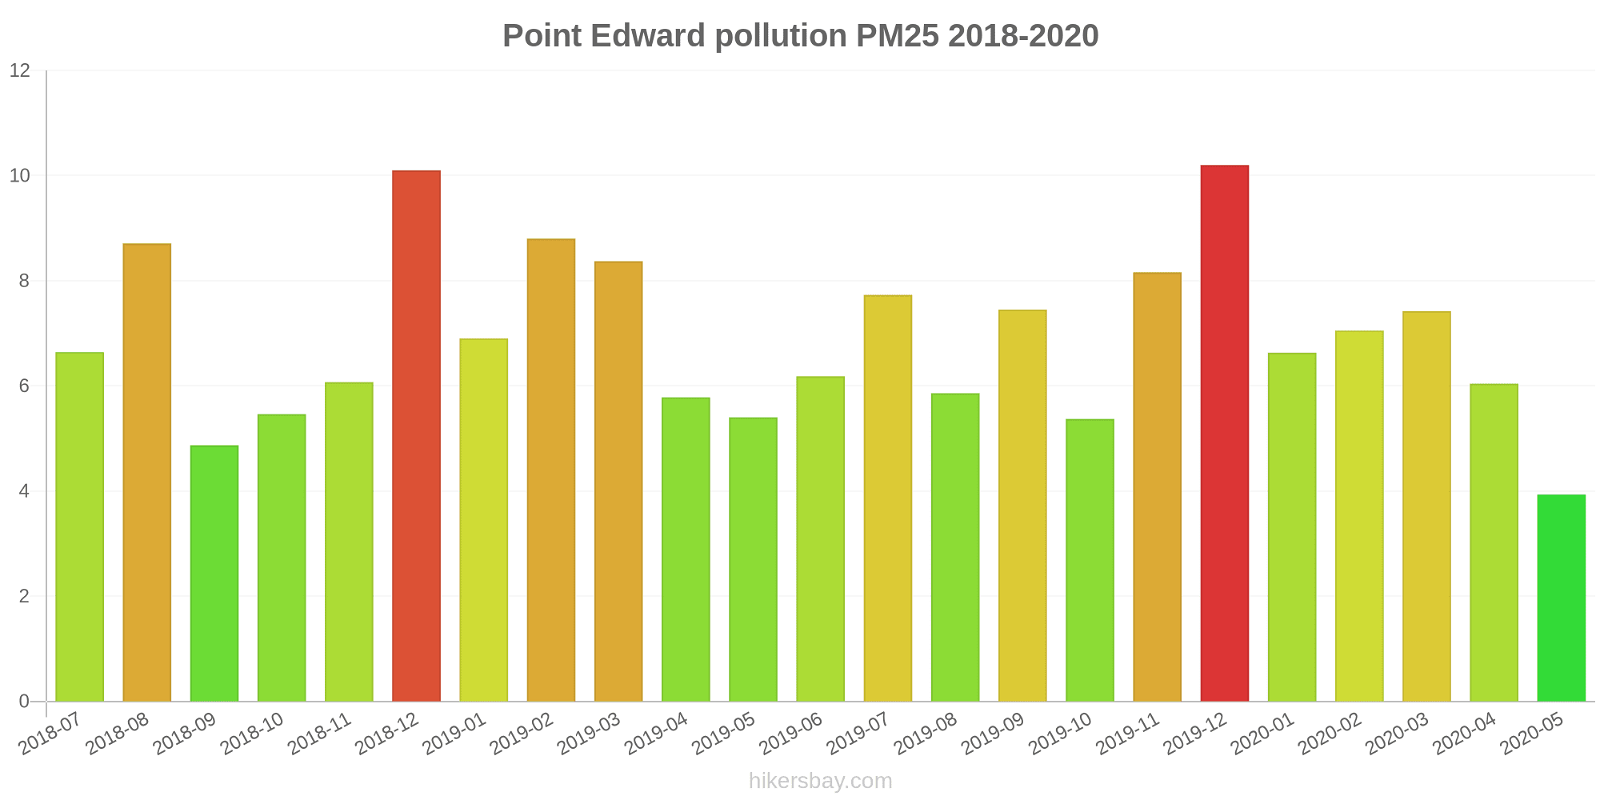
The highest PM2.5 values were recorded: 10 (December 2019).
The lowest level of particulate matter PM2.5 pollution occurs in month: May (3.9).
How is the O3 level today in Point Edward? (ozone (O3))
0 (Good)
Current data Tuesday, April 16, 2024, 10:00 AM
SO2 0 (Good)
0 (Good)
NO2 0 (Good)
PM2,5 3 (Good)
0 (Good)
O3 0 (Good)
Data on air pollution from recent days in Point Edward
index
2024-04-09
2024-04-10
2024-04-11
2024-04-12
2024-04-13
2024-04-14
2024-04-15
2024-04-16
pm25
11
Good
3
Good
7
Good
2
Good
2
Good
5
Good
6
Good
4
Good
no2
0
Good
0
Good
0
Good
0
Good
0
Good
0
Good
0
Good
0
Good
no
0
Good
0
Good
0
Good
0
Good
0
Good
0
Good
0
Good
0
Good
nox
0
Good
0
Good
0
Good
0
Good
0
Good
0
Good
0
Good
0
Good
o3
0
Good
0
Good
0
Good
0
Good
0
Good
0
Good
0
Good
0
Good
so2
0
Good
0
Good
0
Good
0
Good
0
Good
0
Good
0
Good
0
Good
data source »
Air pollution in Point Edward from July 2018 to May 2020
index
2020-05
2020-04
2020-03
2020-02
2020-01
2019-12
2019-11
2019-10
2019-09
2019-08
2019-07
2019-06
2019-05
2019-04
2019-03
2019-02
2019-01
2018-12
2018-11
2018-10
2018-09
2018-08
2018-07
o3:ppm
0.03 (Good)
0.03 (Good)
0.03 (Good)
0.03 (Good)
0.02 (Good)
0.02 (Good)
0.02 (Good)
0.02 (Good)
0.03 (Good)
0.03 (Good)
0.03 (Good)
0.03 (Good)
0.03 (Good)
0.04 (Good)
0.04 (Good)
0.03 (Good)
0.03 (Good)
0.02 (Good)
0.02 (Good)
0.02 (Good)
0.02 (Good)
0.03 (Good)
0.03 (Good)
pm25
3.9 (Good)
6 (Good)
7.4 (Good)
7 (Good)
6.6 (Good)
10 (Good)
8.2 (Good)
5.4 (Good)
7.5 (Good)
5.9 (Good)
7.7 (Good)
6.2 (Good)
5.4 (Good)
5.8 (Good)
8.4 (Good)
8.8 (Good)
6.9 (Good)
10 (Good)
6.1 (Good)
5.5 (Good)
4.9 (Good)
8.7 (Good)
6.6 (Good)
data source »
Sarnia
Tuesday, April 16, 2024, 10:00 AM
SO2 0 (Good)
sulfur dioxide (SO2)
0 (Good)
index_name_no
NO2 0 (Good)
nitrogen dioxide (NO2)
PM2,5 3 (Good)
particulate matter (PM2.5) dust
0.01 (Good)
index_name_nox
O3 0.04 (Good)
ozone (O3)
Sarnia
index
2024-04-16
2024-04-15
2024-04-14
2024-04-13
2024-04-12
2024-04-11
2024-04-10
2024-04-09
pm25
3.5
5.6
5
1.9
1.8
6.5
3.3
11
no2
0.01
0.01
0.01
0
0
0.01
0.01
0.01
no
0
0
0
0
0
0
0
0
nox
0.01
0.01
0.01
0
0
0.01
0.01
0.01
o3
0.04
0.04
0.04
0.04
0.04
0.04
0.04
0.04
so2
0
0
0
0
0
0
0
0
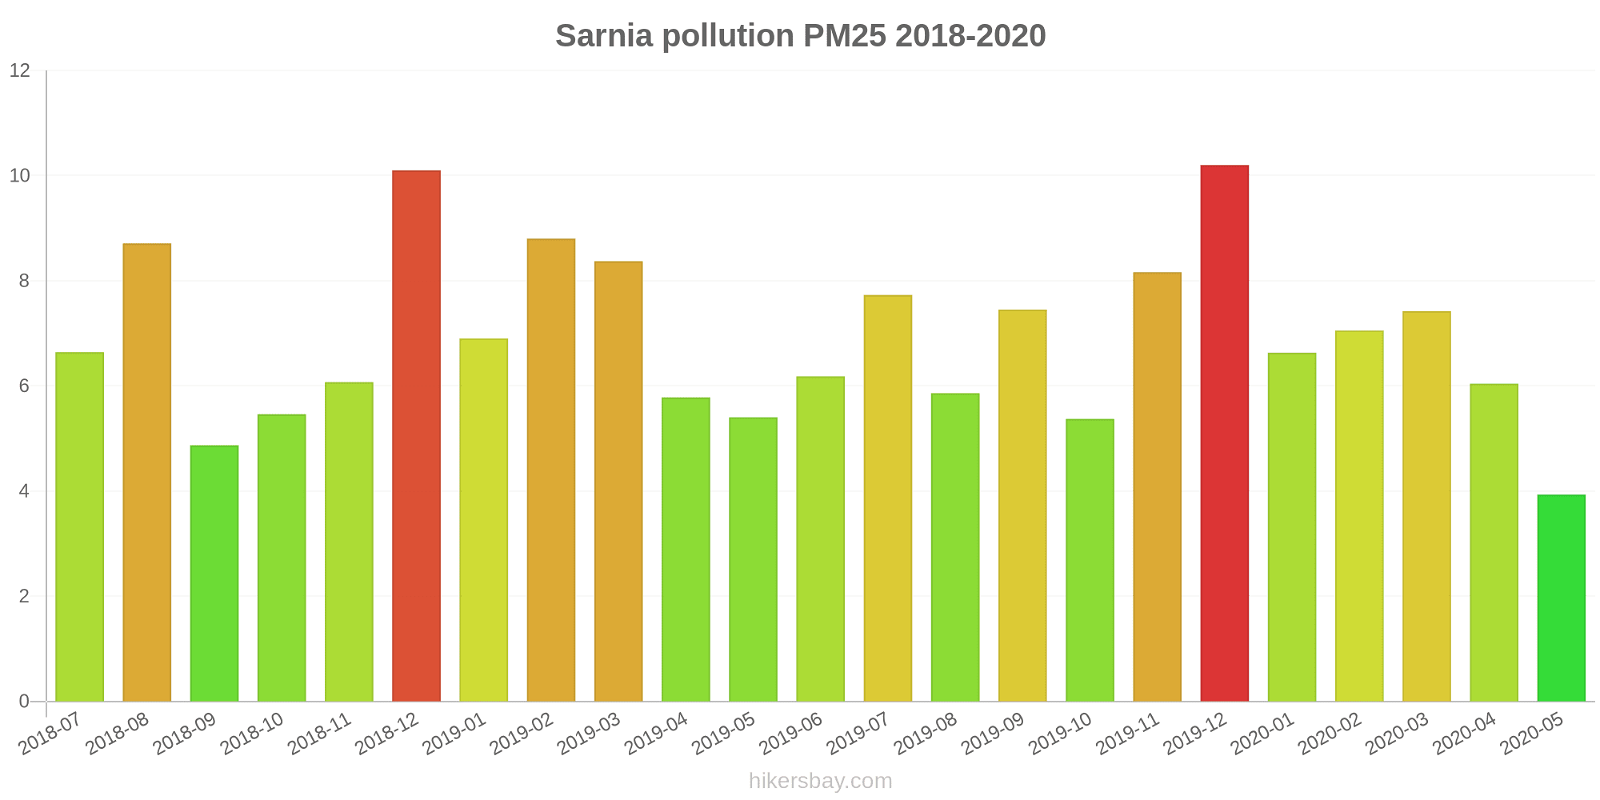
Sarnia
2018-07 2020-05
index
2020-05
2020-04
2020-03
2020-02
2020-01
2019-12
2019-11
2019-10
2019-09
2019-08
2019-07
2019-06
2019-05
2019-04
2019-03
2019-02
2019-01
2018-12
2018-11
2018-10
2018-09
2018-08
2018-07
o3:ppm
0.03
0.03
0.03
0.03
0.02
0.02
0.02
0.02
0.03
0.03
0.03
0.03
0.03
0.04
0.04
0.03
0.03
0.02
0.02
0.02
0.02
0.03
0.03
pm25
3.9
6
7.4
7
6.6
10
8.2
5.4
7.5
5.9
7.7
6.2
5.4
5.8
8.4
8.8
6.9
10
6.1
5.5
4.9
8.7
6.6
* Pollution data source:
https://openaq.org
(AirNow)
The data is licensed under CC-By 4.0
SO2 0 (Good)
0 (Good)
NO2 0 (Good)
PM2,5 3 (Good)
0 (Good)
O3 0 (Good)
Data on air pollution from recent days in Point Edward
| index | 2024-04-09 | 2024-04-10 | 2024-04-11 | 2024-04-12 | 2024-04-13 | 2024-04-14 | 2024-04-15 | 2024-04-16 |
|---|---|---|---|---|---|---|---|---|
| pm25 | 11 Good |
3 Good |
7 Good |
2 Good |
2 Good |
5 Good |
6 Good |
4 Good |
| no2 | 0 Good |
0 Good |
0 Good |
0 Good |
0 Good |
0 Good |
0 Good |
0 Good |
| no | 0 Good |
0 Good |
0 Good |
0 Good |
0 Good |
0 Good |
0 Good |
0 Good |
| nox | 0 Good |
0 Good |
0 Good |
0 Good |
0 Good |
0 Good |
0 Good |
0 Good |
| o3 | 0 Good |
0 Good |
0 Good |
0 Good |
0 Good |
0 Good |
0 Good |
0 Good |
| so2 | 0 Good |
0 Good |
0 Good |
0 Good |
0 Good |
0 Good |
0 Good |
0 Good |

| index | 2020-05 | 2020-04 | 2020-03 | 2020-02 | 2020-01 | 2019-12 | 2019-11 | 2019-10 | 2019-09 | 2019-08 | 2019-07 | 2019-06 | 2019-05 | 2019-04 | 2019-03 | 2019-02 | 2019-01 | 2018-12 | 2018-11 | 2018-10 | 2018-09 | 2018-08 | 2018-07 |
|---|---|---|---|---|---|---|---|---|---|---|---|---|---|---|---|---|---|---|---|---|---|---|---|
| o3:ppm | 0.03 (Good) | 0.03 (Good) | 0.03 (Good) | 0.03 (Good) | 0.02 (Good) | 0.02 (Good) | 0.02 (Good) | 0.02 (Good) | 0.03 (Good) | 0.03 (Good) | 0.03 (Good) | 0.03 (Good) | 0.03 (Good) | 0.04 (Good) | 0.04 (Good) | 0.03 (Good) | 0.03 (Good) | 0.02 (Good) | 0.02 (Good) | 0.02 (Good) | 0.02 (Good) | 0.03 (Good) | 0.03 (Good) |
| pm25 | 3.9 (Good) | 6 (Good) | 7.4 (Good) | 7 (Good) | 6.6 (Good) | 10 (Good) | 8.2 (Good) | 5.4 (Good) | 7.5 (Good) | 5.9 (Good) | 7.7 (Good) | 6.2 (Good) | 5.4 (Good) | 5.8 (Good) | 8.4 (Good) | 8.8 (Good) | 6.9 (Good) | 10 (Good) | 6.1 (Good) | 5.5 (Good) | 4.9 (Good) | 8.7 (Good) | 6.6 (Good) |
SO2 0 (Good)
sulfur dioxide (SO2)0 (Good)
index_name_noNO2 0 (Good)
nitrogen dioxide (NO2)PM2,5 3 (Good)
particulate matter (PM2.5) dust0.01 (Good)
index_name_noxO3 0.04 (Good)
ozone (O3)Sarnia
| index | 2024-04-16 | 2024-04-15 | 2024-04-14 | 2024-04-13 | 2024-04-12 | 2024-04-11 | 2024-04-10 | 2024-04-09 |
|---|---|---|---|---|---|---|---|---|
| pm25 | 3.5 | 5.6 | 5 | 1.9 | 1.8 | 6.5 | 3.3 | 11 |
| no2 | 0.01 | 0.01 | 0.01 | 0 | 0 | 0.01 | 0.01 | 0.01 |
| no | 0 | 0 | 0 | 0 | 0 | 0 | 0 | 0 |
| nox | 0.01 | 0.01 | 0.01 | 0 | 0 | 0.01 | 0.01 | 0.01 |
| o3 | 0.04 | 0.04 | 0.04 | 0.04 | 0.04 | 0.04 | 0.04 | 0.04 |
| so2 | 0 | 0 | 0 | 0 | 0 | 0 | 0 | 0 |
Sarnia

| index | 2020-05 | 2020-04 | 2020-03 | 2020-02 | 2020-01 | 2019-12 | 2019-11 | 2019-10 | 2019-09 | 2019-08 | 2019-07 | 2019-06 | 2019-05 | 2019-04 | 2019-03 | 2019-02 | 2019-01 | 2018-12 | 2018-11 | 2018-10 | 2018-09 | 2018-08 | 2018-07 |
|---|---|---|---|---|---|---|---|---|---|---|---|---|---|---|---|---|---|---|---|---|---|---|---|
| o3:ppm | 0.03 | 0.03 | 0.03 | 0.03 | 0.02 | 0.02 | 0.02 | 0.02 | 0.03 | 0.03 | 0.03 | 0.03 | 0.03 | 0.04 | 0.04 | 0.03 | 0.03 | 0.02 | 0.02 | 0.02 | 0.02 | 0.03 | 0.03 |
| pm25 | 3.9 | 6 | 7.4 | 7 | 6.6 | 10 | 8.2 | 5.4 | 7.5 | 5.9 | 7.7 | 6.2 | 5.4 | 5.8 | 8.4 | 8.8 | 6.9 | 10 | 6.1 | 5.5 | 4.9 | 8.7 | 6.6 |