Air Pollution in Plage-Chartrand: Real-time Air Quality Index and smog alert.
Pollution and air quality forecast for Plage-Chartrand. Today is Tuesday, June 16, 2026. The following air pollution values have been recorded for Plage-Chartrand:- ozone (O3) - 0 (Good)
- carbon monoxide (CO) - 1 (Good)
- nitrogen dioxide (NO2) - 0 (Good)
- particulate matter (PM2.5) dust - 39 (Unhealthy for Sensitive Groups)

What is the air quality in Plage-Chartrand today? Is the air polluted in Plage-Chartrand?. Is there smog?
How is the O3 level today in Plage-Chartrand? (ozone (O3))
0 (Good)
How high is the CO level? (carbon monoxide (CO))
1 (Good)
How high is the level of NO2? (nitrogen dioxide (NO2))
0 (Good)
What is the current level of PM2.5 in Plage-Chartrand? (particulate matter (PM2.5) dust)
Today's PM2.5 level is:
39 (Unhealthy for Sensitive Groups)
For comparison, the highest level of PM2.5 in Plage-Chartrand in the last 7 days was: 40 (Saturday, July 1, 2023) and the lowest: 5 (Saturday, July 8, 2023).
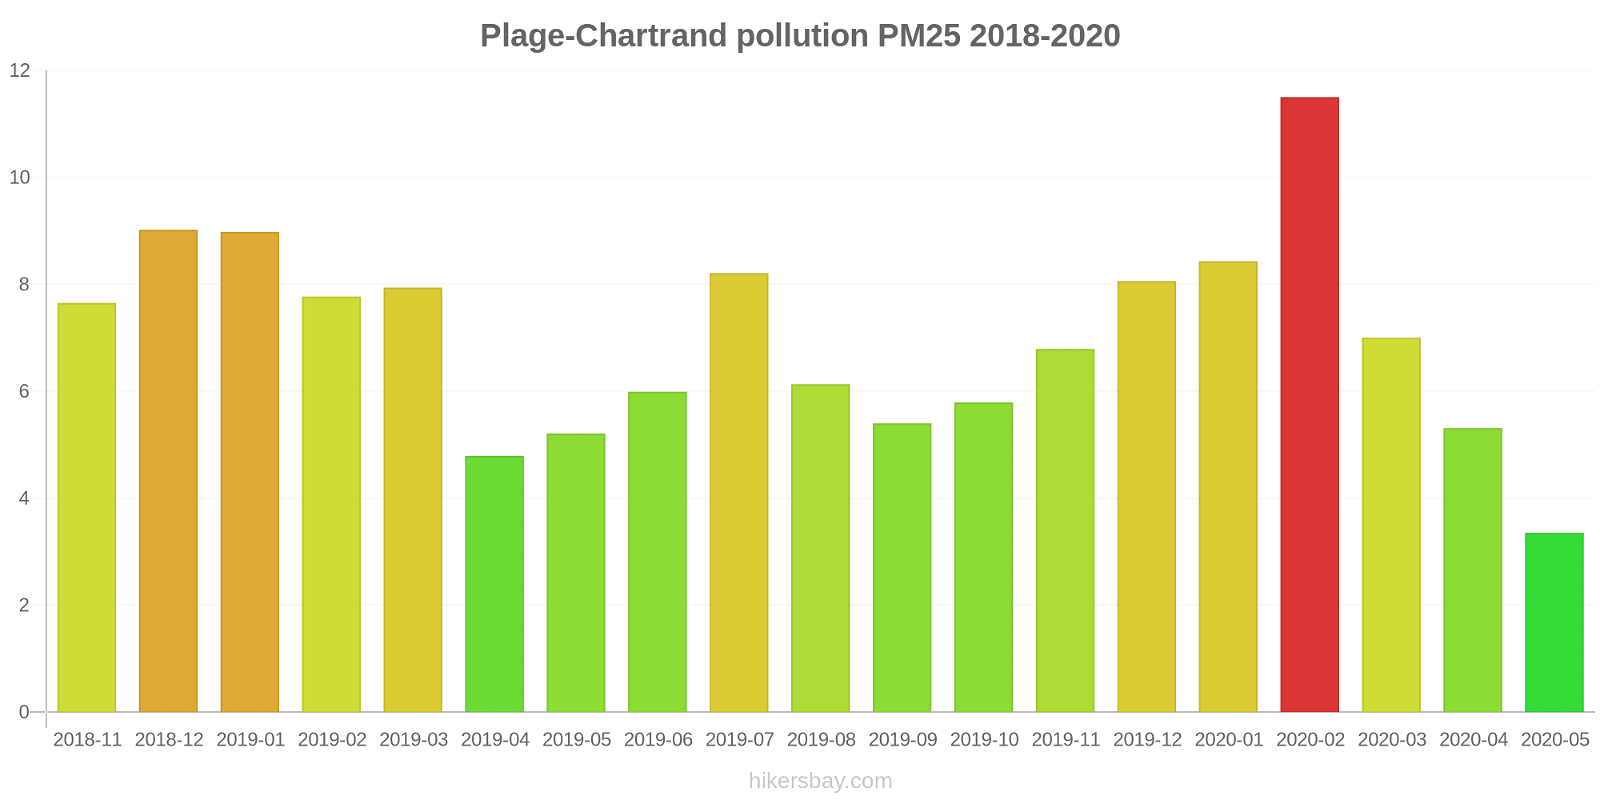
The highest PM2.5 values were recorded: 12 (February 2020).
The lowest level of particulate matter PM2.5 pollution occurs in month: May (3.4).
Current data Saturday, July 1, 2023, 10:00 PM
O3 0 (Good)
CO 1 (Good)
NO2 0 (Good)
PM2,5 39 (Unhealthy for Sensitive Groups)
Data on air pollution from recent days in Plage-Chartrand
index
2023-07-05
2023-07-07
2023-07-03
2023-07-04
2023-07-08
2023-07-02
2023-07-06
2023-07-01
o3
0
Good
0
Good
0
Good
0
Good
0
Good
0
Good
0
Good
0
Good
co
0
Good
0
Good
0
Good
0
Good
0
Good
0
Good
0
Good
1
Good
no2
0
Good
0
Good
0
Good
0
Good
0
Good
0
Good
0
Good
0
Good
pm25
11
Good
8
Good
12
Good
16
Moderate
5
Good
21
Moderate
12
Good
40
Unhealthy for Sensitive Groups
data source »
Air pollution in Plage-Chartrand from November 2018 to May 2020
index
2020-05
2020-04
2020-03
2020-02
2020-01
2019-12
2019-11
2019-10
2019-09
2019-08
2019-07
2019-06
2019-05
2019-04
2019-03
2019-02
2019-01
2018-12
2018-11
co:ppm
0.15 (Good)
0.17 (Good)
0.2 (Good)
0.24 (Good)
0.23 (Good)
0.2 (Good)
0.18 (Good)
0.18 (Good)
0.17 (Good)
0.16 (Good)
0.17 (Good)
0.16 (Good)
0.16 (Good)
0.18 (Good)
0.22 (Good)
0.22 (Good)
0.23 (Good)
0.22 (Good)
0.28 (Good)
no2:ppm
0 (Good)
0 (Good)
0.01 (Good)
0.01 (Good)
0.01 (Good)
0.01 (Good)
0.01 (Good)
0.01 (Good)
0.01 (Good)
0 (Good)
0 (Good)
0 (Good)
0 (Good)
0 (Good)
0.01 (Good)
0.01 (Good)
0.01 (Good)
0.01 (Good)
0.01 (Good)
o3:ppm
0.03 (Good)
0.03 (Good)
0.03 (Good)
0.03 (Good)
0.02 (Good)
0.02 (Good)
0.02 (Good)
0.02 (Good)
0.02 (Good)
0.02 (Good)
0.03 (Good)
0.03 (Good)
0.03 (Good)
0.03 (Good)
0.04 (Good)
0.03 (Good)
0.03 (Good)
0.02 (Good)
0.02 (Good)
pm25
3.4 (Good)
5.3 (Good)
7 (Good)
12 (Good)
8.4 (Good)
8.1 (Good)
6.8 (Good)
5.8 (Good)
5.4 (Good)
6.1 (Good)
8.2 (Good)
6 (Good)
5.2 (Good)
4.8 (Good)
7.9 (Good)
7.8 (Good)
9 (Good)
9 (Good)
7.7 (Good)
data source »
Rivi��re-des-Prairies
Saturday, July 1, 2023, 10:00 PM
O3 0.04 (Good)
ozone (O3)
CO 0.6 (Good)
carbon monoxide (CO)
NO2 0.01 (Good)
nitrogen dioxide (NO2)
PM2,5 39 (Unhealthy for Sensitive Groups)
particulate matter (PM2.5) dust
Rivi��re-des-Prairies
index
2023-07-01
2023-07-06
2023-07-02
2023-07-08
2023-07-04
2023-07-03
2023-07-07
2023-07-05
o3
0.03
0.04
0.04
0.02
0.03
0.03
0.04
0.03
co
0.56
0.25
0.49
0.19
0.4
0.47
0.19
0.38
no2
0.01
0
0
0.01
0.01
0
0.01
0.01
pm25
40
12
21
4.6
16
12
7.9
11
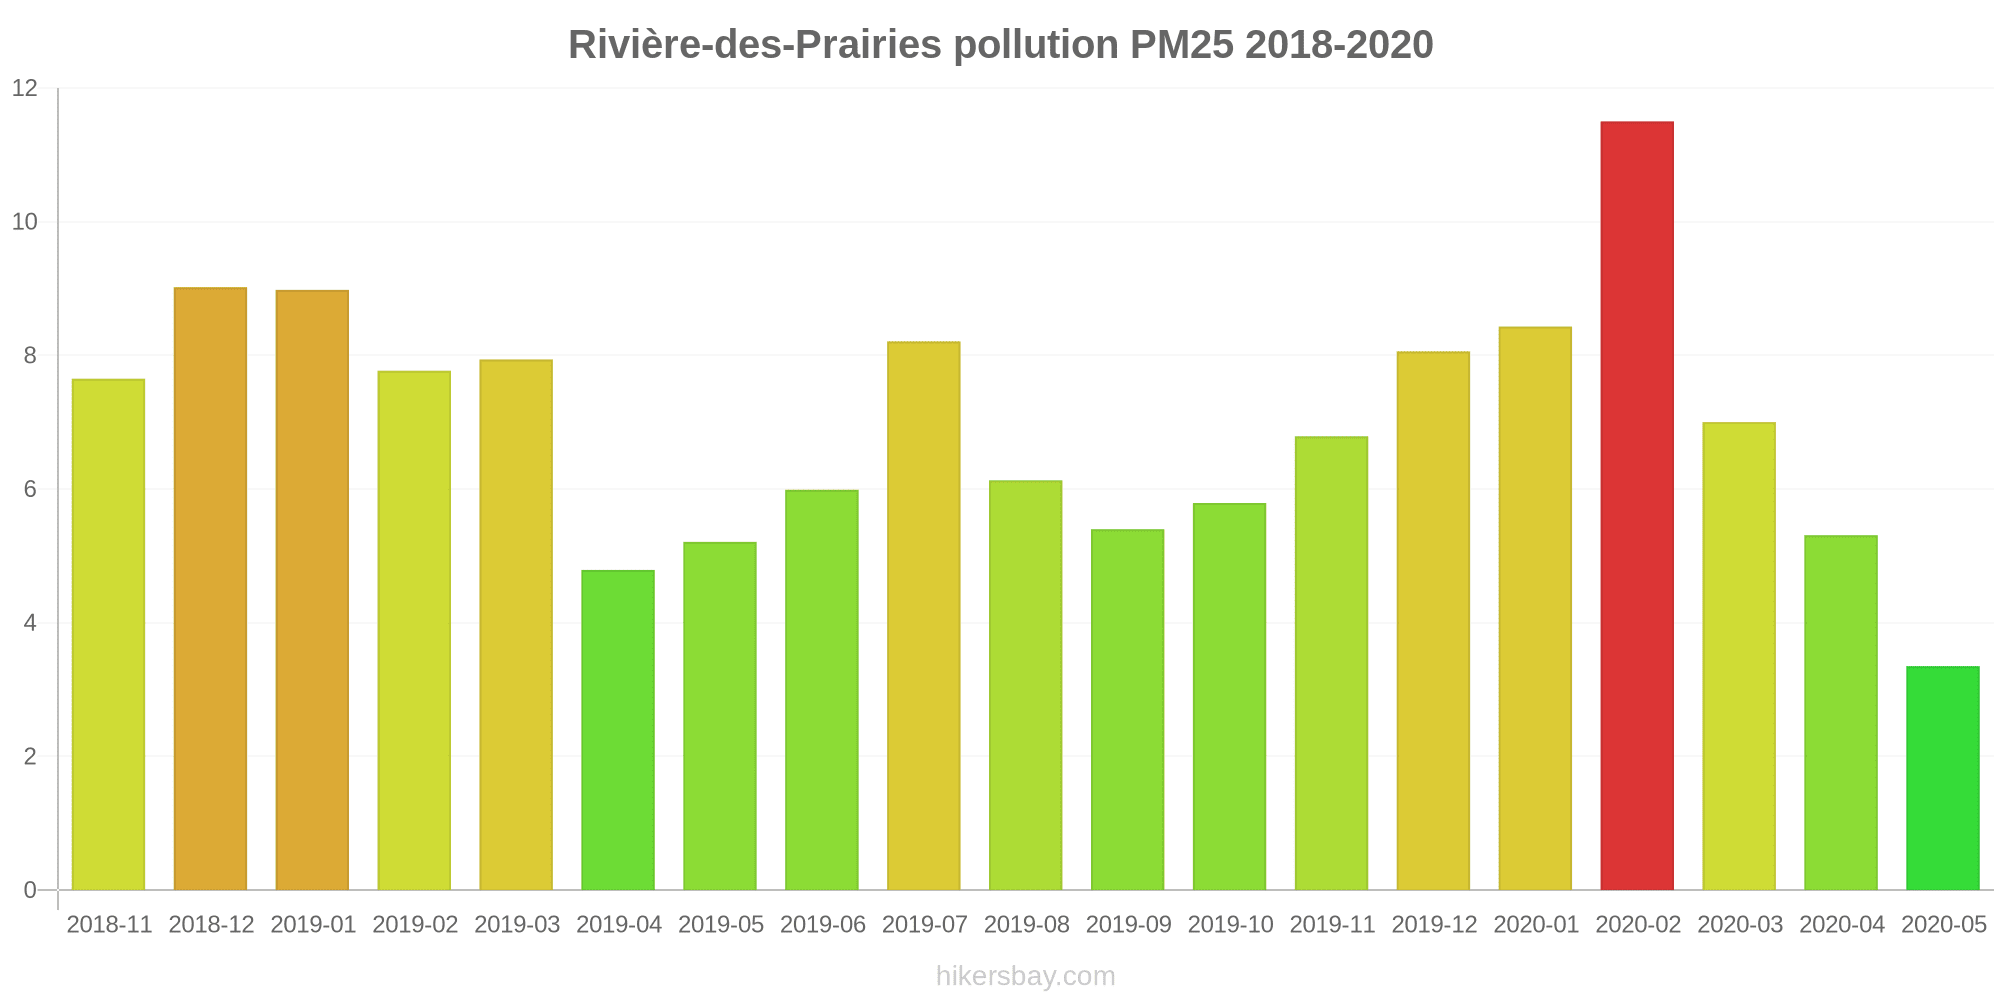
Rivière-des-Prairies
2018-11 2020-05

index
2020-05
2020-04
2020-03
2020-02
2020-01
2019-12
2019-11
2019-10
2019-09
2019-08
2019-07
2019-06
2019-05
2019-04
2019-03
2019-02
2019-01
2018-12
2018-11
co:ppm
0.15
0.17
0.2
0.24
0.23
0.2
0.18
0.18
0.17
0.16
0.17
0.16
0.16
0.18
0.22
0.22
0.23
0.22
0.28
no2:ppm
0
0
0.01
0.01
0.01
0.01
0.01
0.01
0.01
0
0
0
0
0
0.01
0.01
0.01
0.01
0.01
o3:ppm
0.03
0.03
0.03
0.03
0.02
0.02
0.02
0.02
0.02
0.02
0.03
0.03
0.03
0.03
0.04
0.03
0.03
0.02
0.02
pm25
3.4
5.3
7
12
8.4
8.1
6.8
5.8
5.4
6.1
8.2
6
5.2
4.8
7.9
7.8
9
9
7.7
* Pollution data source:
https://openaq.org
(AirNow)
The data is licensed under CC-By 4.0
O3 0 (Good)
CO 1 (Good)
NO2 0 (Good)
PM2,5 39 (Unhealthy for Sensitive Groups)
Data on air pollution from recent days in Plage-Chartrand
| index | 2023-07-05 | 2023-07-07 | 2023-07-03 | 2023-07-04 | 2023-07-08 | 2023-07-02 | 2023-07-06 | 2023-07-01 |
|---|---|---|---|---|---|---|---|---|
| o3 | 0 Good |
0 Good |
0 Good |
0 Good |
0 Good |
0 Good |
0 Good |
0 Good |
| co | 0 Good |
0 Good |
0 Good |
0 Good |
0 Good |
0 Good |
0 Good |
1 Good |
| no2 | 0 Good |
0 Good |
0 Good |
0 Good |
0 Good |
0 Good |
0 Good |
0 Good |
| pm25 | 11 Good |
8 Good |
12 Good |
16 Moderate |
5 Good |
21 Moderate |
12 Good |
40 Unhealthy for Sensitive Groups |

| index | 2020-05 | 2020-04 | 2020-03 | 2020-02 | 2020-01 | 2019-12 | 2019-11 | 2019-10 | 2019-09 | 2019-08 | 2019-07 | 2019-06 | 2019-05 | 2019-04 | 2019-03 | 2019-02 | 2019-01 | 2018-12 | 2018-11 |
|---|---|---|---|---|---|---|---|---|---|---|---|---|---|---|---|---|---|---|---|
| co:ppm | 0.15 (Good) | 0.17 (Good) | 0.2 (Good) | 0.24 (Good) | 0.23 (Good) | 0.2 (Good) | 0.18 (Good) | 0.18 (Good) | 0.17 (Good) | 0.16 (Good) | 0.17 (Good) | 0.16 (Good) | 0.16 (Good) | 0.18 (Good) | 0.22 (Good) | 0.22 (Good) | 0.23 (Good) | 0.22 (Good) | 0.28 (Good) |
| no2:ppm | 0 (Good) | 0 (Good) | 0.01 (Good) | 0.01 (Good) | 0.01 (Good) | 0.01 (Good) | 0.01 (Good) | 0.01 (Good) | 0.01 (Good) | 0 (Good) | 0 (Good) | 0 (Good) | 0 (Good) | 0 (Good) | 0.01 (Good) | 0.01 (Good) | 0.01 (Good) | 0.01 (Good) | 0.01 (Good) |
| o3:ppm | 0.03 (Good) | 0.03 (Good) | 0.03 (Good) | 0.03 (Good) | 0.02 (Good) | 0.02 (Good) | 0.02 (Good) | 0.02 (Good) | 0.02 (Good) | 0.02 (Good) | 0.03 (Good) | 0.03 (Good) | 0.03 (Good) | 0.03 (Good) | 0.04 (Good) | 0.03 (Good) | 0.03 (Good) | 0.02 (Good) | 0.02 (Good) |
| pm25 | 3.4 (Good) | 5.3 (Good) | 7 (Good) | 12 (Good) | 8.4 (Good) | 8.1 (Good) | 6.8 (Good) | 5.8 (Good) | 5.4 (Good) | 6.1 (Good) | 8.2 (Good) | 6 (Good) | 5.2 (Good) | 4.8 (Good) | 7.9 (Good) | 7.8 (Good) | 9 (Good) | 9 (Good) | 7.7 (Good) |
O3 0.04 (Good)
ozone (O3)CO 0.6 (Good)
carbon monoxide (CO)NO2 0.01 (Good)
nitrogen dioxide (NO2)PM2,5 39 (Unhealthy for Sensitive Groups)
particulate matter (PM2.5) dustRivi��re-des-Prairies
| index | 2023-07-01 | 2023-07-06 | 2023-07-02 | 2023-07-08 | 2023-07-04 | 2023-07-03 | 2023-07-07 | 2023-07-05 |
|---|---|---|---|---|---|---|---|---|
| o3 | 0.03 | 0.04 | 0.04 | 0.02 | 0.03 | 0.03 | 0.04 | 0.03 |
| co | 0.56 | 0.25 | 0.49 | 0.19 | 0.4 | 0.47 | 0.19 | 0.38 |
| no2 | 0.01 | 0 | 0 | 0.01 | 0.01 | 0 | 0.01 | 0.01 |
| pm25 | 40 | 12 | 21 | 4.6 | 16 | 12 | 7.9 | 11 |
Rivière-des-Prairies
| index | 2020-05 | 2020-04 | 2020-03 | 2020-02 | 2020-01 | 2019-12 | 2019-11 | 2019-10 | 2019-09 | 2019-08 | 2019-07 | 2019-06 | 2019-05 | 2019-04 | 2019-03 | 2019-02 | 2019-01 | 2018-12 | 2018-11 |
|---|---|---|---|---|---|---|---|---|---|---|---|---|---|---|---|---|---|---|---|
| co:ppm | 0.15 | 0.17 | 0.2 | 0.24 | 0.23 | 0.2 | 0.18 | 0.18 | 0.17 | 0.16 | 0.17 | 0.16 | 0.16 | 0.18 | 0.22 | 0.22 | 0.23 | 0.22 | 0.28 |
| no2:ppm | 0 | 0 | 0.01 | 0.01 | 0.01 | 0.01 | 0.01 | 0.01 | 0.01 | 0 | 0 | 0 | 0 | 0 | 0.01 | 0.01 | 0.01 | 0.01 | 0.01 |
| o3:ppm | 0.03 | 0.03 | 0.03 | 0.03 | 0.02 | 0.02 | 0.02 | 0.02 | 0.02 | 0.02 | 0.03 | 0.03 | 0.03 | 0.03 | 0.04 | 0.03 | 0.03 | 0.02 | 0.02 |
| pm25 | 3.4 | 5.3 | 7 | 12 | 8.4 | 8.1 | 6.8 | 5.8 | 5.4 | 6.1 | 8.2 | 6 | 5.2 | 4.8 | 7.9 | 7.8 | 9 | 9 | 7.7 |