Air Pollution in North Red Deer: Real-time Air Quality Index and smog alert.
Pollution and air quality forecast for North Red Deer. Today is Tuesday, June 16, 2026. The following air pollution values have been recorded for North Red Deer:- particulate matter (PM2.5) dust - 4 (Good)
- ozone (O3) - 0 (Good)

What is the air quality in North Red Deer today? Is the air polluted in North Red Deer?. Is there smog?
What is the current level of PM2.5 in North Red Deer? (particulate matter (PM2.5) dust)
Today's PM2.5 level is:
4 (Good)
For comparison, the highest level of PM2.5 in North Red Deer in the last 7 days was: 7 (Monday, April 15, 2024) and the lowest: 2 (Wednesday, April 10, 2024).
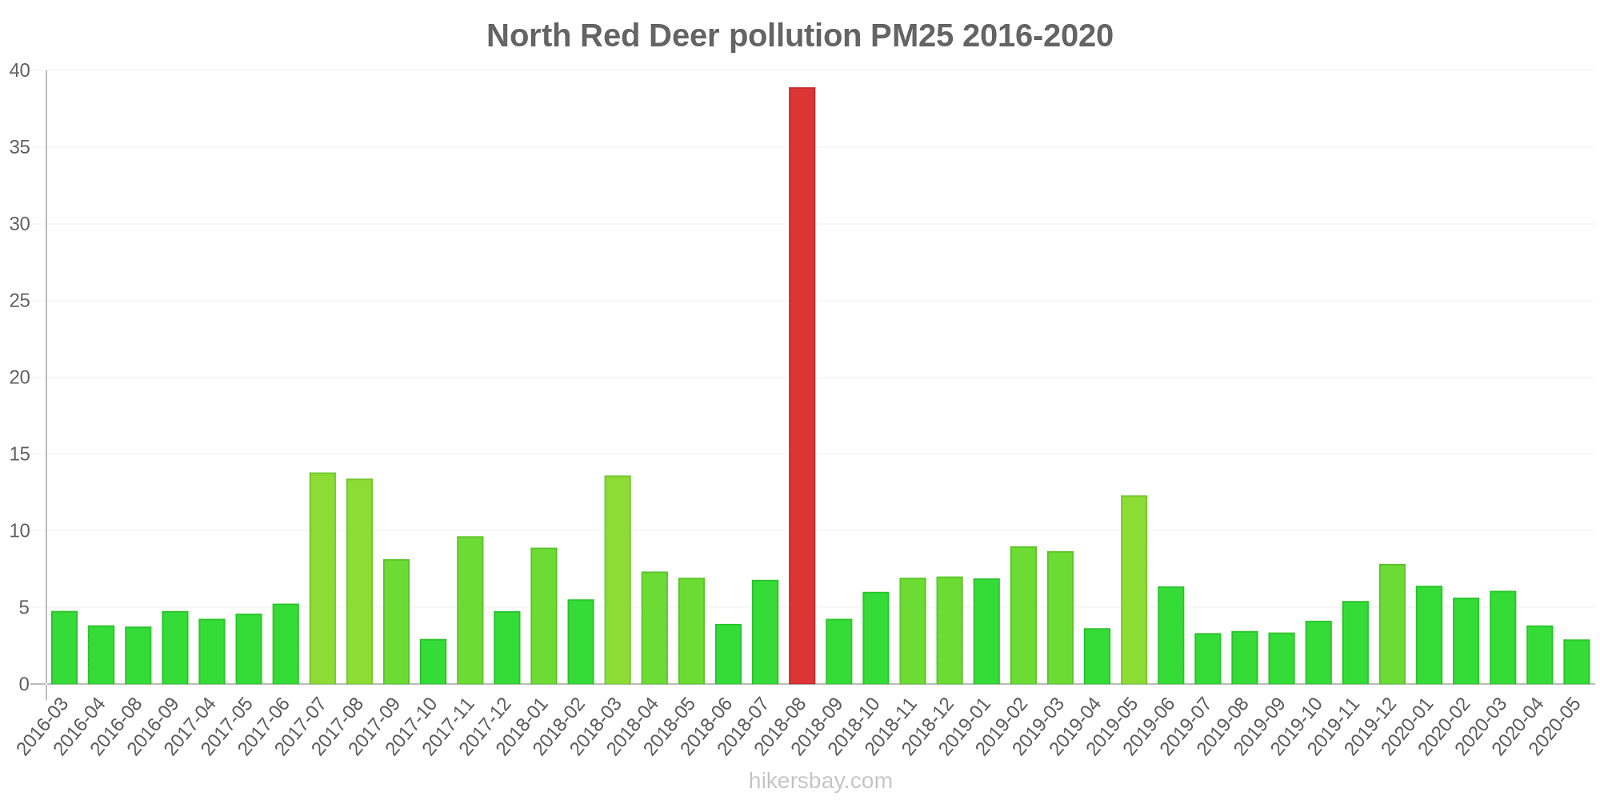
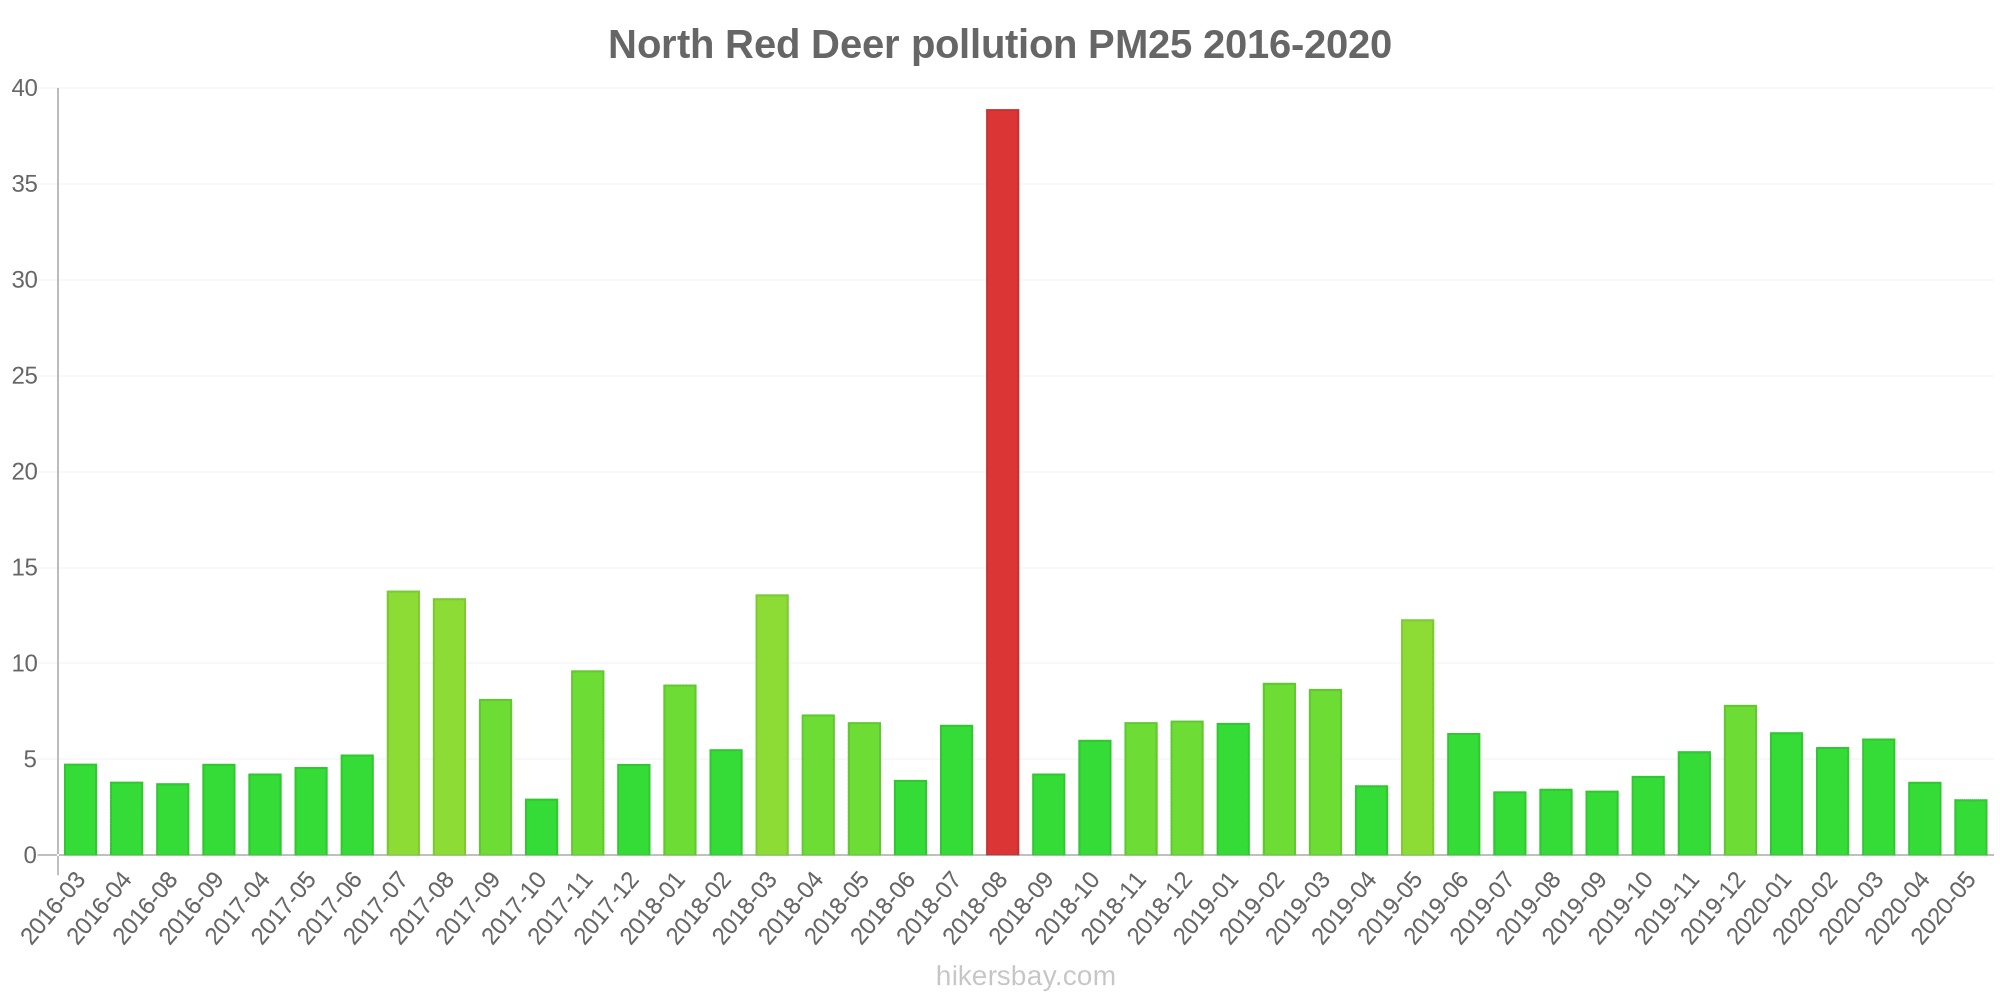
The highest PM2.5 values were recorded: 39 (August 2018).
The lowest level of particulate matter PM2.5 pollution occurs in month: May (2.9).
How is the O3 level today in North Red Deer? (ozone (O3))
0 (Good)
Current data Tuesday, April 16, 2024, 10:00 AM
PM2,5 4 (Good)
O3 0 (Good)
Data on air pollution from recent days in North Red Deer
index
2024-04-09
2024-04-10
2024-04-11
2024-04-12
2024-04-13
2024-04-14
2024-04-15
2024-04-16
pm25
6
Good
2
Good
5
Good
4
Good
5
Good
5
Good
7
Good
5
Good
o3
0
Good
0
Good
0
Good
0
Good
0
Good
0
Good
0
Good
0
Good
data source »
Air pollution in North Red Deer from March 2016 to May 2020
index
2020-05
2020-04
2020-03
2020-02
2020-01
2019-12
2019-11
2019-10
2019-09
2019-08
2019-07
2019-06
2019-05
2019-04
2019-03
2019-02
2019-01
2018-12
2018-11
2018-10
2018-09
2018-08
2018-07
2018-06
2018-05
2018-04
2018-03
2018-02
2018-01
2017-12
2017-11
2017-10
2017-09
2017-08
2017-07
2017-06
2017-05
2017-04
2016-09
2016-08
2016-04
2016-03
o3:ppm
0.04 (Good)
0.04 (Good)
0.03 (Good)
0.02 (Good)
0.02 (Good)
0.01 (Good)
0.02 (Good)
0.02 (Good)
0.02 (Good)
0.02 (Good)
0.02 (Good)
0.03 (Good)
0.04 (Good)
0.04 (Good)
0.03 (Good)
0.02 (Good)
0.02 (Good)
0.02 (Good)
0.01 (Good)
0.02 (Good)
0.02 (Good)
0.03 (Good)
0.03 (Good)
0.04 (Good)
0.04 (Good)
0.04 (Good)
0.04 (Good)
0.02 (Good)
0.02 (Good)
0.02 (Good)
0.02 (Good)
0.02 (Good)
0.02 (Good)
0.03 (Good)
0.03 (Good)
0.03 (Good)
0.03 (Good)
0.03 (Good)
- (Good)
0.01 (Good)
0.02 (Good)
0.02 (Good)
pm25
2.9 (Good)
3.8 (Good)
6.1 (Good)
5.6 (Good)
6.4 (Good)
7.8 (Good)
5.4 (Good)
4.1 (Good)
3.4 (Good)
3.5 (Good)
3.3 (Good)
6.4 (Good)
12 (Good)
3.6 (Good)
8.7 (Good)
9 (Good)
6.9 (Good)
7 (Good)
6.9 (Good)
6 (Good)
4.3 (Good)
39 (Unhealthy for Sensitive Groups)
6.8 (Good)
3.9 (Good)
6.9 (Good)
7.3 (Good)
14 (Moderate)
5.5 (Good)
8.9 (Good)
4.8 (Good)
9.6 (Good)
3 (Good)
8.2 (Good)
13 (Moderate)
14 (Moderate)
5.3 (Good)
4.6 (Good)
4.3 (Good)
4.8 (Good)
3.8 (Good)
3.8 (Good)
4.8 (Good)
data source »
RED DEER RIVERSIDE D
Tuesday, April 16, 2024, 10:00 AM
PM2,5 3.7 (Good)
particulate matter (PM2.5) dust
O3 0.03 (Good)
ozone (O3)
RED DEER RIVERSIDE D
index
2024-04-16
2024-04-15
2024-04-14
2024-04-13
2024-04-12
2024-04-11
2024-04-10
2024-04-09
pm25
5
7.3
5.2
5.3
4.5
4.9
2.2
5.7
o3
0.04
0.04
0.04
0.04
0.04
0.03
0.04
0.03
RED DEER RIVERSIDE D
2018-07 2020-05
index
2020-05
2020-04
2020-03
2020-02
2020-01
2019-12
2019-11
2019-10
2019-09
2019-08
2019-07
2019-06
2019-05
2019-04
2019-03
2019-02
2019-01
2018-12
2018-11
2018-10
2018-09
2018-08
2018-07
o3:ppm
0.04
0.04
0.03
0.02
0.02
0.01
0.02
0.02
0.02
0.02
0.02
0.03
0.04
0.04
0.03
0.02
0.02
0.02
0.01
0.02
0.02
0.03
0.03
pm25
2.9
3.8
6.1
5.6
6.4
7.8
5.4
4.1
3.4
3.5
3.3
6.4
12
3.6
8.7
9
6.9
7
6.9
6
4.3
39
9.6
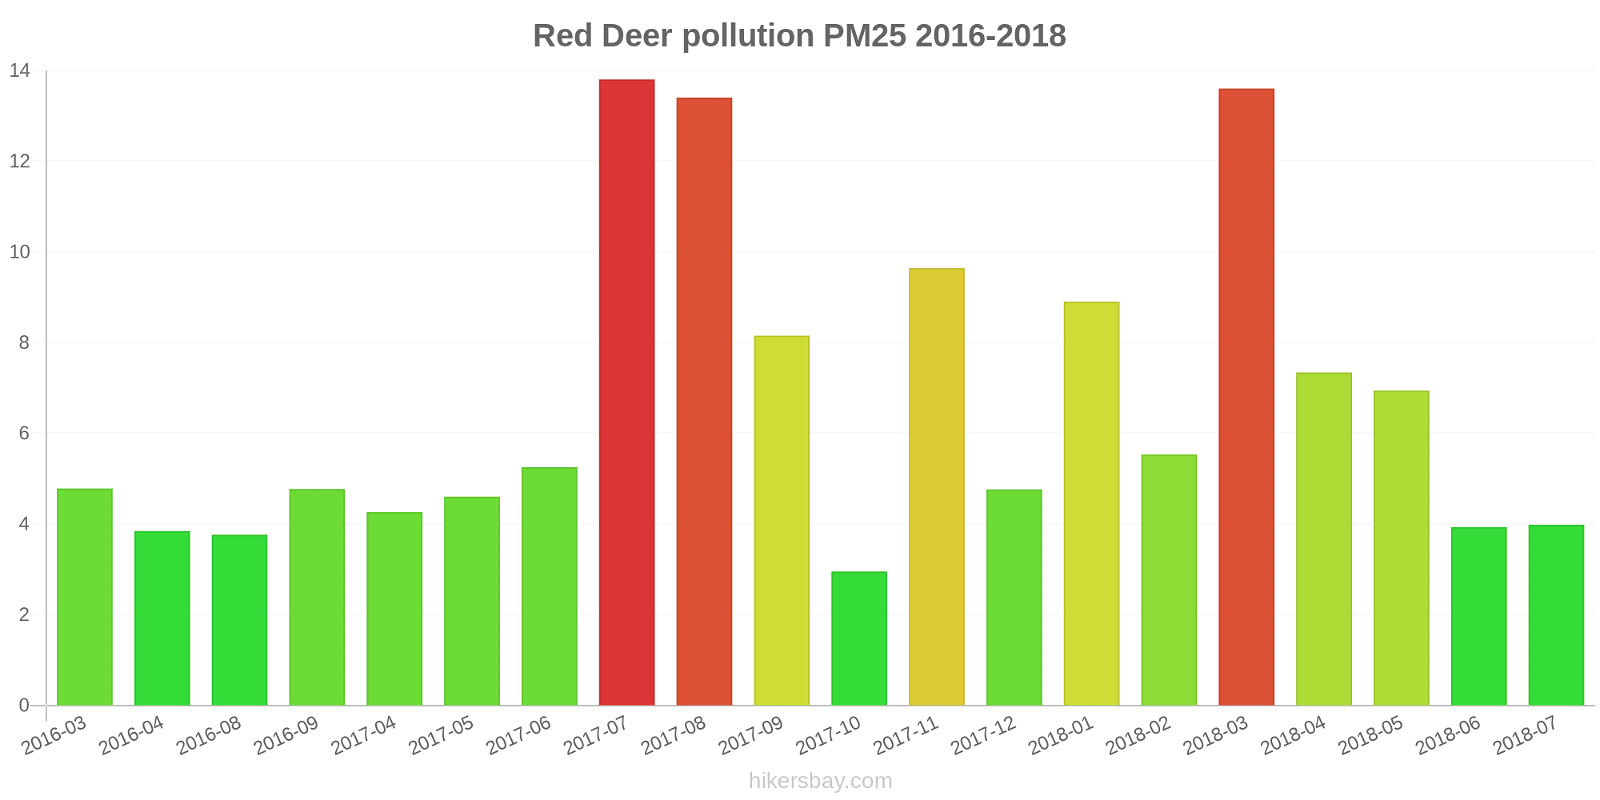
Red Deer
2016-03 2018-07
index
2018-07
2018-06
2018-05
2018-04
2018-03
2018-02
2018-01
2017-12
2017-11
2017-10
2017-09
2017-08
2017-07
2017-06
2017-05
2017-04
2016-09
2016-08
2016-04
2016-03
pm25
4
3.9
6.9
7.3
14
5.5
8.9
4.8
9.6
3
8.2
13
14
5.3
4.6
4.3
4.8
3.8
3.8
4.8
o3:ppm
0.04
0.04
0.04
0.04
0.04
0.02
0.02
0.02
0.02
0.02
0.02
0.03
0.03
0.03
0.03
0.03
-
0.01
0.02
0.02
* Pollution data source:
https://openaq.org
(AirNow)
The data is licensed under CC-By 4.0
PM2,5 4 (Good)
O3 0 (Good)
Data on air pollution from recent days in North Red Deer
| index | 2024-04-09 | 2024-04-10 | 2024-04-11 | 2024-04-12 | 2024-04-13 | 2024-04-14 | 2024-04-15 | 2024-04-16 |
|---|---|---|---|---|---|---|---|---|
| pm25 | 6 Good |
2 Good |
5 Good |
4 Good |
5 Good |
5 Good |
7 Good |
5 Good |
| o3 | 0 Good |
0 Good |
0 Good |
0 Good |
0 Good |
0 Good |
0 Good |
0 Good |
| index | 2020-05 | 2020-04 | 2020-03 | 2020-02 | 2020-01 | 2019-12 | 2019-11 | 2019-10 | 2019-09 | 2019-08 | 2019-07 | 2019-06 | 2019-05 | 2019-04 | 2019-03 | 2019-02 | 2019-01 | 2018-12 | 2018-11 | 2018-10 | 2018-09 | 2018-08 | 2018-07 | 2018-06 | 2018-05 | 2018-04 | 2018-03 | 2018-02 | 2018-01 | 2017-12 | 2017-11 | 2017-10 | 2017-09 | 2017-08 | 2017-07 | 2017-06 | 2017-05 | 2017-04 | 2016-09 | 2016-08 | 2016-04 | 2016-03 |
|---|---|---|---|---|---|---|---|---|---|---|---|---|---|---|---|---|---|---|---|---|---|---|---|---|---|---|---|---|---|---|---|---|---|---|---|---|---|---|---|---|---|---|
| o3:ppm | 0.04 (Good) | 0.04 (Good) | 0.03 (Good) | 0.02 (Good) | 0.02 (Good) | 0.01 (Good) | 0.02 (Good) | 0.02 (Good) | 0.02 (Good) | 0.02 (Good) | 0.02 (Good) | 0.03 (Good) | 0.04 (Good) | 0.04 (Good) | 0.03 (Good) | 0.02 (Good) | 0.02 (Good) | 0.02 (Good) | 0.01 (Good) | 0.02 (Good) | 0.02 (Good) | 0.03 (Good) | 0.03 (Good) | 0.04 (Good) | 0.04 (Good) | 0.04 (Good) | 0.04 (Good) | 0.02 (Good) | 0.02 (Good) | 0.02 (Good) | 0.02 (Good) | 0.02 (Good) | 0.02 (Good) | 0.03 (Good) | 0.03 (Good) | 0.03 (Good) | 0.03 (Good) | 0.03 (Good) | - (Good) | 0.01 (Good) | 0.02 (Good) | 0.02 (Good) |
| pm25 | 2.9 (Good) | 3.8 (Good) | 6.1 (Good) | 5.6 (Good) | 6.4 (Good) | 7.8 (Good) | 5.4 (Good) | 4.1 (Good) | 3.4 (Good) | 3.5 (Good) | 3.3 (Good) | 6.4 (Good) | 12 (Good) | 3.6 (Good) | 8.7 (Good) | 9 (Good) | 6.9 (Good) | 7 (Good) | 6.9 (Good) | 6 (Good) | 4.3 (Good) | 39 (Unhealthy for Sensitive Groups) | 6.8 (Good) | 3.9 (Good) | 6.9 (Good) | 7.3 (Good) | 14 (Moderate) | 5.5 (Good) | 8.9 (Good) | 4.8 (Good) | 9.6 (Good) | 3 (Good) | 8.2 (Good) | 13 (Moderate) | 14 (Moderate) | 5.3 (Good) | 4.6 (Good) | 4.3 (Good) | 4.8 (Good) | 3.8 (Good) | 3.8 (Good) | 4.8 (Good) |
PM2,5 3.7 (Good)
particulate matter (PM2.5) dustO3 0.03 (Good)
ozone (O3)RED DEER RIVERSIDE D
| index | 2024-04-16 | 2024-04-15 | 2024-04-14 | 2024-04-13 | 2024-04-12 | 2024-04-11 | 2024-04-10 | 2024-04-09 |
|---|---|---|---|---|---|---|---|---|
| pm25 | 5 | 7.3 | 5.2 | 5.3 | 4.5 | 4.9 | 2.2 | 5.7 |
| o3 | 0.04 | 0.04 | 0.04 | 0.04 | 0.04 | 0.03 | 0.04 | 0.03 |
RED DEER RIVERSIDE D

| index | 2020-05 | 2020-04 | 2020-03 | 2020-02 | 2020-01 | 2019-12 | 2019-11 | 2019-10 | 2019-09 | 2019-08 | 2019-07 | 2019-06 | 2019-05 | 2019-04 | 2019-03 | 2019-02 | 2019-01 | 2018-12 | 2018-11 | 2018-10 | 2018-09 | 2018-08 | 2018-07 |
|---|---|---|---|---|---|---|---|---|---|---|---|---|---|---|---|---|---|---|---|---|---|---|---|
| o3:ppm | 0.04 | 0.04 | 0.03 | 0.02 | 0.02 | 0.01 | 0.02 | 0.02 | 0.02 | 0.02 | 0.02 | 0.03 | 0.04 | 0.04 | 0.03 | 0.02 | 0.02 | 0.02 | 0.01 | 0.02 | 0.02 | 0.03 | 0.03 |
| pm25 | 2.9 | 3.8 | 6.1 | 5.6 | 6.4 | 7.8 | 5.4 | 4.1 | 3.4 | 3.5 | 3.3 | 6.4 | 12 | 3.6 | 8.7 | 9 | 6.9 | 7 | 6.9 | 6 | 4.3 | 39 | 9.6 |
Red Deer
| index | 2018-07 | 2018-06 | 2018-05 | 2018-04 | 2018-03 | 2018-02 | 2018-01 | 2017-12 | 2017-11 | 2017-10 | 2017-09 | 2017-08 | 2017-07 | 2017-06 | 2017-05 | 2017-04 | 2016-09 | 2016-08 | 2016-04 | 2016-03 |
|---|---|---|---|---|---|---|---|---|---|---|---|---|---|---|---|---|---|---|---|---|
| pm25 | 4 | 3.9 | 6.9 | 7.3 | 14 | 5.5 | 8.9 | 4.8 | 9.6 | 3 | 8.2 | 13 | 14 | 5.3 | 4.6 | 4.3 | 4.8 | 3.8 | 3.8 | 4.8 |
| o3:ppm | 0.04 | 0.04 | 0.04 | 0.04 | 0.04 | 0.02 | 0.02 | 0.02 | 0.02 | 0.02 | 0.02 | 0.03 | 0.03 | 0.03 | 0.03 | 0.03 | - | 0.01 | 0.02 | 0.02 |