Air Pollution in Fort McMurray: Real-time Air Quality Index and smog alert.
Pollution and air quality forecast for Fort McMurray. Today is Tuesday, June 16, 2026. The following air pollution values have been recorded for Fort McMurray:- ozone (O3) - 0 (Good)
- particulate matter (PM2.5) dust - 3 (Good)

What is the air quality in Fort McMurray today? Is the air polluted in Fort McMurray?. Is there smog?
How is the O3 level today in Fort McMurray? (ozone (O3))
0 (Good)
What is the current level of PM2.5 in Fort McMurray? (particulate matter (PM2.5) dust)
Today's PM2.5 level is:
3 (Good)
For comparison, the highest level of PM2.5 in Fort McMurray in the last 7 days was: 6 (Monday, April 15, 2024) and the lowest: 2 (Wednesday, April 10, 2024).
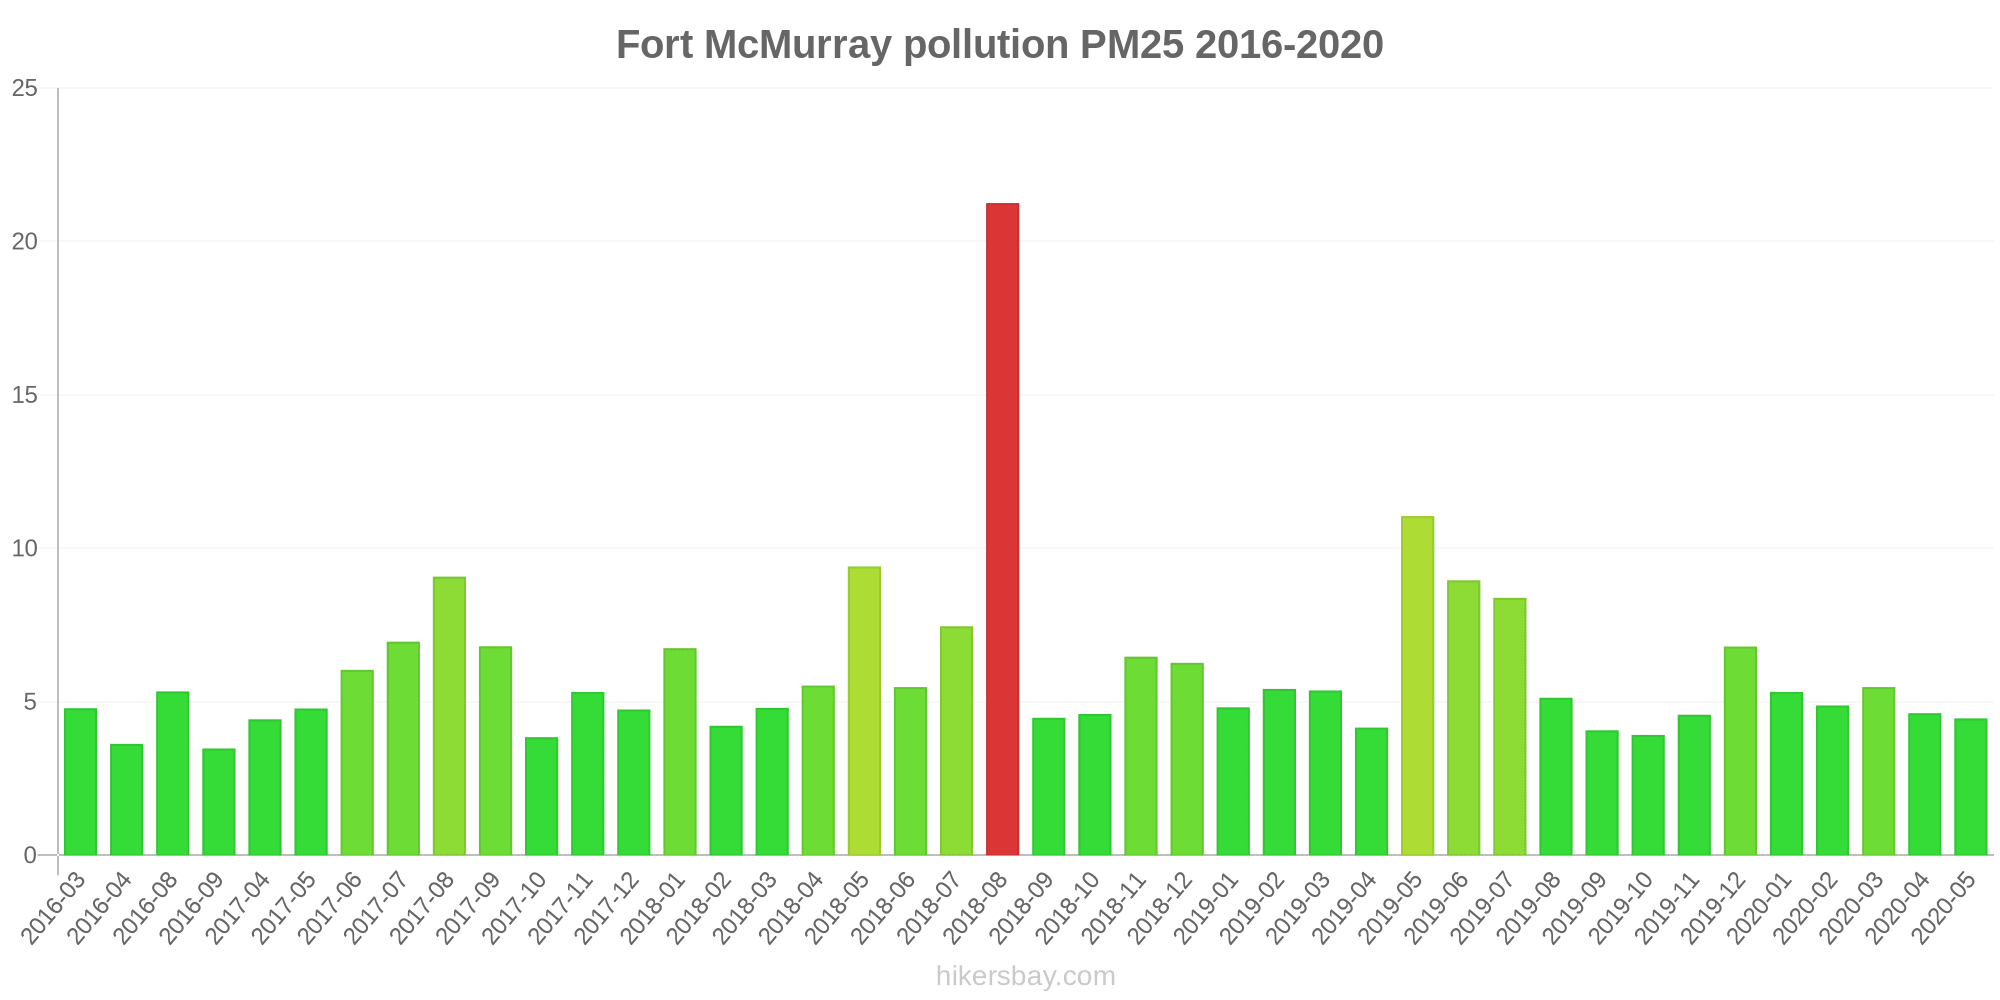
The highest PM2.5 values were recorded: 21 (August 2018).
The lowest level of particulate matter PM2.5 pollution occurs in month: September (3.5).
Current data Tuesday, April 16, 2024, 10:00 AM
O3 0 (Good)
PM2,5 3 (Good)
Data on air pollution from recent days in Fort McMurray
index
2024-04-09
2024-04-10
2024-04-11
2024-04-12
2024-04-13
2024-04-14
2024-04-15
2024-04-16
o3
0
Good
0
Good
0
Good
0
Good
0
Good
0
Good
0
Good
0
Good
pm25
4
Good
2
Good
3
Good
2
Good
2
Good
2
Good
6
Good
4
Good
data source »
Air pollution in Fort McMurray from March 2016 to May 2020

index
2020-05
2020-04
2020-03
2020-02
2020-01
2019-12
2019-11
2019-10
2019-09
2019-08
2019-07
2019-06
2019-05
2019-04
2019-03
2019-02
2019-01
2018-12
2018-11
2018-10
2018-09
2018-08
2018-07
2018-06
2018-05
2018-04
2018-03
2018-02
2018-01
2017-12
2017-11
2017-10
2017-09
2017-08
2017-07
2017-06
2017-05
2017-04
2016-09
2016-08
2016-04
2016-03
o3:ppm
0.03 (Good)
0.03 (Good)
0.03 (Good)
0.02 (Good)
0.02 (Good)
0.01 (Good)
0.02 (Good)
0.02 (Good)
0.02 (Good)
0.02 (Good)
0.02 (Good)
0.03 (Good)
0.03 (Good)
0.03 (Good)
0.03 (Good)
0.02 (Good)
0.02 (Good)
0.02 (Good)
0.02 (Good)
0.02 (Good)
0.02 (Good)
0.02 (Good)
0.02 (Good)
0.03 (Good)
0.04 (Good)
0.04 (Good)
0.03 (Good)
0.03 (Good)
0.02 (Good)
0.02 (Good)
0.02 (Good)
0.02 (Good)
0.02 (Good)
0.03 (Good)
0.03 (Good)
0.03 (Good)
0.03 (Good)
0.03 (Good)
0.01 (Good)
0.02 (Good)
0.03 (Good)
0.03 (Good)
pm25
4.5 (Good)
4.6 (Good)
5.5 (Good)
4.9 (Good)
5.3 (Good)
6.8 (Good)
4.6 (Good)
3.9 (Good)
4.1 (Good)
5.1 (Good)
8.4 (Good)
9 (Good)
11 (Good)
4.2 (Good)
5.4 (Good)
5.4 (Good)
4.8 (Good)
6.3 (Good)
6.5 (Good)
4.6 (Good)
4.5 (Good)
21 (Moderate)
7.5 (Good)
5.5 (Good)
9.4 (Good)
5.5 (Good)
4.8 (Good)
4.2 (Good)
6.8 (Good)
4.8 (Good)
5.3 (Good)
3.9 (Good)
6.8 (Good)
9.1 (Good)
7 (Good)
6 (Good)
4.8 (Good)
4.4 (Good)
3.5 (Good)
5.3 (Good)
3.6 (Good)
4.8 (Good)
data source »
Quality of life in Fort McMurray
Green and Parks in the City
Fort McMurray
74%
United States: 70%
Venezuela: 41%
Iceland: 72%
particulate matter PM2.5
Fort McMurray
8 (Good)
Pleasure of spending time in the city
Fort McMurray
61%
United States: 75%
The Bahamas: 53%
Venezuela: 41%
Iceland: 89%
particulate matter PM10
Fort McMurray
15 (Good)
Air Pollution
Fort McMurray
34%
United States: 29%
The Bahamas: 52%
Venezuela: 59%
Iceland: 13%
Garbage Disposal
Fort McMurray
70%
United States: 71%
The Bahamas: 29%
Venezuela: 18%
Iceland: 79%
Availability and quality of drinking water
Fort McMurray
62%
United States: 71%
The Bahamas: 55%
Venezuela: 28%
Iceland: 96%
Cleanliness and tidiness
Fort McMurray
46%
United States: 60%
The Bahamas: 35%
Venezuela: 22%
Iceland: 75%
Noise and Light pollution
Fort McMurray
34%
United States: 47%
The Bahamas: 39%
Venezuela: 47%
Iceland: 23%
Water Pollution
Fort McMurray
49%
United States: 44%
The Bahamas: 58%
Venezuela: 76%
Iceland: 8.4%
Source: Numbeo
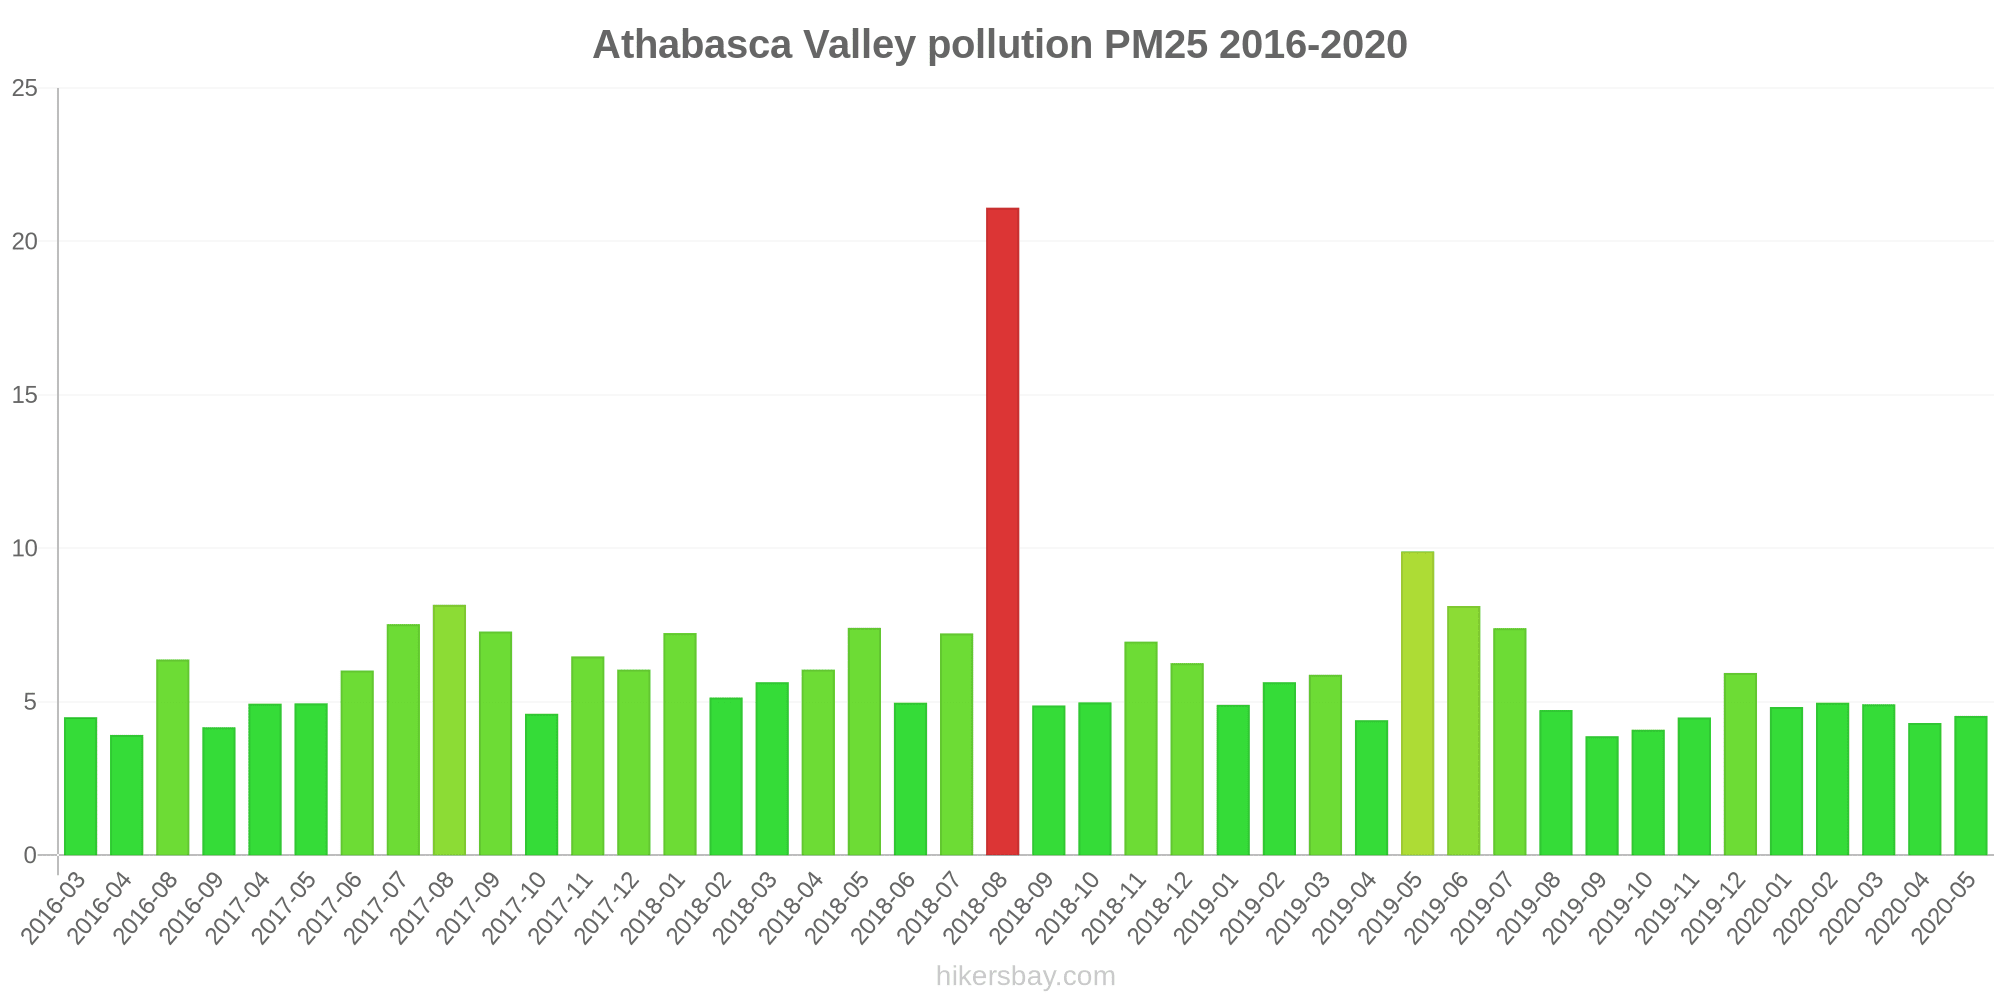
Athabasca Valley
Tuesday, April 16, 2024, 10:00 AM
O3 0.03 (Good)
ozone (O3)
PM2,5 3.5 (Good)
particulate matter (PM2.5) dust
Patricia McInnes
Tuesday, April 16, 2024, 10:00 AM
PM2,5 1.5 (Good)
particulate matter (PM2.5) dust
O3 0.04 (Good)
ozone (O3)
Athabasca Valley
index
2024-04-16
2024-04-15
2024-04-14
2024-04-13
2024-04-12
2024-04-11
2024-04-10
2024-04-09
o3
0.03
0.03
0.04
0.04
0.04
0.03
0.04
0.03
pm25
4.2
6.2
3.1
2.2
2.6
2.9
1.7
4.3
Patricia McInnes
index
2024-04-16
2024-04-15
2024-04-14
2024-04-13
2024-04-12
2024-04-11
2024-04-10
2024-04-09
o3
0.03
0.03
0.04
0.04
0.04
0.03
0.04
0.04
pm25
3.3
5.5
1.7
2.5
2.3
3
1.4
3.8
Athabasca Valley
2016-03 2020-05

index
2020-05
2020-04
2020-03
2020-02
2020-01
2019-12
2019-11
2019-10
2019-09
2019-08
2019-07
2019-06
2019-05
2019-04
2019-03
2019-02
2019-01
2018-12
2018-11
2018-10
2018-09
2018-08
2018-07
2018-06
2018-05
2018-04
2018-03
2018-02
2018-01
2017-12
2017-11
2017-10
2017-09
2017-08
2017-07
2017-06
2017-05
2017-04
2016-09
2016-08
2016-04
2016-03
o3:ppm
0.03
0.03
0.03
0.02
0.02
0.01
0.02
0.02
0.02
0.02
0.02
0.03
0.03
0.03
0.03
0.02
0.02
0.01
0.02
0.02
0.02
0.02
0.02
0.03
0.03
0.03
0.03
0.03
0.02
0.02
0.02
0.02
0.02
0.03
0.03
0.03
0.03
0.03
0.01
0.02
0.03
0.02
pm25
4.5
4.3
4.9
5
4.8
5.9
4.5
4.1
3.9
4.7
7.4
8.1
9.9
4.4
5.9
5.6
4.9
6.3
7
5
4.9
21
7.2
5
7.4
6
5.6
5.1
7.2
6
6.5
4.6
7.3
8.2
7.5
6
5
4.9
4.2
6.4
3.9
4.5
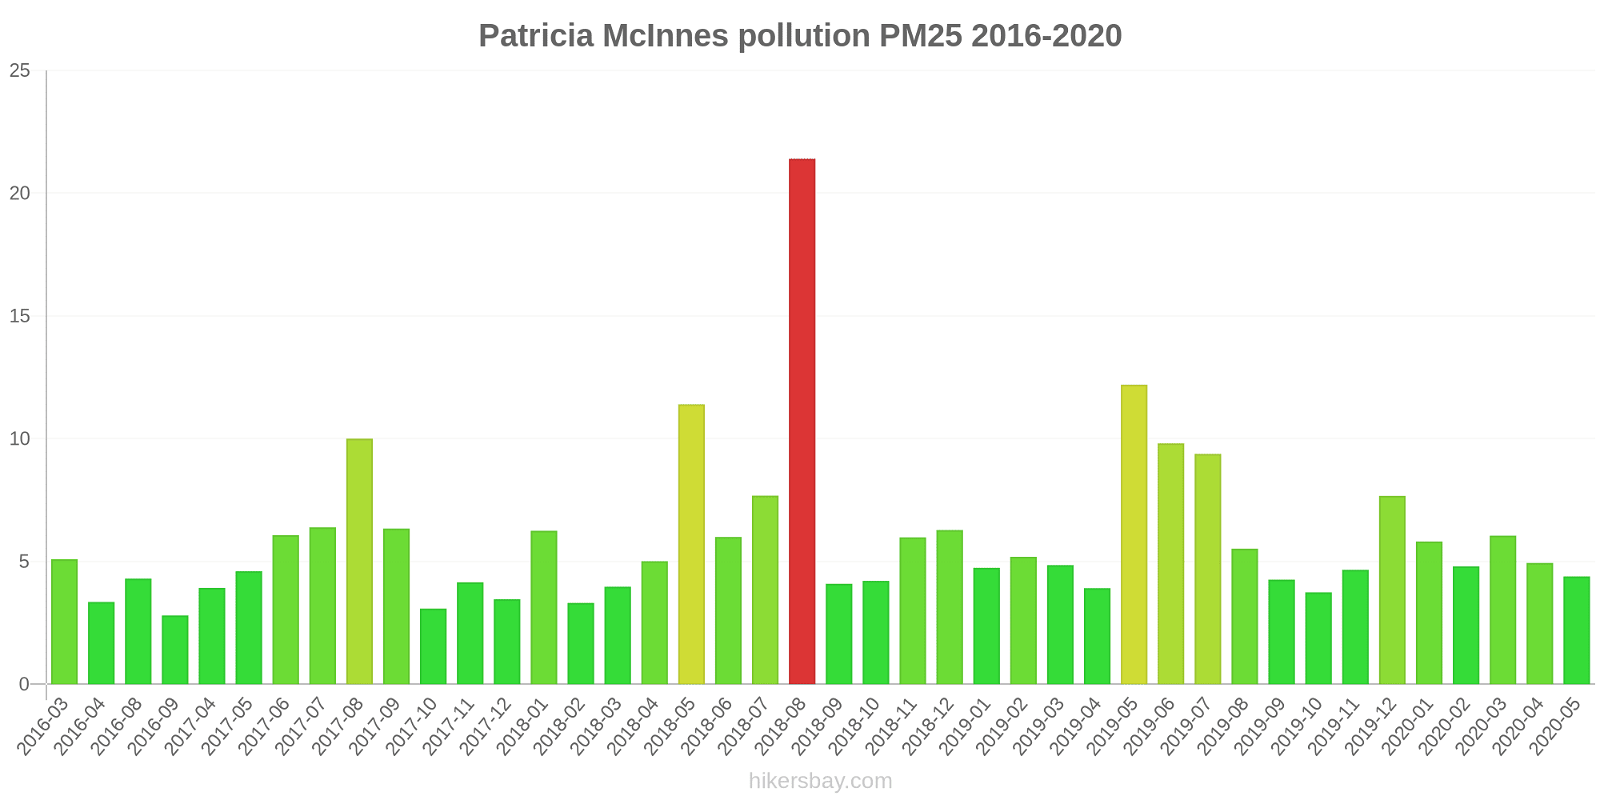
Patricia McInnes
2016-03 2020-05
index
2020-05
2020-04
2020-03
2020-02
2020-01
2019-12
2019-11
2019-10
2019-09
2019-08
2019-07
2019-06
2019-05
2019-04
2019-03
2019-02
2019-01
2018-12
2018-11
2018-10
2018-09
2018-08
2018-07
2018-06
2018-05
2018-04
2018-03
2018-02
2018-01
2017-12
2017-11
2017-10
2017-09
2017-08
2017-07
2017-06
2017-05
2017-04
2016-09
2016-08
2016-04
2016-03
pm25
4.4
4.9
6
4.8
5.8
7.7
4.7
3.7
4.3
5.5
9.4
9.8
12
3.9
4.8
5.2
4.7
6.3
6
4.2
4.1
21
7.7
6
11
5
4
3.3
6.3
3.5
4.2
3.1
6.3
10
6.4
6.1
4.6
3.9
2.8
4.3
3.4
5.1
o3:ppm
0.03
0.04
0.03
0.03
0.02
0.02
0.02
0.02
0.02
0.02
0.03
0.03
0.03
0.03
0.03
0.02
0.02
0.02
0.02
0.02
0.02
0.02
0.03
0.03
0.04
0.04
0.04
0.03
0.02
0.03
0.03
0.02
0.03
0.03
0.03
0.03
0.03
0.03
0.01
0.02
0.04
0.03
* Pollution data source:
https://openaq.org
(AirNow)
The data is licensed under CC-By 4.0
O3 0 (Good)
PM2,5 3 (Good)
Data on air pollution from recent days in Fort McMurray
| index | 2024-04-09 | 2024-04-10 | 2024-04-11 | 2024-04-12 | 2024-04-13 | 2024-04-14 | 2024-04-15 | 2024-04-16 |
|---|---|---|---|---|---|---|---|---|
| o3 | 0 Good |
0 Good |
0 Good |
0 Good |
0 Good |
0 Good |
0 Good |
0 Good |
| pm25 | 4 Good |
2 Good |
3 Good |
2 Good |
2 Good |
2 Good |
6 Good |
4 Good |
| index | 2020-05 | 2020-04 | 2020-03 | 2020-02 | 2020-01 | 2019-12 | 2019-11 | 2019-10 | 2019-09 | 2019-08 | 2019-07 | 2019-06 | 2019-05 | 2019-04 | 2019-03 | 2019-02 | 2019-01 | 2018-12 | 2018-11 | 2018-10 | 2018-09 | 2018-08 | 2018-07 | 2018-06 | 2018-05 | 2018-04 | 2018-03 | 2018-02 | 2018-01 | 2017-12 | 2017-11 | 2017-10 | 2017-09 | 2017-08 | 2017-07 | 2017-06 | 2017-05 | 2017-04 | 2016-09 | 2016-08 | 2016-04 | 2016-03 |
|---|---|---|---|---|---|---|---|---|---|---|---|---|---|---|---|---|---|---|---|---|---|---|---|---|---|---|---|---|---|---|---|---|---|---|---|---|---|---|---|---|---|---|
| o3:ppm | 0.03 (Good) | 0.03 (Good) | 0.03 (Good) | 0.02 (Good) | 0.02 (Good) | 0.01 (Good) | 0.02 (Good) | 0.02 (Good) | 0.02 (Good) | 0.02 (Good) | 0.02 (Good) | 0.03 (Good) | 0.03 (Good) | 0.03 (Good) | 0.03 (Good) | 0.02 (Good) | 0.02 (Good) | 0.02 (Good) | 0.02 (Good) | 0.02 (Good) | 0.02 (Good) | 0.02 (Good) | 0.02 (Good) | 0.03 (Good) | 0.04 (Good) | 0.04 (Good) | 0.03 (Good) | 0.03 (Good) | 0.02 (Good) | 0.02 (Good) | 0.02 (Good) | 0.02 (Good) | 0.02 (Good) | 0.03 (Good) | 0.03 (Good) | 0.03 (Good) | 0.03 (Good) | 0.03 (Good) | 0.01 (Good) | 0.02 (Good) | 0.03 (Good) | 0.03 (Good) |
| pm25 | 4.5 (Good) | 4.6 (Good) | 5.5 (Good) | 4.9 (Good) | 5.3 (Good) | 6.8 (Good) | 4.6 (Good) | 3.9 (Good) | 4.1 (Good) | 5.1 (Good) | 8.4 (Good) | 9 (Good) | 11 (Good) | 4.2 (Good) | 5.4 (Good) | 5.4 (Good) | 4.8 (Good) | 6.3 (Good) | 6.5 (Good) | 4.6 (Good) | 4.5 (Good) | 21 (Moderate) | 7.5 (Good) | 5.5 (Good) | 9.4 (Good) | 5.5 (Good) | 4.8 (Good) | 4.2 (Good) | 6.8 (Good) | 4.8 (Good) | 5.3 (Good) | 3.9 (Good) | 6.8 (Good) | 9.1 (Good) | 7 (Good) | 6 (Good) | 4.8 (Good) | 4.4 (Good) | 3.5 (Good) | 5.3 (Good) | 3.6 (Good) | 4.8 (Good) |
Green and Parks in the City
Fort McMurray 74%
United States: 70% Venezuela: 41% Iceland: 72%particulate matter PM2.5
Fort McMurray 8 (Good)
Pleasure of spending time in the city
Fort McMurray 61%
United States: 75% The Bahamas: 53% Venezuela: 41% Iceland: 89%particulate matter PM10
Fort McMurray 15 (Good)
Air Pollution
Fort McMurray 34%
United States: 29% The Bahamas: 52% Venezuela: 59% Iceland: 13%Garbage Disposal
Fort McMurray 70%
United States: 71% The Bahamas: 29% Venezuela: 18% Iceland: 79%Availability and quality of drinking water
Fort McMurray 62%
United States: 71% The Bahamas: 55% Venezuela: 28% Iceland: 96%Cleanliness and tidiness
Fort McMurray 46%
United States: 60% The Bahamas: 35% Venezuela: 22% Iceland: 75%Noise and Light pollution
Fort McMurray 34%
United States: 47% The Bahamas: 39% Venezuela: 47% Iceland: 23%Water Pollution
Fort McMurray 49%
United States: 44% The Bahamas: 58% Venezuela: 76% Iceland: 8.4%O3 0.03 (Good)
ozone (O3)PM2,5 3.5 (Good)
particulate matter (PM2.5) dustPM2,5 1.5 (Good)
particulate matter (PM2.5) dustO3 0.04 (Good)
ozone (O3)Athabasca Valley
| index | 2024-04-16 | 2024-04-15 | 2024-04-14 | 2024-04-13 | 2024-04-12 | 2024-04-11 | 2024-04-10 | 2024-04-09 |
|---|---|---|---|---|---|---|---|---|
| o3 | 0.03 | 0.03 | 0.04 | 0.04 | 0.04 | 0.03 | 0.04 | 0.03 |
| pm25 | 4.2 | 6.2 | 3.1 | 2.2 | 2.6 | 2.9 | 1.7 | 4.3 |
Patricia McInnes
| index | 2024-04-16 | 2024-04-15 | 2024-04-14 | 2024-04-13 | 2024-04-12 | 2024-04-11 | 2024-04-10 | 2024-04-09 |
|---|---|---|---|---|---|---|---|---|
| o3 | 0.03 | 0.03 | 0.04 | 0.04 | 0.04 | 0.03 | 0.04 | 0.04 |
| pm25 | 3.3 | 5.5 | 1.7 | 2.5 | 2.3 | 3 | 1.4 | 3.8 |
Athabasca Valley
| index | 2020-05 | 2020-04 | 2020-03 | 2020-02 | 2020-01 | 2019-12 | 2019-11 | 2019-10 | 2019-09 | 2019-08 | 2019-07 | 2019-06 | 2019-05 | 2019-04 | 2019-03 | 2019-02 | 2019-01 | 2018-12 | 2018-11 | 2018-10 | 2018-09 | 2018-08 | 2018-07 | 2018-06 | 2018-05 | 2018-04 | 2018-03 | 2018-02 | 2018-01 | 2017-12 | 2017-11 | 2017-10 | 2017-09 | 2017-08 | 2017-07 | 2017-06 | 2017-05 | 2017-04 | 2016-09 | 2016-08 | 2016-04 | 2016-03 |
|---|---|---|---|---|---|---|---|---|---|---|---|---|---|---|---|---|---|---|---|---|---|---|---|---|---|---|---|---|---|---|---|---|---|---|---|---|---|---|---|---|---|---|
| o3:ppm | 0.03 | 0.03 | 0.03 | 0.02 | 0.02 | 0.01 | 0.02 | 0.02 | 0.02 | 0.02 | 0.02 | 0.03 | 0.03 | 0.03 | 0.03 | 0.02 | 0.02 | 0.01 | 0.02 | 0.02 | 0.02 | 0.02 | 0.02 | 0.03 | 0.03 | 0.03 | 0.03 | 0.03 | 0.02 | 0.02 | 0.02 | 0.02 | 0.02 | 0.03 | 0.03 | 0.03 | 0.03 | 0.03 | 0.01 | 0.02 | 0.03 | 0.02 |
| pm25 | 4.5 | 4.3 | 4.9 | 5 | 4.8 | 5.9 | 4.5 | 4.1 | 3.9 | 4.7 | 7.4 | 8.1 | 9.9 | 4.4 | 5.9 | 5.6 | 4.9 | 6.3 | 7 | 5 | 4.9 | 21 | 7.2 | 5 | 7.4 | 6 | 5.6 | 5.1 | 7.2 | 6 | 6.5 | 4.6 | 7.3 | 8.2 | 7.5 | 6 | 5 | 4.9 | 4.2 | 6.4 | 3.9 | 4.5 |
Patricia McInnes

| index | 2020-05 | 2020-04 | 2020-03 | 2020-02 | 2020-01 | 2019-12 | 2019-11 | 2019-10 | 2019-09 | 2019-08 | 2019-07 | 2019-06 | 2019-05 | 2019-04 | 2019-03 | 2019-02 | 2019-01 | 2018-12 | 2018-11 | 2018-10 | 2018-09 | 2018-08 | 2018-07 | 2018-06 | 2018-05 | 2018-04 | 2018-03 | 2018-02 | 2018-01 | 2017-12 | 2017-11 | 2017-10 | 2017-09 | 2017-08 | 2017-07 | 2017-06 | 2017-05 | 2017-04 | 2016-09 | 2016-08 | 2016-04 | 2016-03 |
|---|---|---|---|---|---|---|---|---|---|---|---|---|---|---|---|---|---|---|---|---|---|---|---|---|---|---|---|---|---|---|---|---|---|---|---|---|---|---|---|---|---|---|
| pm25 | 4.4 | 4.9 | 6 | 4.8 | 5.8 | 7.7 | 4.7 | 3.7 | 4.3 | 5.5 | 9.4 | 9.8 | 12 | 3.9 | 4.8 | 5.2 | 4.7 | 6.3 | 6 | 4.2 | 4.1 | 21 | 7.7 | 6 | 11 | 5 | 4 | 3.3 | 6.3 | 3.5 | 4.2 | 3.1 | 6.3 | 10 | 6.4 | 6.1 | 4.6 | 3.9 | 2.8 | 4.3 | 3.4 | 5.1 |
| o3:ppm | 0.03 | 0.04 | 0.03 | 0.03 | 0.02 | 0.02 | 0.02 | 0.02 | 0.02 | 0.02 | 0.03 | 0.03 | 0.03 | 0.03 | 0.03 | 0.02 | 0.02 | 0.02 | 0.02 | 0.02 | 0.02 | 0.02 | 0.03 | 0.03 | 0.04 | 0.04 | 0.04 | 0.03 | 0.02 | 0.03 | 0.03 | 0.02 | 0.03 | 0.03 | 0.03 | 0.03 | 0.03 | 0.03 | 0.01 | 0.02 | 0.04 | 0.03 |