Air Pollution in Kamloops: Real-time Air Quality Index and smog alert.
Pollution and air quality forecast for Kamloops. Today is Thursday, June 18, 2026. The following air pollution values have been recorded for Kamloops:- sulfur dioxide (SO2) - 0 (Good)
- particulate matter (PM2.5) dust - 1 (Good)
- ozone (O3) - 0 (Good)
- nitrogen dioxide (NO2) - 0 (Good)

What is the air quality in Kamloops today? Is the air polluted in Kamloops?. Is there smog?
What is the level of SO2 pollution? (sulfur dioxide (SO2))
0 (Good)
What is the current level of PM2.5 in Kamloops? (particulate matter (PM2.5) dust)
Today's PM2.5 level is:
1 (Good)
For comparison, the highest level of PM2.5 in Kamloops in the last 7 days was: 7 (Sunday, April 14, 2024) and the lowest: 3 (Tuesday, April 9, 2024).
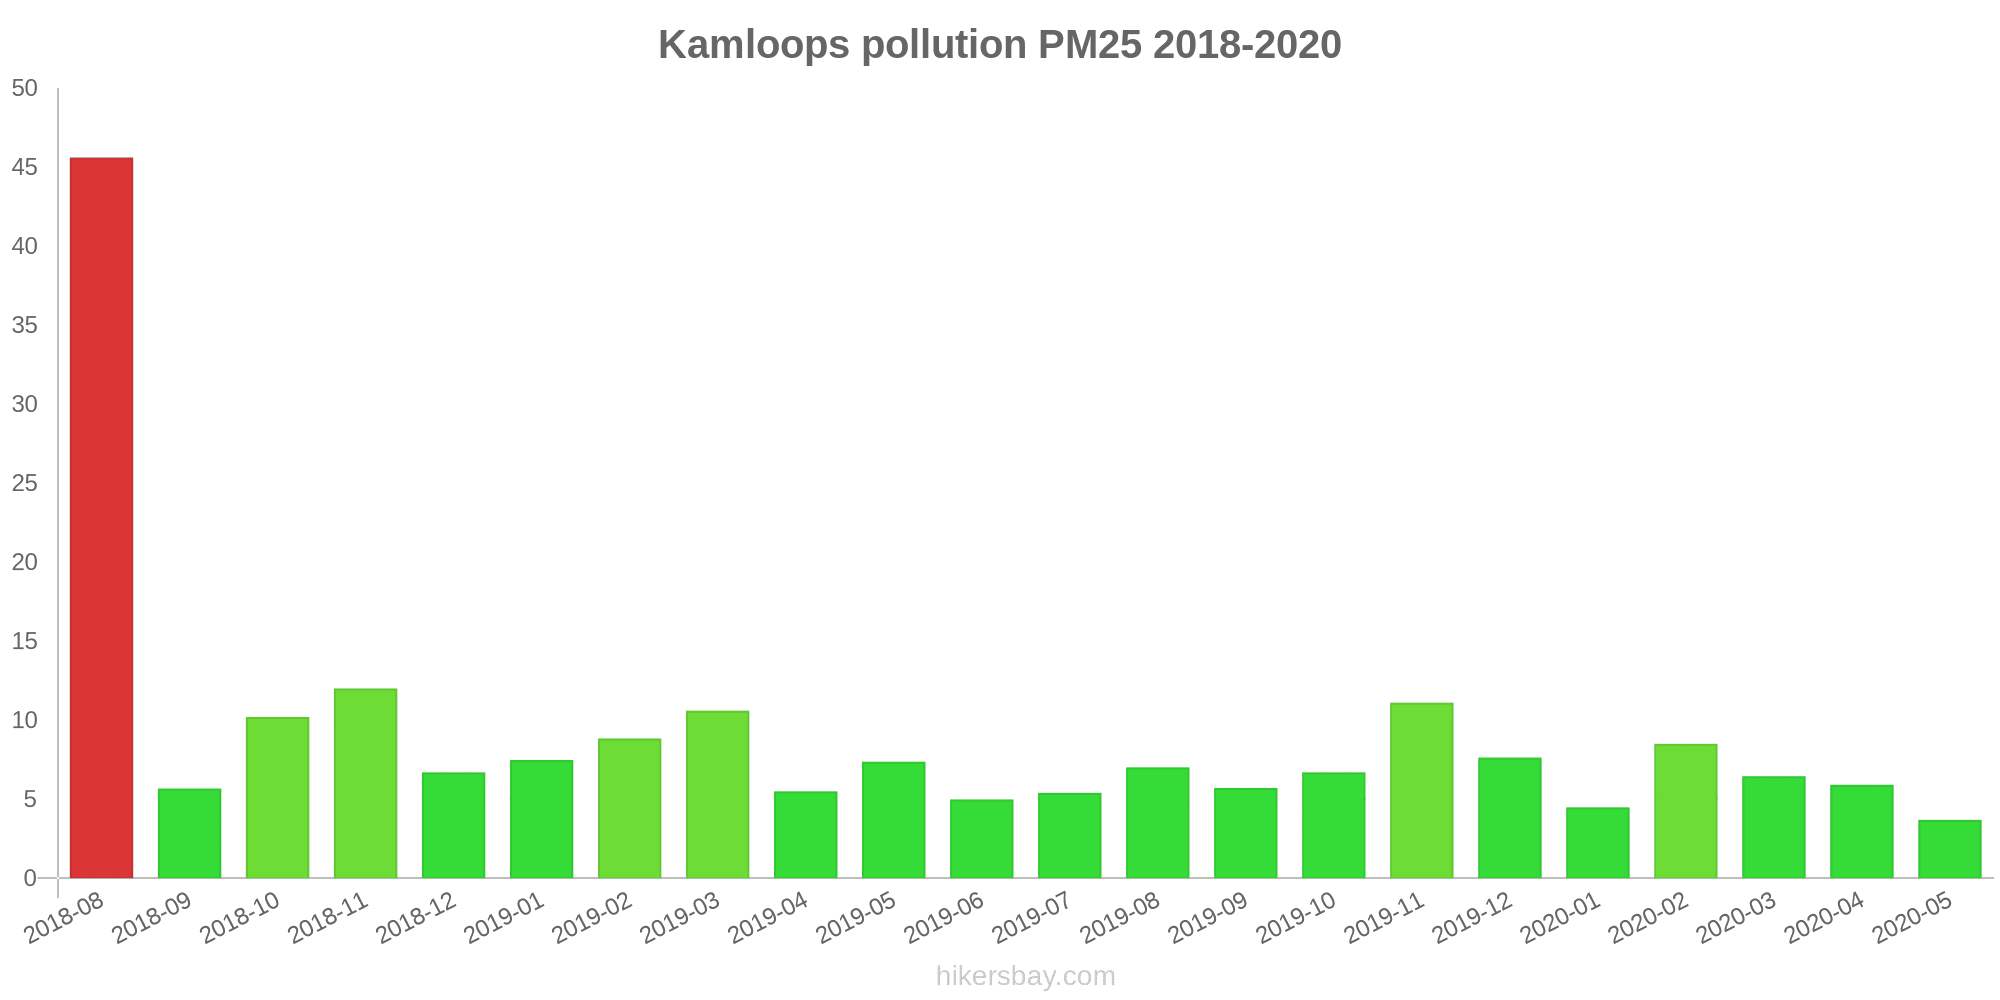
The highest PM2.5 values were recorded: 46 (August 2018).
The lowest level of particulate matter PM2.5 pollution occurs in month: May (3.7).
How is the O3 level today in Kamloops? (ozone (O3))
0 (Good)
How high is the level of NO2? (nitrogen dioxide (NO2))
0 (Good)
Current data Tuesday, April 16, 2024, 10:00 AM
SO2 0 (Good)
PM2,5 1 (Good)
O3 0 (Good)
0 (Good)
NO2 0 (Good)
Data on air pollution from recent days in Kamloops
index
2024-04-09
2024-04-10
2024-04-11
2024-04-12
2024-04-13
2024-04-14
2024-04-15
2024-04-16
no2
0
Good
0
Good
0
Good
0
Good
0
Good
0
Good
0
Good
0
Good
o3
0
Good
0
Good
0
Good
0
Good
0
Good
0
Good
0
Good
0
Good
pm25
3
Good
4
Good
4
Good
5
Good
4
Good
7
Good
6
Good
3
Good
no
0
Good
0
Good
0
Good
0
Good
0
Good
0
Good
0
Good
0
Good
so2
0
Good
0
Good
0
Good
0
Good
0
Good
0
Good
0
Good
0
Good
data source »
Air pollution in Kamloops from August 2018 to May 2020

index
2020-05
2020-04
2020-03
2020-02
2020-01
2019-12
2019-11
2019-10
2019-09
2019-08
2019-07
2019-06
2019-05
2019-04
2019-03
2019-02
2019-01
2018-12
2018-11
2018-10
2018-09
2018-08
pm25
3.7 (Good)
5.9 (Good)
6.5 (Good)
8.5 (Good)
4.5 (Good)
7.6 (Good)
11 (Good)
6.7 (Good)
5.7 (Good)
7 (Good)
5.4 (Good)
5 (Good)
7.4 (Good)
5.5 (Good)
11 (Good)
8.8 (Good)
7.5 (Good)
6.7 (Good)
12 (Good)
10 (Good)
5.7 (Good)
46 (Unhealthy for Sensitive Groups)
data source »
Quality of life in Kamloops
Green and Parks in the City
Kamloops
75%
United States: 70%
Venezuela: 41%
Iceland: 72%
particulate matter PM2.5
Kamloops
8 (Good)
Pleasure of spending time in the city
Kamloops
75%
United States: 75%
The Bahamas: 53%
Venezuela: 41%
Iceland: 89%
particulate matter PM10
Kamloops
15 (Good)
Air Pollution
Kamloops
32%
United States: 29%
The Bahamas: 52%
Venezuela: 59%
Iceland: 13%
Garbage Disposal
Kamloops
75%
United States: 71%
The Bahamas: 29%
Venezuela: 18%
Iceland: 79%
Availability and quality of drinking water
Kamloops
80%
United States: 71%
The Bahamas: 55%
Venezuela: 28%
Iceland: 96%
Cleanliness and tidiness
Kamloops
68%
United States: 60%
The Bahamas: 35%
Venezuela: 22%
Iceland: 75%
Noise and Light pollution
Kamloops
32%
United States: 47%
The Bahamas: 39%
Venezuela: 47%
Iceland: 23%
Water Pollution
Kamloops
25%
United States: 44%
The Bahamas: 58%
Venezuela: 76%
Iceland: 8.4%
Source: Numbeo
Kamloops Federal Bui
Tuesday, April 16, 2024, 10:00 AM
SO2 0 (Good)
sulfur dioxide (SO2)
PM2,5 0.9 (Good)
particulate matter (PM2.5) dust
O3 0.03 (Good)
ozone (O3)
0 (Good)
index_name_no
NO2 0.01 (Good)
nitrogen dioxide (NO2)
Kamloops Federal Bui
index
2024-04-16
2024-04-15
2024-04-14
2024-04-13
2024-04-12
2024-04-11
2024-04-10
2024-04-09
no2
0
0.01
0.01
0.01
0.01
0.01
0.01
0.01
o3
0.04
0.04
0.03
0.03
0.03
0.03
0.02
0.03
pm25
2.6
6.1
6.6
4.1
5.3
4.4
4
3.2
no
0
0
0.01
0
0
0
0.01
0
so2
0
0
0
0
0
0
0
0
Kamloops Federal Bui
2018-08 2020-05
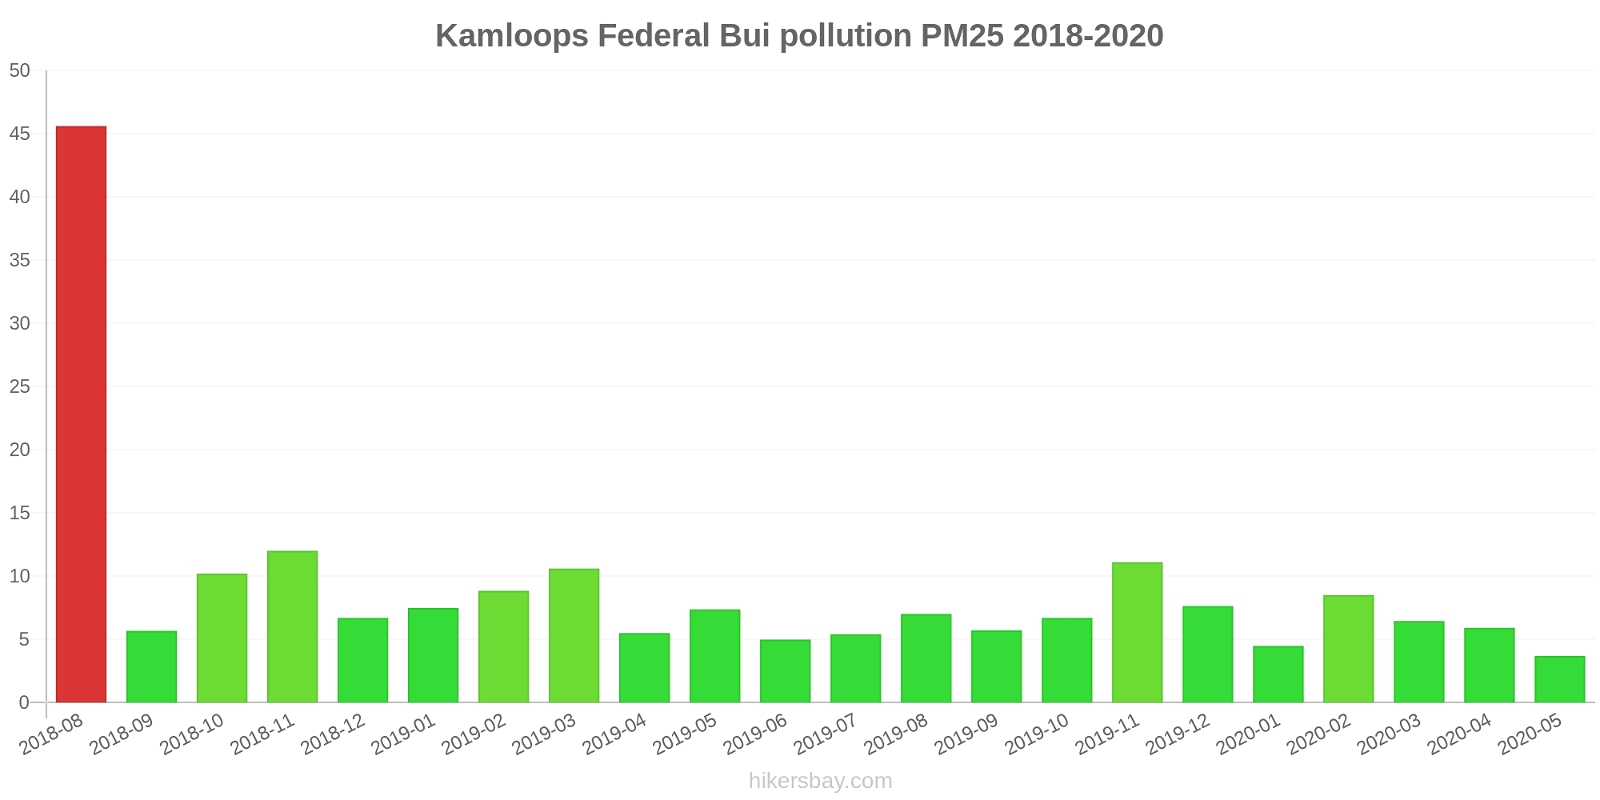
index
2020-05
2020-04
2020-03
2020-02
2020-01
2019-12
2019-11
2019-10
2019-09
2019-08
2019-07
2019-06
2019-05
2019-04
2019-03
2019-02
2019-01
2018-12
2018-11
2018-10
2018-09
2018-08
pm25
3.7
5.9
6.5
8.5
4.5
7.6
11
6.7
5.7
7
5.4
5
7.4
5.5
11
8.8
7.5
6.7
12
10
5.7
46
* Pollution data source:
https://openaq.org
(AirNow)
The data is licensed under CC-By 4.0
SO2 0 (Good)
PM2,5 1 (Good)
O3 0 (Good)
0 (Good)
NO2 0 (Good)
Data on air pollution from recent days in Kamloops
| index | 2024-04-09 | 2024-04-10 | 2024-04-11 | 2024-04-12 | 2024-04-13 | 2024-04-14 | 2024-04-15 | 2024-04-16 |
|---|---|---|---|---|---|---|---|---|
| no2 | 0 Good |
0 Good |
0 Good |
0 Good |
0 Good |
0 Good |
0 Good |
0 Good |
| o3 | 0 Good |
0 Good |
0 Good |
0 Good |
0 Good |
0 Good |
0 Good |
0 Good |
| pm25 | 3 Good |
4 Good |
4 Good |
5 Good |
4 Good |
7 Good |
6 Good |
3 Good |
| no | 0 Good |
0 Good |
0 Good |
0 Good |
0 Good |
0 Good |
0 Good |
0 Good |
| so2 | 0 Good |
0 Good |
0 Good |
0 Good |
0 Good |
0 Good |
0 Good |
0 Good |
| index | 2020-05 | 2020-04 | 2020-03 | 2020-02 | 2020-01 | 2019-12 | 2019-11 | 2019-10 | 2019-09 | 2019-08 | 2019-07 | 2019-06 | 2019-05 | 2019-04 | 2019-03 | 2019-02 | 2019-01 | 2018-12 | 2018-11 | 2018-10 | 2018-09 | 2018-08 |
|---|---|---|---|---|---|---|---|---|---|---|---|---|---|---|---|---|---|---|---|---|---|---|
| pm25 | 3.7 (Good) | 5.9 (Good) | 6.5 (Good) | 8.5 (Good) | 4.5 (Good) | 7.6 (Good) | 11 (Good) | 6.7 (Good) | 5.7 (Good) | 7 (Good) | 5.4 (Good) | 5 (Good) | 7.4 (Good) | 5.5 (Good) | 11 (Good) | 8.8 (Good) | 7.5 (Good) | 6.7 (Good) | 12 (Good) | 10 (Good) | 5.7 (Good) | 46 (Unhealthy for Sensitive Groups) |
Green and Parks in the City
Kamloops 75%
United States: 70% Venezuela: 41% Iceland: 72%particulate matter PM2.5
Kamloops 8 (Good)
Pleasure of spending time in the city
Kamloops 75%
United States: 75% The Bahamas: 53% Venezuela: 41% Iceland: 89%particulate matter PM10
Kamloops 15 (Good)
Air Pollution
Kamloops 32%
United States: 29% The Bahamas: 52% Venezuela: 59% Iceland: 13%Garbage Disposal
Kamloops 75%
United States: 71% The Bahamas: 29% Venezuela: 18% Iceland: 79%Availability and quality of drinking water
Kamloops 80%
United States: 71% The Bahamas: 55% Venezuela: 28% Iceland: 96%Cleanliness and tidiness
Kamloops 68%
United States: 60% The Bahamas: 35% Venezuela: 22% Iceland: 75%Noise and Light pollution
Kamloops 32%
United States: 47% The Bahamas: 39% Venezuela: 47% Iceland: 23%Water Pollution
Kamloops 25%
United States: 44% The Bahamas: 58% Venezuela: 76% Iceland: 8.4%SO2 0 (Good)
sulfur dioxide (SO2)PM2,5 0.9 (Good)
particulate matter (PM2.5) dustO3 0.03 (Good)
ozone (O3)0 (Good)
index_name_noNO2 0.01 (Good)
nitrogen dioxide (NO2)Kamloops Federal Bui
| index | 2024-04-16 | 2024-04-15 | 2024-04-14 | 2024-04-13 | 2024-04-12 | 2024-04-11 | 2024-04-10 | 2024-04-09 |
|---|---|---|---|---|---|---|---|---|
| no2 | 0 | 0.01 | 0.01 | 0.01 | 0.01 | 0.01 | 0.01 | 0.01 |
| o3 | 0.04 | 0.04 | 0.03 | 0.03 | 0.03 | 0.03 | 0.02 | 0.03 |
| pm25 | 2.6 | 6.1 | 6.6 | 4.1 | 5.3 | 4.4 | 4 | 3.2 |
| no | 0 | 0 | 0.01 | 0 | 0 | 0 | 0.01 | 0 |
| so2 | 0 | 0 | 0 | 0 | 0 | 0 | 0 | 0 |
Kamloops Federal Bui

| index | 2020-05 | 2020-04 | 2020-03 | 2020-02 | 2020-01 | 2019-12 | 2019-11 | 2019-10 | 2019-09 | 2019-08 | 2019-07 | 2019-06 | 2019-05 | 2019-04 | 2019-03 | 2019-02 | 2019-01 | 2018-12 | 2018-11 | 2018-10 | 2018-09 | 2018-08 |
|---|---|---|---|---|---|---|---|---|---|---|---|---|---|---|---|---|---|---|---|---|---|---|
| pm25 | 3.7 | 5.9 | 6.5 | 8.5 | 4.5 | 7.6 | 11 | 6.7 | 5.7 | 7 | 5.4 | 5 | 7.4 | 5.5 | 11 | 8.8 | 7.5 | 6.7 | 12 | 10 | 5.7 | 46 |