Air Pollution in Burnaby: Real-time Air Quality Index and smog alert.
Pollution and air quality forecast for Burnaby. Today is Thursday, June 18, 2026. The following air pollution values have been recorded for Burnaby:- particulate matter (PM2.5) dust - 2 (Good)
- carbon monoxide (CO) - 0 (Good)
- sulfur dioxide (SO2) - 0 (Good)
- ozone (O3) - 0 (Good)
- nitrogen dioxide (NO2) - 0 (Good)
- particulate matter (PM10) suspended dust - 6 (Good)

What is the air quality in Burnaby today? Is the air polluted in Burnaby?. Is there smog?
What is the current level of PM2.5 in Burnaby? (particulate matter (PM2.5) dust)
Today's PM2.5 level is:
2 (Good)
For comparison, the highest level of PM2.5 in Burnaby in the last 7 days was: 5 (Thursday, April 11, 2024) and the lowest: 2 (Tuesday, April 9, 2024).
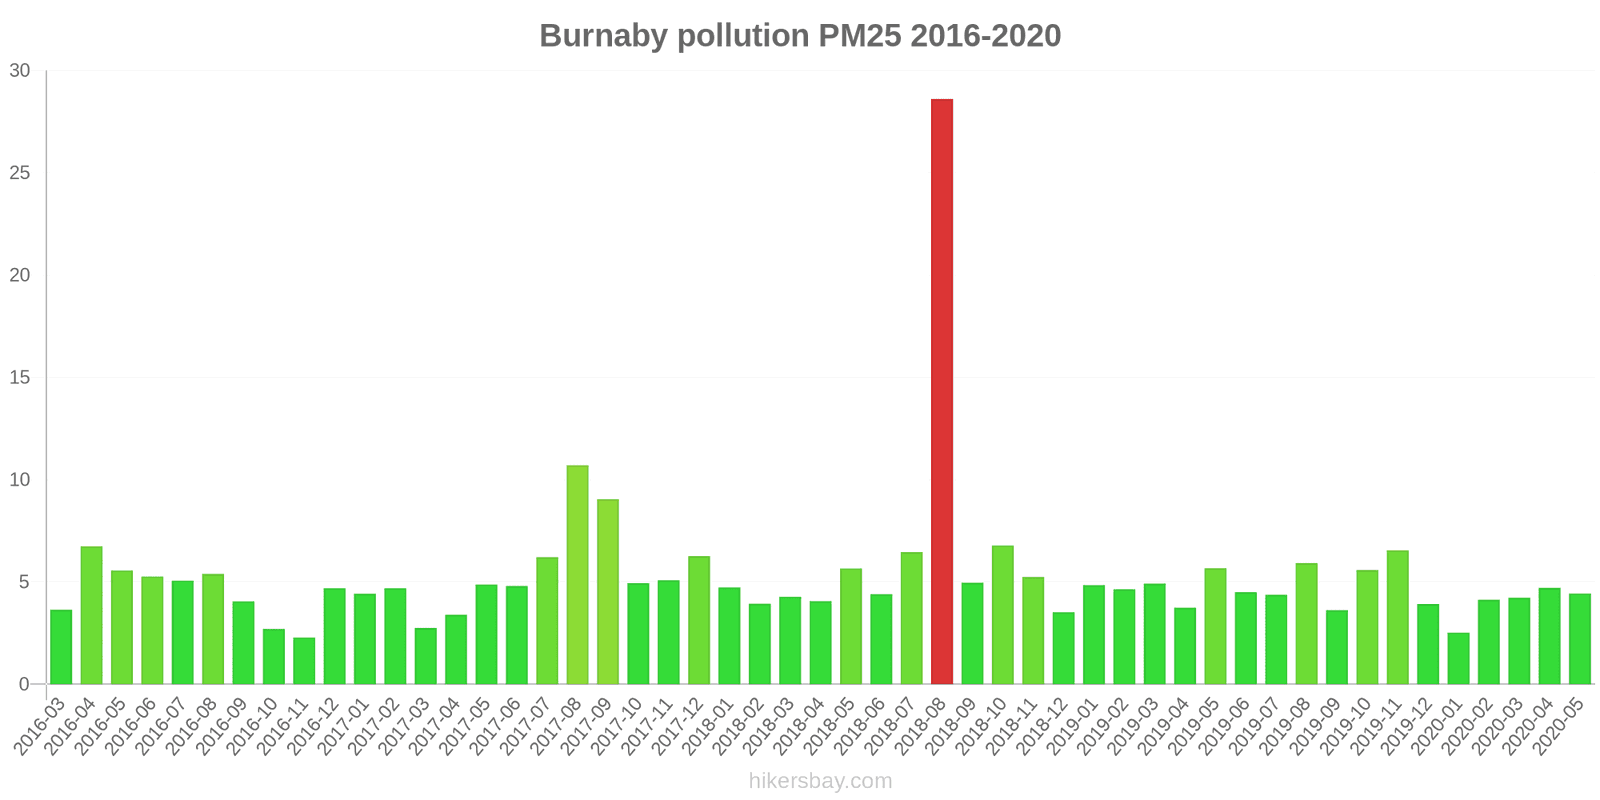
The highest PM2.5 values were recorded: 29 (August 2018).
The lowest level of particulate matter PM2.5 pollution occurs in month: November (2.3).
How high is the CO level? (carbon monoxide (CO))
0 (Good)
What is the level of SO2 pollution? (sulfur dioxide (SO2))
0 (Good)
How is the O3 level today in Burnaby? (ozone (O3))
0 (Good)
How high is the level of NO2? (nitrogen dioxide (NO2))
0 (Good)
What is the level of PM10 today in Burnaby? (particulate matter (PM10) suspended dust)
The current level of particulate matter PM10 in Burnaby is:
6 (Good)
Current data Tuesday, April 16, 2024, 10:00 AM
PM2,5 2 (Good)
CO 0 (Good)
SO2 0 (Good)
O3 0 (Good)
NO2 0 (Good)
0 (Good)
PM10 6 (Good)
Data on air pollution from recent days in Burnaby
index
2024-04-09
2024-04-10
2024-04-11
2024-04-12
2024-04-13
2024-04-14
2024-04-15
2024-04-16
so2
0
Good
0
Good
0
Good
0
Good
0
Good
0
Good
0
Good
0
Good
o3
0
Good
0
Good
0
Good
0
Good
0
Good
0
Good
0
Good
0
Good
co
0
Good
0
Good
0
Good
0
Good
0
Good
0
Good
0
Good
0
Good
no
0
Good
0
Good
0
Good
0
Good
0
Good
0
Good
0
Good
0
Good
no2
0
Good
0
Good
0
Good
0
Good
0
Good
0
Good
0
Good
0
Good
pm25
2
Good
3
Good
5
Good
4
Good
4
Good
4
Good
3
Good
2
Good
pm10
5
Good
6
Good
7
Good
5
Good
7
Good
9
Good
8
Good
7
Good
data source »
Air pollution in Burnaby from March 2016 to May 2020
index
2020-05
2020-04
2020-03
2020-02
2020-01
2019-12
2019-11
2019-10
2019-09
2019-08
2019-07
2019-06
2019-05
2019-04
2019-03
2019-02
2019-01
2018-12
2018-11
2018-10
2018-09
2018-08
2018-07
2018-06
2018-05
2018-04
2018-03
2018-02
2018-01
2017-12
2017-11
2017-10
2017-09
2017-08
2017-07
2017-06
2017-05
2017-04
2017-03
2017-02
2017-01
2016-12
2016-11
2016-10
2016-09
2016-08
2016-07
2016-06
2016-05
2016-04
2016-03
o3:ppm
0.03 (Good)
0.03 (Good)
0.02 (Good)
0.01 (Good)
0.02 (Good)
0.01 (Good)
0.01 (Good)
0.01 (Good)
0.01 (Good)
0.02 (Good)
0.02 (Good)
0.02 (Good)
0.02 (Good)
0.03 (Good)
0.02 (Good)
0.02 (Good)
0.01 (Good)
0.02 (Good)
0.02 (Good)
0.01 (Good)
0.01 (Good)
0.02 (Good)
0.02 (Good)
0.02 (Good)
0.03 (Good)
0.03 (Good)
0.02 (Good)
0.02 (Good)
0.02 (Good)
0.01 (Good)
0.02 (Good)
0.01 (Good)
0.02 (Good)
0.02 (Good)
0.02 (Good)
0.02 (Good)
0.03 (Good)
0.03 (Good)
0.03 (Good)
0.02 (Good)
0.02 (Good)
0.01 (Good)
0.02 (Good)
0.02 (Good)
0.01 (Good)
0.02 (Good)
0.02 (Good)
0.02 (Good)
0.03 (Good)
0.02 (Good)
0.02 (Good)
pm25
4.4 (Good)
4.7 (Good)
4.2 (Good)
4.1 (Good)
2.5 (Good)
3.9 (Good)
6.5 (Good)
5.6 (Good)
3.6 (Good)
5.9 (Good)
4.4 (Good)
4.5 (Good)
5.7 (Good)
3.7 (Good)
4.9 (Good)
4.6 (Good)
4.8 (Good)
3.5 (Good)
5.2 (Good)
6.8 (Good)
5 (Good)
29 (Moderate)
6.5 (Good)
4.4 (Good)
5.7 (Good)
4.1 (Good)
4.3 (Good)
3.9 (Good)
4.7 (Good)
6.3 (Good)
5.1 (Good)
4.9 (Good)
9 (Good)
11 (Good)
6.2 (Good)
4.8 (Good)
4.9 (Good)
3.4 (Good)
2.8 (Good)
4.7 (Good)
4.4 (Good)
4.7 (Good)
2.3 (Good)
2.7 (Good)
4 (Good)
5.4 (Good)
5.1 (Good)
5.3 (Good)
5.6 (Good)
6.7 (Good)
3.6 (Good)
data source »
Quality of life in Burnaby
Green and Parks in the City
Burnaby
73%
United States: 70%
Venezuela: 41%
Iceland: 72%
particulate matter PM2.5
Burnaby
7 (Good)
Pleasure of spending time in the city
Burnaby
76%
United States: 75%
The Bahamas: 53%
Venezuela: 41%
Iceland: 89%
particulate matter PM10
Burnaby
9 (Good)
Air Pollution
Burnaby
25%
United States: 29%
The Bahamas: 52%
Venezuela: 59%
Iceland: 13%
Garbage Disposal
Burnaby
86%
United States: 71%
The Bahamas: 29%
Venezuela: 18%
Iceland: 79%
Availability and quality of drinking water
Burnaby
84%
United States: 71%
The Bahamas: 55%
Venezuela: 28%
Iceland: 96%
Cleanliness and tidiness
Burnaby
72%
United States: 60%
The Bahamas: 35%
Venezuela: 22%
Iceland: 75%
Noise and Light pollution
Burnaby
57%
United States: 47%
The Bahamas: 39%
Venezuela: 47%
Iceland: 23%
Water Pollution
Burnaby
44%
United States: 44%
The Bahamas: 58%
Venezuela: 76%
Iceland: 8.4%
Source: Numbeo
Burnaby South
Tuesday, April 16, 2024, 10:00 AM
PM2,5 2.1 (Good)
particulate matter (PM2.5) dust
CO 0.2 (Good)
carbon monoxide (CO)
SO2 0 (Good)
sulfur dioxide (SO2)
O3 0.04 (Good)
ozone (O3)
NO2 0 (Good)
nitrogen dioxide (NO2)
0 (Good)
index_name_no
Kensington Park
Tuesday, April 16, 2024, 10:00 AM
SO2 0 (Good)
sulfur dioxide (SO2)
PM10 6 (Good)
particulate matter (PM10) suspended dust
NO2 0.01 (Good)
nitrogen dioxide (NO2)
O3 0.03 (Good)
ozone (O3)
PM2,5 1.6 (Good)
particulate matter (PM2.5) dust
0 (Good)
index_name_no
Burnaby South
index
2024-04-16
2024-04-15
2024-04-14
2024-04-13
2024-04-12
2024-04-11
2024-04-10
2024-04-09
so2
0
0
0
0
0
0
0
0
o3
0.04
0.04
0.02
0.02
0.03
0.03
0.03
0.03
co
0.2
0.2
0.24
0.23
0.2
0.2
0.2
0.21
no
0
0
0
0
0
0
0
0
no2
0
0.01
0.01
0.01
0.01
0.01
0.01
0.01
pm25
1.7
3.7
4.3
2.6
4
4.7
2.9
1.6
Kensington Park
index
2024-04-16
2024-04-15
2024-04-14
2024-04-13
2024-04-12
2024-04-11
2024-04-10
2024-04-09
so2
0
0
0
0
0
0
0
0
pm10
6.5
8
9.3
7.2
5.3
6.6
6.3
5.4
o3
0.04
0.03
0.02
0.02
0.03
0.02
0.02
0.03
no2
0.01
0.01
0.01
0.01
0.01
0.01
0.01
0.01
no
0
0
0
0
0
0
0
0
pm25
1.9
2.4
4.5
5.4
3.7
4.6
3.5
2.1
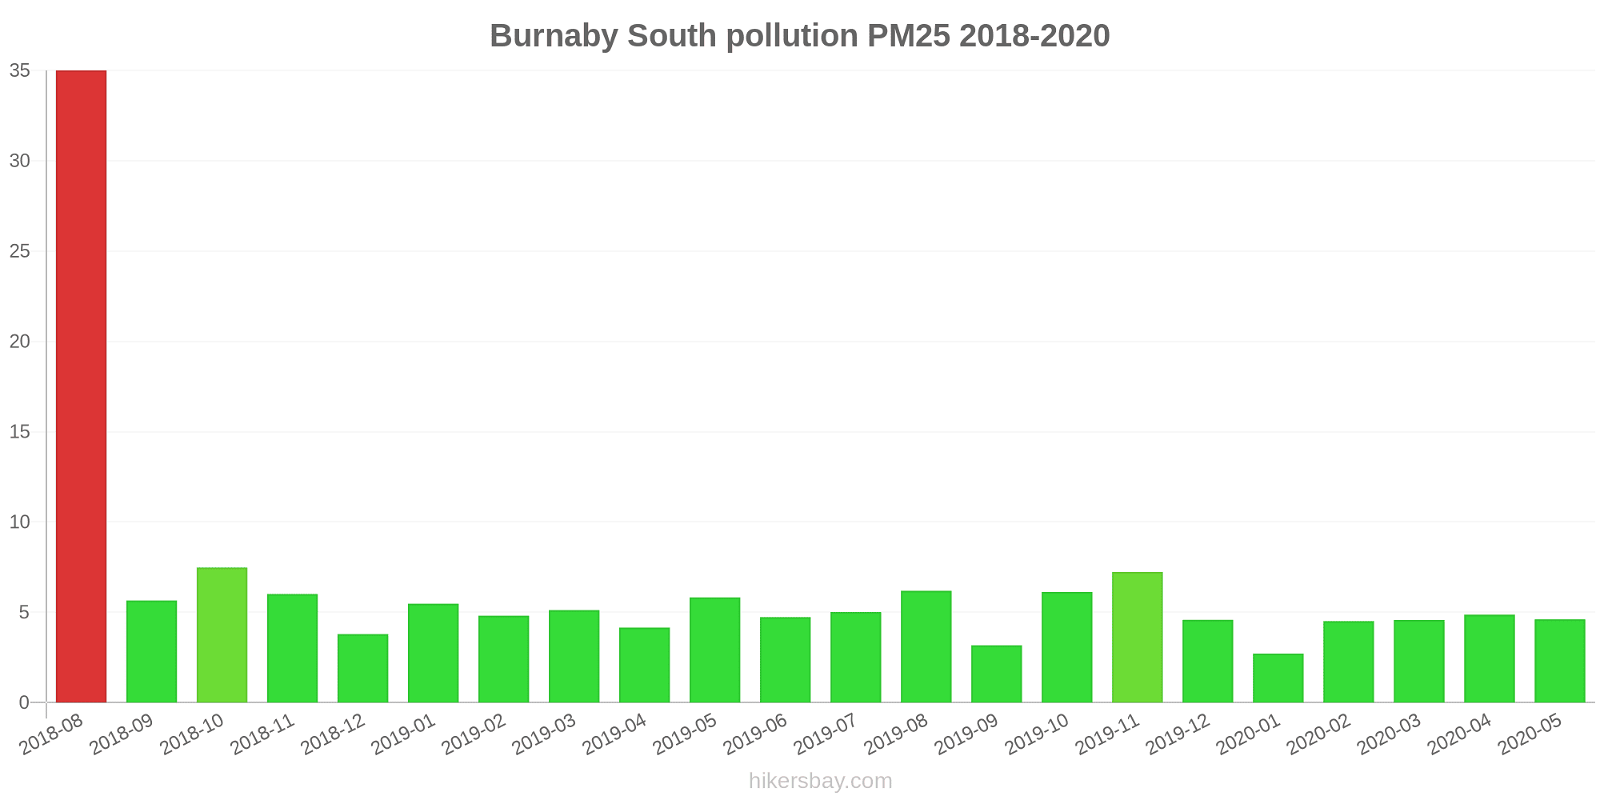
Burnaby South
2016-03 2020-05
index
2020-05
2020-04
2020-03
2020-02
2020-01
2019-12
2019-11
2019-10
2019-09
2019-08
2019-07
2019-06
2019-05
2019-04
2019-03
2019-02
2019-01
2018-12
2018-11
2018-10
2018-09
2018-08
2018-07
2018-06
2018-05
2018-04
2018-03
2018-02
2018-01
2017-12
2017-11
2017-10
2017-09
2017-08
2017-07
2017-06
2017-05
2017-04
2017-03
2017-02
2017-01
2016-12
2016-11
2016-10
2016-09
2016-08
2016-07
2016-06
2016-05
2016-04
2016-03
o3:ppm
0.03
0.03
0.02
0.01
0.02
0.01
0.01
0.01
0.02
0.02
0.02
0.02
0.02
0.03
0.02
0.02
0.01
0.02
0.02
0.01
0.01
0.02
0.02
0.02
0.03
0.03
0.02
0.02
0.01
0.01
0.02
0.02
0.02
0.02
0.03
0.03
0.03
0.03
0.03
0.02
0.01
0.01
0.02
0.02
0.01
0.02
0.02
0.02
0.03
0.02
0.02
pm25
4.6
4.9
4.6
4.5
2.7
4.6
7.2
6.1
3.2
6.2
5
4.7
5.8
4.2
5.1
4.8
5.5
3.8
6
7.5
5.7
35
-
-
-
-
-
-
-
-
-
-
-
-
-
-
-
-
-
-
-
-
-
-
-
-
-
-
-
-
-
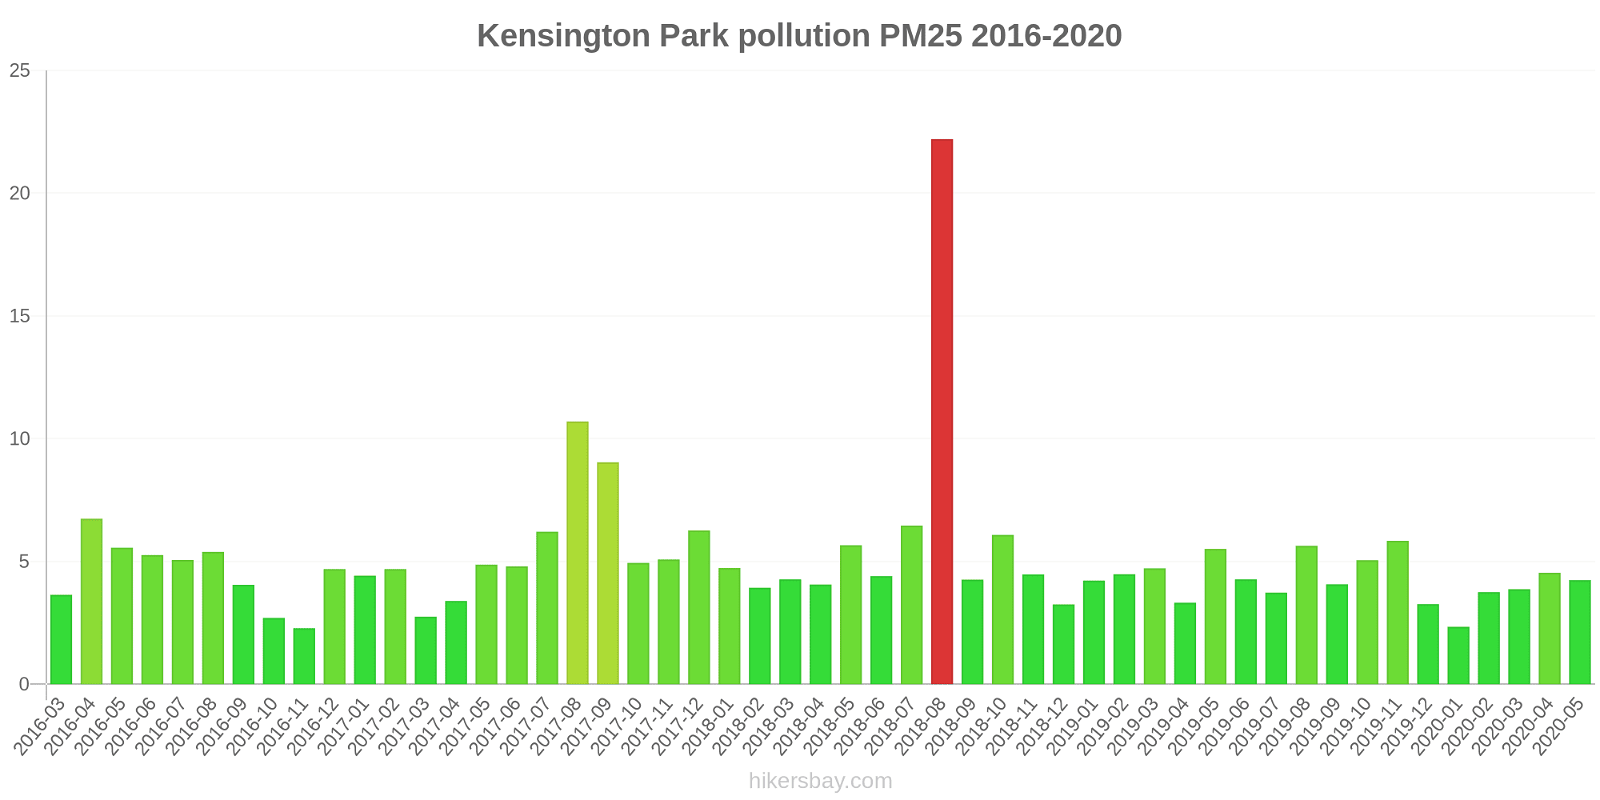
Kensington Park
2016-03 2020-05
index
2020-05
2020-04
2020-03
2020-02
2020-01
2019-12
2019-11
2019-10
2019-09
2019-08
2019-07
2019-06
2019-05
2019-04
2019-03
2019-02
2019-01
2018-12
2018-11
2018-10
2018-09
2018-08
2018-07
2018-06
2018-05
2018-04
2018-03
2018-02
2018-01
2017-12
2017-11
2017-10
2017-09
2017-08
2017-07
2017-06
2017-05
2017-04
2017-03
2017-02
2017-01
2016-12
2016-11
2016-10
2016-09
2016-08
2016-07
2016-06
2016-05
2016-04
2016-03
pm25
4.2
4.5
3.9
3.8
2.3
3.3
5.8
5
4.1
5.6
3.7
4.3
5.5
3.3
4.7
4.5
4.2
3.3
4.5
6.1
4.3
22
6.5
4.4
5.7
4.1
4.3
3.9
4.7
6.3
5.1
4.9
9
11
6.2
4.8
4.9
3.4
2.8
4.7
4.4
4.7
2.3
2.7
4
5.4
5.1
5.3
5.6
6.7
3.6
o3:ppm
0.03
0.03
0.02
0.01
0.02
0.01
0.01
0.01
0.01
0.02
0.02
0.02
0.02
0.03
0.03
0.02
0.01
0.02
0.02
0.01
0.01
0.02
0.02
0.02
0.03
0.03
0.02
0.02
0.02
0.01
0.02
0.01
0.02
0.02
0.02
0.02
0.02
0.03
0.03
0.02
0.02
0.01
0.02
0.02
0.01
0.02
0.02
0.02
0.03
0.03
0.02
* Pollution data source:
https://openaq.org
(AirNow)
The data is licensed under CC-By 4.0
PM2,5 2 (Good)
CO 0 (Good)
SO2 0 (Good)
O3 0 (Good)
NO2 0 (Good)
0 (Good)
PM10 6 (Good)
Data on air pollution from recent days in Burnaby
| index | 2024-04-09 | 2024-04-10 | 2024-04-11 | 2024-04-12 | 2024-04-13 | 2024-04-14 | 2024-04-15 | 2024-04-16 |
|---|---|---|---|---|---|---|---|---|
| so2 | 0 Good |
0 Good |
0 Good |
0 Good |
0 Good |
0 Good |
0 Good |
0 Good |
| o3 | 0 Good |
0 Good |
0 Good |
0 Good |
0 Good |
0 Good |
0 Good |
0 Good |
| co | 0 Good |
0 Good |
0 Good |
0 Good |
0 Good |
0 Good |
0 Good |
0 Good |
| no | 0 Good |
0 Good |
0 Good |
0 Good |
0 Good |
0 Good |
0 Good |
0 Good |
| no2 | 0 Good |
0 Good |
0 Good |
0 Good |
0 Good |
0 Good |
0 Good |
0 Good |
| pm25 | 2 Good |
3 Good |
5 Good |
4 Good |
4 Good |
4 Good |
3 Good |
2 Good |
| pm10 | 5 Good |
6 Good |
7 Good |
5 Good |
7 Good |
9 Good |
8 Good |
7 Good |

| index | 2020-05 | 2020-04 | 2020-03 | 2020-02 | 2020-01 | 2019-12 | 2019-11 | 2019-10 | 2019-09 | 2019-08 | 2019-07 | 2019-06 | 2019-05 | 2019-04 | 2019-03 | 2019-02 | 2019-01 | 2018-12 | 2018-11 | 2018-10 | 2018-09 | 2018-08 | 2018-07 | 2018-06 | 2018-05 | 2018-04 | 2018-03 | 2018-02 | 2018-01 | 2017-12 | 2017-11 | 2017-10 | 2017-09 | 2017-08 | 2017-07 | 2017-06 | 2017-05 | 2017-04 | 2017-03 | 2017-02 | 2017-01 | 2016-12 | 2016-11 | 2016-10 | 2016-09 | 2016-08 | 2016-07 | 2016-06 | 2016-05 | 2016-04 | 2016-03 |
|---|---|---|---|---|---|---|---|---|---|---|---|---|---|---|---|---|---|---|---|---|---|---|---|---|---|---|---|---|---|---|---|---|---|---|---|---|---|---|---|---|---|---|---|---|---|---|---|---|---|---|---|
| o3:ppm | 0.03 (Good) | 0.03 (Good) | 0.02 (Good) | 0.01 (Good) | 0.02 (Good) | 0.01 (Good) | 0.01 (Good) | 0.01 (Good) | 0.01 (Good) | 0.02 (Good) | 0.02 (Good) | 0.02 (Good) | 0.02 (Good) | 0.03 (Good) | 0.02 (Good) | 0.02 (Good) | 0.01 (Good) | 0.02 (Good) | 0.02 (Good) | 0.01 (Good) | 0.01 (Good) | 0.02 (Good) | 0.02 (Good) | 0.02 (Good) | 0.03 (Good) | 0.03 (Good) | 0.02 (Good) | 0.02 (Good) | 0.02 (Good) | 0.01 (Good) | 0.02 (Good) | 0.01 (Good) | 0.02 (Good) | 0.02 (Good) | 0.02 (Good) | 0.02 (Good) | 0.03 (Good) | 0.03 (Good) | 0.03 (Good) | 0.02 (Good) | 0.02 (Good) | 0.01 (Good) | 0.02 (Good) | 0.02 (Good) | 0.01 (Good) | 0.02 (Good) | 0.02 (Good) | 0.02 (Good) | 0.03 (Good) | 0.02 (Good) | 0.02 (Good) |
| pm25 | 4.4 (Good) | 4.7 (Good) | 4.2 (Good) | 4.1 (Good) | 2.5 (Good) | 3.9 (Good) | 6.5 (Good) | 5.6 (Good) | 3.6 (Good) | 5.9 (Good) | 4.4 (Good) | 4.5 (Good) | 5.7 (Good) | 3.7 (Good) | 4.9 (Good) | 4.6 (Good) | 4.8 (Good) | 3.5 (Good) | 5.2 (Good) | 6.8 (Good) | 5 (Good) | 29 (Moderate) | 6.5 (Good) | 4.4 (Good) | 5.7 (Good) | 4.1 (Good) | 4.3 (Good) | 3.9 (Good) | 4.7 (Good) | 6.3 (Good) | 5.1 (Good) | 4.9 (Good) | 9 (Good) | 11 (Good) | 6.2 (Good) | 4.8 (Good) | 4.9 (Good) | 3.4 (Good) | 2.8 (Good) | 4.7 (Good) | 4.4 (Good) | 4.7 (Good) | 2.3 (Good) | 2.7 (Good) | 4 (Good) | 5.4 (Good) | 5.1 (Good) | 5.3 (Good) | 5.6 (Good) | 6.7 (Good) | 3.6 (Good) |
Green and Parks in the City
Burnaby 73%
United States: 70% Venezuela: 41% Iceland: 72%particulate matter PM2.5
Burnaby 7 (Good)
Pleasure of spending time in the city
Burnaby 76%
United States: 75% The Bahamas: 53% Venezuela: 41% Iceland: 89%particulate matter PM10
Burnaby 9 (Good)
Air Pollution
Burnaby 25%
United States: 29% The Bahamas: 52% Venezuela: 59% Iceland: 13%Garbage Disposal
Burnaby 86%
United States: 71% The Bahamas: 29% Venezuela: 18% Iceland: 79%Availability and quality of drinking water
Burnaby 84%
United States: 71% The Bahamas: 55% Venezuela: 28% Iceland: 96%Cleanliness and tidiness
Burnaby 72%
United States: 60% The Bahamas: 35% Venezuela: 22% Iceland: 75%Noise and Light pollution
Burnaby 57%
United States: 47% The Bahamas: 39% Venezuela: 47% Iceland: 23%Water Pollution
Burnaby 44%
United States: 44% The Bahamas: 58% Venezuela: 76% Iceland: 8.4%PM2,5 2.1 (Good)
particulate matter (PM2.5) dustCO 0.2 (Good)
carbon monoxide (CO)SO2 0 (Good)
sulfur dioxide (SO2)O3 0.04 (Good)
ozone (O3)NO2 0 (Good)
nitrogen dioxide (NO2)0 (Good)
index_name_noSO2 0 (Good)
sulfur dioxide (SO2)PM10 6 (Good)
particulate matter (PM10) suspended dustNO2 0.01 (Good)
nitrogen dioxide (NO2)O3 0.03 (Good)
ozone (O3)PM2,5 1.6 (Good)
particulate matter (PM2.5) dust0 (Good)
index_name_noBurnaby South
| index | 2024-04-16 | 2024-04-15 | 2024-04-14 | 2024-04-13 | 2024-04-12 | 2024-04-11 | 2024-04-10 | 2024-04-09 |
|---|---|---|---|---|---|---|---|---|
| so2 | 0 | 0 | 0 | 0 | 0 | 0 | 0 | 0 |
| o3 | 0.04 | 0.04 | 0.02 | 0.02 | 0.03 | 0.03 | 0.03 | 0.03 |
| co | 0.2 | 0.2 | 0.24 | 0.23 | 0.2 | 0.2 | 0.2 | 0.21 |
| no | 0 | 0 | 0 | 0 | 0 | 0 | 0 | 0 |
| no2 | 0 | 0.01 | 0.01 | 0.01 | 0.01 | 0.01 | 0.01 | 0.01 |
| pm25 | 1.7 | 3.7 | 4.3 | 2.6 | 4 | 4.7 | 2.9 | 1.6 |
Kensington Park
| index | 2024-04-16 | 2024-04-15 | 2024-04-14 | 2024-04-13 | 2024-04-12 | 2024-04-11 | 2024-04-10 | 2024-04-09 |
|---|---|---|---|---|---|---|---|---|
| so2 | 0 | 0 | 0 | 0 | 0 | 0 | 0 | 0 |
| pm10 | 6.5 | 8 | 9.3 | 7.2 | 5.3 | 6.6 | 6.3 | 5.4 |
| o3 | 0.04 | 0.03 | 0.02 | 0.02 | 0.03 | 0.02 | 0.02 | 0.03 |
| no2 | 0.01 | 0.01 | 0.01 | 0.01 | 0.01 | 0.01 | 0.01 | 0.01 |
| no | 0 | 0 | 0 | 0 | 0 | 0 | 0 | 0 |
| pm25 | 1.9 | 2.4 | 4.5 | 5.4 | 3.7 | 4.6 | 3.5 | 2.1 |
Burnaby South

| index | 2020-05 | 2020-04 | 2020-03 | 2020-02 | 2020-01 | 2019-12 | 2019-11 | 2019-10 | 2019-09 | 2019-08 | 2019-07 | 2019-06 | 2019-05 | 2019-04 | 2019-03 | 2019-02 | 2019-01 | 2018-12 | 2018-11 | 2018-10 | 2018-09 | 2018-08 | 2018-07 | 2018-06 | 2018-05 | 2018-04 | 2018-03 | 2018-02 | 2018-01 | 2017-12 | 2017-11 | 2017-10 | 2017-09 | 2017-08 | 2017-07 | 2017-06 | 2017-05 | 2017-04 | 2017-03 | 2017-02 | 2017-01 | 2016-12 | 2016-11 | 2016-10 | 2016-09 | 2016-08 | 2016-07 | 2016-06 | 2016-05 | 2016-04 | 2016-03 |
|---|---|---|---|---|---|---|---|---|---|---|---|---|---|---|---|---|---|---|---|---|---|---|---|---|---|---|---|---|---|---|---|---|---|---|---|---|---|---|---|---|---|---|---|---|---|---|---|---|---|---|---|
| o3:ppm | 0.03 | 0.03 | 0.02 | 0.01 | 0.02 | 0.01 | 0.01 | 0.01 | 0.02 | 0.02 | 0.02 | 0.02 | 0.02 | 0.03 | 0.02 | 0.02 | 0.01 | 0.02 | 0.02 | 0.01 | 0.01 | 0.02 | 0.02 | 0.02 | 0.03 | 0.03 | 0.02 | 0.02 | 0.01 | 0.01 | 0.02 | 0.02 | 0.02 | 0.02 | 0.03 | 0.03 | 0.03 | 0.03 | 0.03 | 0.02 | 0.01 | 0.01 | 0.02 | 0.02 | 0.01 | 0.02 | 0.02 | 0.02 | 0.03 | 0.02 | 0.02 |
| pm25 | 4.6 | 4.9 | 4.6 | 4.5 | 2.7 | 4.6 | 7.2 | 6.1 | 3.2 | 6.2 | 5 | 4.7 | 5.8 | 4.2 | 5.1 | 4.8 | 5.5 | 3.8 | 6 | 7.5 | 5.7 | 35 | - | - | - | - | - | - | - | - | - | - | - | - | - | - | - | - | - | - | - | - | - | - | - | - | - | - | - | - | - |
Kensington Park

| index | 2020-05 | 2020-04 | 2020-03 | 2020-02 | 2020-01 | 2019-12 | 2019-11 | 2019-10 | 2019-09 | 2019-08 | 2019-07 | 2019-06 | 2019-05 | 2019-04 | 2019-03 | 2019-02 | 2019-01 | 2018-12 | 2018-11 | 2018-10 | 2018-09 | 2018-08 | 2018-07 | 2018-06 | 2018-05 | 2018-04 | 2018-03 | 2018-02 | 2018-01 | 2017-12 | 2017-11 | 2017-10 | 2017-09 | 2017-08 | 2017-07 | 2017-06 | 2017-05 | 2017-04 | 2017-03 | 2017-02 | 2017-01 | 2016-12 | 2016-11 | 2016-10 | 2016-09 | 2016-08 | 2016-07 | 2016-06 | 2016-05 | 2016-04 | 2016-03 |
|---|---|---|---|---|---|---|---|---|---|---|---|---|---|---|---|---|---|---|---|---|---|---|---|---|---|---|---|---|---|---|---|---|---|---|---|---|---|---|---|---|---|---|---|---|---|---|---|---|---|---|---|
| pm25 | 4.2 | 4.5 | 3.9 | 3.8 | 2.3 | 3.3 | 5.8 | 5 | 4.1 | 5.6 | 3.7 | 4.3 | 5.5 | 3.3 | 4.7 | 4.5 | 4.2 | 3.3 | 4.5 | 6.1 | 4.3 | 22 | 6.5 | 4.4 | 5.7 | 4.1 | 4.3 | 3.9 | 4.7 | 6.3 | 5.1 | 4.9 | 9 | 11 | 6.2 | 4.8 | 4.9 | 3.4 | 2.8 | 4.7 | 4.4 | 4.7 | 2.3 | 2.7 | 4 | 5.4 | 5.1 | 5.3 | 5.6 | 6.7 | 3.6 |
| o3:ppm | 0.03 | 0.03 | 0.02 | 0.01 | 0.02 | 0.01 | 0.01 | 0.01 | 0.01 | 0.02 | 0.02 | 0.02 | 0.02 | 0.03 | 0.03 | 0.02 | 0.01 | 0.02 | 0.02 | 0.01 | 0.01 | 0.02 | 0.02 | 0.02 | 0.03 | 0.03 | 0.02 | 0.02 | 0.02 | 0.01 | 0.02 | 0.01 | 0.02 | 0.02 | 0.02 | 0.02 | 0.02 | 0.03 | 0.03 | 0.02 | 0.02 | 0.01 | 0.02 | 0.02 | 0.01 | 0.02 | 0.02 | 0.02 | 0.03 | 0.03 | 0.02 |