Air Pollution in Arrondissement of Liège: Real-time Air Quality Index and smog alert.
Pollution and air quality forecast for Arrondissement of Liège. Today is Saturday, June 20, 2026. The following air pollution values have been recorded for Arrondissement of Liège:- particulate matter (PM10) suspended dust - 34 (Moderate)
- particulate matter (PM2.5) dust - 22 (Moderate)
- ozone (O3) - 8 (Good)
- nitrogen dioxide (NO2) - 52 (Moderate)
- carbon monoxide (CO) - 453 (Good)
- sulfur dioxide (SO2) - 1 (Good)

What is the air quality in Arrondissement of Liège today? Is the air polluted in Arrondissement of Liège?. Is there smog?
What is the level of PM10 today in Arrondissement of Liège? (particulate matter (PM10) suspended dust)
The current level of particulate matter PM10 in Arrondissement of Liège is:
34 (Moderate)
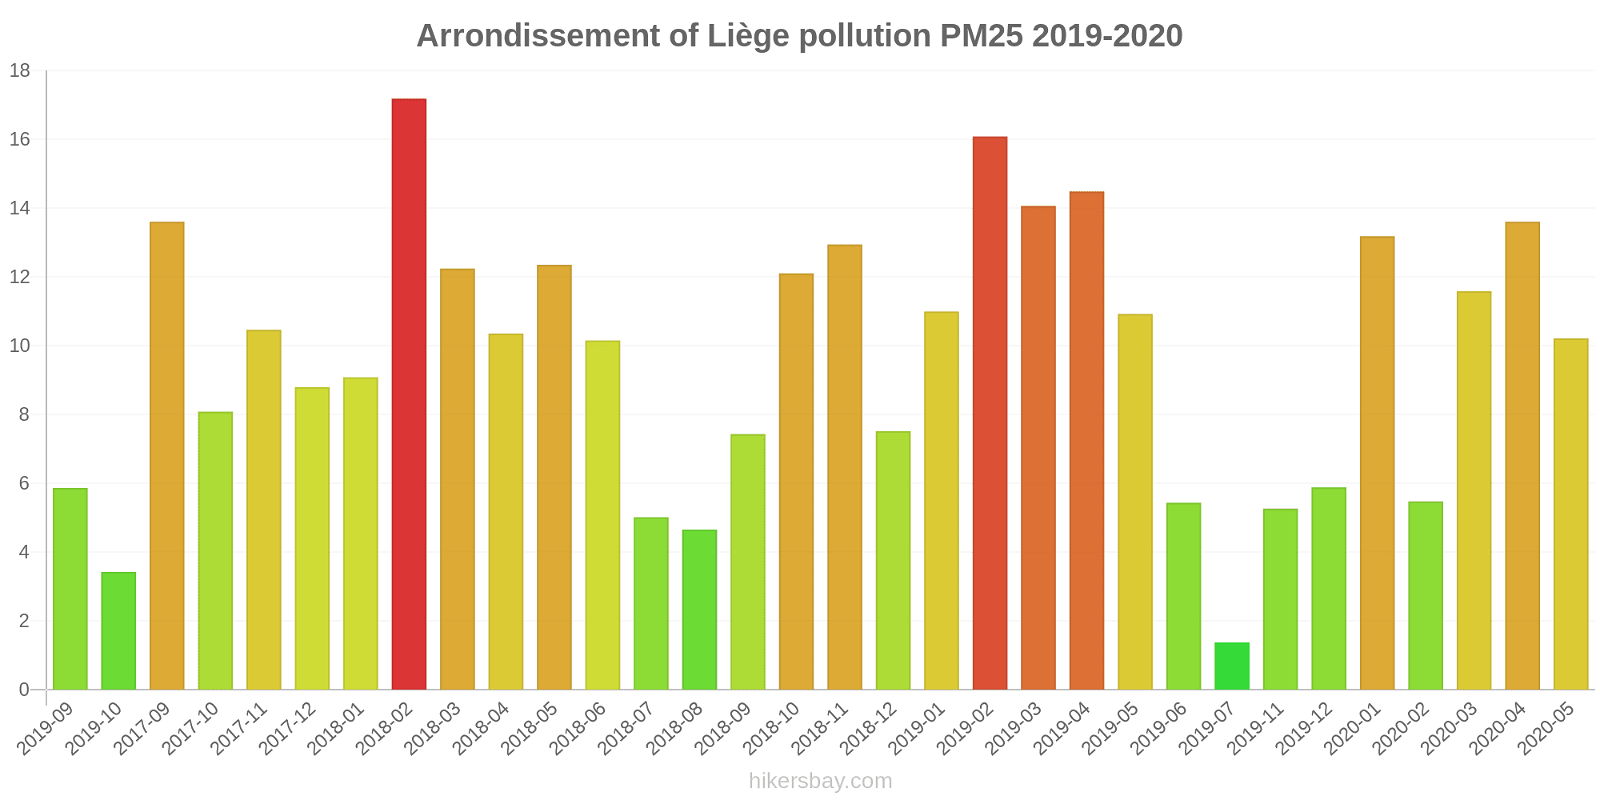
The highest PM10 values usually occur in month: 28 (February 2019).
The lowest value of particulate matter PM10 pollution in Arrondissement of Liège is usually recorded in: October (3.7).
What is the current level of PM2.5 in Arrondissement of Liège? (particulate matter (PM2.5) dust)
Today's PM2.5 level is:
22 (Moderate)
For comparison, the highest level of PM2.5 in Arrondissement of Liège in the last 7 days was: 41 (Thursday, January 11, 2024) and the lowest: 9 (Tuesday, January 16, 2024).
The highest PM2.5 values were recorded: 17 (February 2018).
The lowest level of particulate matter PM2.5 pollution occurs in month: July (1.4).
How is the O3 level today in Arrondissement of Liège? (ozone (O3))
8 (Good)
How high is the level of NO2? (nitrogen dioxide (NO2))
52 (Moderate)
How high is the CO level? (carbon monoxide (CO))
453 (Good)
What is the level of SO2 pollution? (sulfur dioxide (SO2))
1 (Good)
Current data Wednesday, January 17, 2024, 10:00 AM
PM10 34 (Moderate)
PM2,5 22 (Moderate)
O3 8 (Good)
NO2 52 (Moderate)
CO 453 (Good)
SO2 1 (Good)
Data on air pollution from recent days in Arrondissement of Liège
index
2024-01-10
2024-01-11
2024-01-12
2024-01-13
2024-01-14
2024-01-15
2024-01-16
2024-01-17
pm10
43
Moderate
57
Unhealthy for Sensitive Groups
37
Moderate
29
Moderate
12
Good
14
Good
15
Good
17
Good
pm25
26
Moderate
41
Unhealthy for Sensitive Groups
29
Moderate
23
Moderate
10
Good
10
Good
9
Good
13
Moderate
o3
5
Good
4
Good
8
Good
26
Good
35
Good
38
Good
38
Good
26
Good
no2
42
Moderate
43
Moderate
38
Good
26
Good
10
Good
22
Good
26
Good
28
Good
so2
1
Good
2
Good
1
Good
1
Good
1
Good
1
Good
0
Good
0
Good
co
583
Good
779
Good
405
Good
327
Good
244
Good
258
Good
262
Good
299
Good
data source »
Air pollution in Arrondissement of Liège from September 2017 to May 2020
index
2020-05
2020-04
2020-03
2020-02
2020-01
2019-12
2019-11
2019-10
2019-09
2019-07
2019-06
2019-05
2019-04
2019-03
2019-02
2019-01
2018-12
2018-11
2018-10
2018-09
2018-08
2018-07
2018-06
2018-05
2018-04
2018-03
2018-02
2018-01
2017-12
2017-11
2017-10
2017-09
pm10
17 (Good)
24 (Moderate)
15 (Good)
6.7 (Good)
17 (Good)
6.9 (Good)
7.3 (Good)
3.7 (Good)
7.2 (Good)
4 (Good)
11 (Good)
15 (Good)
20 (Moderate)
18 (Good)
28 (Moderate)
16 (Good)
11 (Good)
15 (Good)
19 (Good)
13 (Good)
11 (Good)
17 (Good)
18 (Good)
21 (Moderate)
18 (Good)
18 (Good)
24 (Moderate)
12 (Good)
11 (Good)
14 (Good)
13 (Good)
19 (Good)
pm25
10 (Good)
14 (Moderate)
12 (Good)
5.5 (Good)
13 (Moderate)
5.9 (Good)
5.3 (Good)
3.4 (Good)
5.9 (Good)
1.4 (Good)
5.4 (Good)
11 (Good)
14 (Moderate)
14 (Moderate)
16 (Moderate)
11 (Good)
7.5 (Good)
13 (Good)
12 (Good)
7.4 (Good)
4.7 (Good)
5 (Good)
10 (Good)
12 (Good)
10 (Good)
12 (Good)
17 (Moderate)
9.1 (Good)
8.8 (Good)
10 (Good)
8.1 (Good)
14 (Moderate)
o3
51 (Good)
47 (Good)
48 (Good)
59 (Good)
36 (Good)
23 (Good)
11 (Good)
21 (Good)
27 (Good)
26 (Good)
49 (Good)
43 (Good)
44 (Good)
46 (Good)
8.7 (Good)
37 (Good)
39 (Good)
29 (Good)
22 (Good)
32 (Good)
44 (Good)
54 (Good)
40 (Good)
41 (Good)
50 (Good)
48 (Good)
33 (Good)
42 (Good)
36 (Good)
25 (Good)
33 (Good)
23 (Good)
no2
17 (Good)
20 (Good)
15 (Good)
9.9 (Good)
15 (Good)
9.8 (Good)
10 (Good)
2.9 (Good)
15 (Good)
6 (Good)
15 (Good)
17 (Good)
22 (Good)
21 (Good)
36 (Good)
20 (Good)
14 (Good)
20 (Good)
21 (Good)
21 (Good)
18 (Good)
22 (Good)
18 (Good)
21 (Good)
24 (Good)
26 (Good)
30 (Good)
22 (Good)
20 (Good)
24 (Good)
18 (Good)
21 (Good)
so2
3.9 (Good)
3.1 (Good)
2.8 (Good)
1.2 (Good)
5.5 (Good)
3.8 (Good)
1.9 (Good)
1.2 (Good)
1.2 (Good)
3.3 (Good)
6.2 (Good)
2.8 (Good)
4.5 (Good)
6.3 (Good)
5.4 (Good)
2.7 (Good)
2.8 (Good)
2 (Good)
5.5 (Good)
2 (Good)
2.5 (Good)
5.4 (Good)
6.4 (Good)
3.6 (Good)
3.3 (Good)
2.5 (Good)
2.9 (Good)
2.5 (Good)
1.1 (Good)
3.2 (Good)
2.6 (Good)
5.7 (Good)
co
0.24 (Good)
0.27 (Good)
0.27 (Good)
0.2 (Good)
0.29 (Good)
0.18 (Good)
0.17 (Good)
0.08 (Good)
0.15 (Good)
0.07 (Good)
0.19 (Good)
0.21 (Good)
0.26 (Good)
0.27 (Good)
0.42 (Good)
0.25 (Good)
0.24 (Good)
0.34 (Good)
0.31 (Good)
0.23 (Good)
0.17 (Good)
0.16 (Good)
0.16 (Good)
0.21 (Good)
0.24 (Good)
0.29 (Good)
0.35 (Good)
0.27 (Good)
0.26 (Good)
7.6 (Good)
21 (Good)
28 (Good)
data source »
Quality of life in Arrondissement of Liège
Green and Parks in the City
Arrondissement of Liège
54%
Luxembourg: 83%
Netherlands: 82%
Germany: 78%
Switzerland: 76%
France: 61%
particulate matter PM2.5
Arrondissement of Liège
11 (Good)
Pleasure of spending time in the city
Arrondissement of Liège
57%
Luxembourg: 85%
Netherlands: 88%
Germany: 80%
Switzerland: 84%
France: 68%
particulate matter PM10
Arrondissement of Liège
20 (Good)
Air Pollution
Arrondissement of Liège
49%
Luxembourg: 19%
Netherlands: 21%
Germany: 25%
Switzerland: 20%
France: 36%
Garbage Disposal
Arrondissement of Liège
56%
Luxembourg: 84%
Netherlands: 79%
Germany: 74%
Switzerland: 82%
France: 59%
Availability and quality of drinking water
Arrondissement of Liège
73%
Luxembourg: 83%
Netherlands: 92%
Germany: 82%
Switzerland: 90%
France: 73%
Cleanliness and tidiness
Arrondissement of Liège
31%
Luxembourg: 82%
Netherlands: 77%
Germany: 65%
Switzerland: 82%
France: 48%
Noise and Light pollution
Arrondissement of Liège
54%
Luxembourg: 29%
Netherlands: 31%
Germany: 42%
Switzerland: 38%
France: 54%
Water Pollution
Arrondissement of Liège
31%
Luxembourg: 19%
Netherlands: 17%
Germany: 23%
Switzerland: 19%
France: 39%
Source: Numbeo
43H201 - LIEGE
Wednesday, January 17, 2024, 10:00 AM
PM10 45 (Moderate)
particulate matter (PM10) suspended dust
PM2,5 29 (Moderate)
particulate matter (PM2.5) dust
43M204 - ANGLEUR
Wednesday, January 17, 2024, 10:00 AM
PM2,5 22 (Moderate)
particulate matter (PM2.5) dust
PM10 35 (Moderate)
particulate matter (PM10) suspended dust
BETR221
Wednesday, January 17, 2024, 10:00 AM
O3 7.5 (Good)
ozone (O3)
NO2 52 (Moderate)
nitrogen dioxide (NO2)
PM10 25 (Moderate)
particulate matter (PM10) suspended dust
PM2,5 16 (Moderate)
particulate matter (PM2.5) dust
43R222 - SERAING
Wednesday, January 17, 2024, 10:00 AM
NO2 59 (Moderate)
nitrogen dioxide (NO2)
CO 475 (Good)
carbon monoxide (CO)
PM10 39 (Moderate)
particulate matter (PM10) suspended dust
SO2 0.5 (Good)
sulfur dioxide (SO2)
O3 7.5 (Good)
ozone (O3)
PM2,5 25 (Moderate)
particulate matter (PM2.5) dust
BETR223
Wednesday, January 17, 2024, 10:00 AM
PM10 28 (Moderate)
particulate matter (PM10) suspended dust
NO2 45 (Moderate)
nitrogen dioxide (NO2)
PM2,5 20 (Moderate)
particulate matter (PM2.5) dust
CO 430 (Good)
carbon monoxide (CO)
SO2 1 (Good)
sulfur dioxide (SO2)
43H201 - LIEGE
index
2024-01-17
2024-01-16
2024-01-15
2024-01-14
2024-01-13
2024-01-12
2024-01-11
2024-01-10
pm10
16
13
15
12
31
34
54
42
pm25
12
7.7
9.8
10
24
28
40
24
43M204 - ANGLEUR
index
2024-01-17
2024-01-16
2024-01-15
2024-01-14
2024-01-13
2024-01-12
2024-01-11
2024-01-10
pm25
15
9.7
8.4
9.2
21
30
42
28
pm10
19
15
13
11
24
37
55
42
BETR221
index
2024-01-17
2024-01-16
2024-01-15
2024-01-14
2024-01-13
2024-01-12
2024-01-11
2024-01-10
pm25
12
8.2
7.7
8.8
20
29
39
26
o3
23
33
36
33
23
6.4
3.5
6.1
no2
35
29
24
10
28
40
46
43
pm10
18
13
11
11
24
36
54
44
43R222 - SERAING
index
2024-01-17
2024-01-16
2024-01-15
2024-01-14
2024-01-13
2024-01-12
2024-01-11
2024-01-10
o3
29
42
40
37
28
11
5.3
4.4
pm25
13
8.5
10
10
23
30
41
26
so2
0
0
0
0
0
0
0.02
0
no2
26
19
18
6.7
21
40
42
42
pm10
18
15
16
12
29
38
59
45
co
301
249
256
239
327
420
692
562
BETR223
index
2024-01-17
2024-01-16
2024-01-15
2024-01-14
2024-01-13
2024-01-12
2024-01-11
2024-01-10
co
296
276
261
248
327
391
865
605
no2
24
31
25
14
30
34
42
40
pm25
14
12
13
13
28
29
44
28
so2
0.15
0.23
1.2
2.6
2.6
2.2
3.5
2.9
pm10
15
19
18
13
36
37
60
43
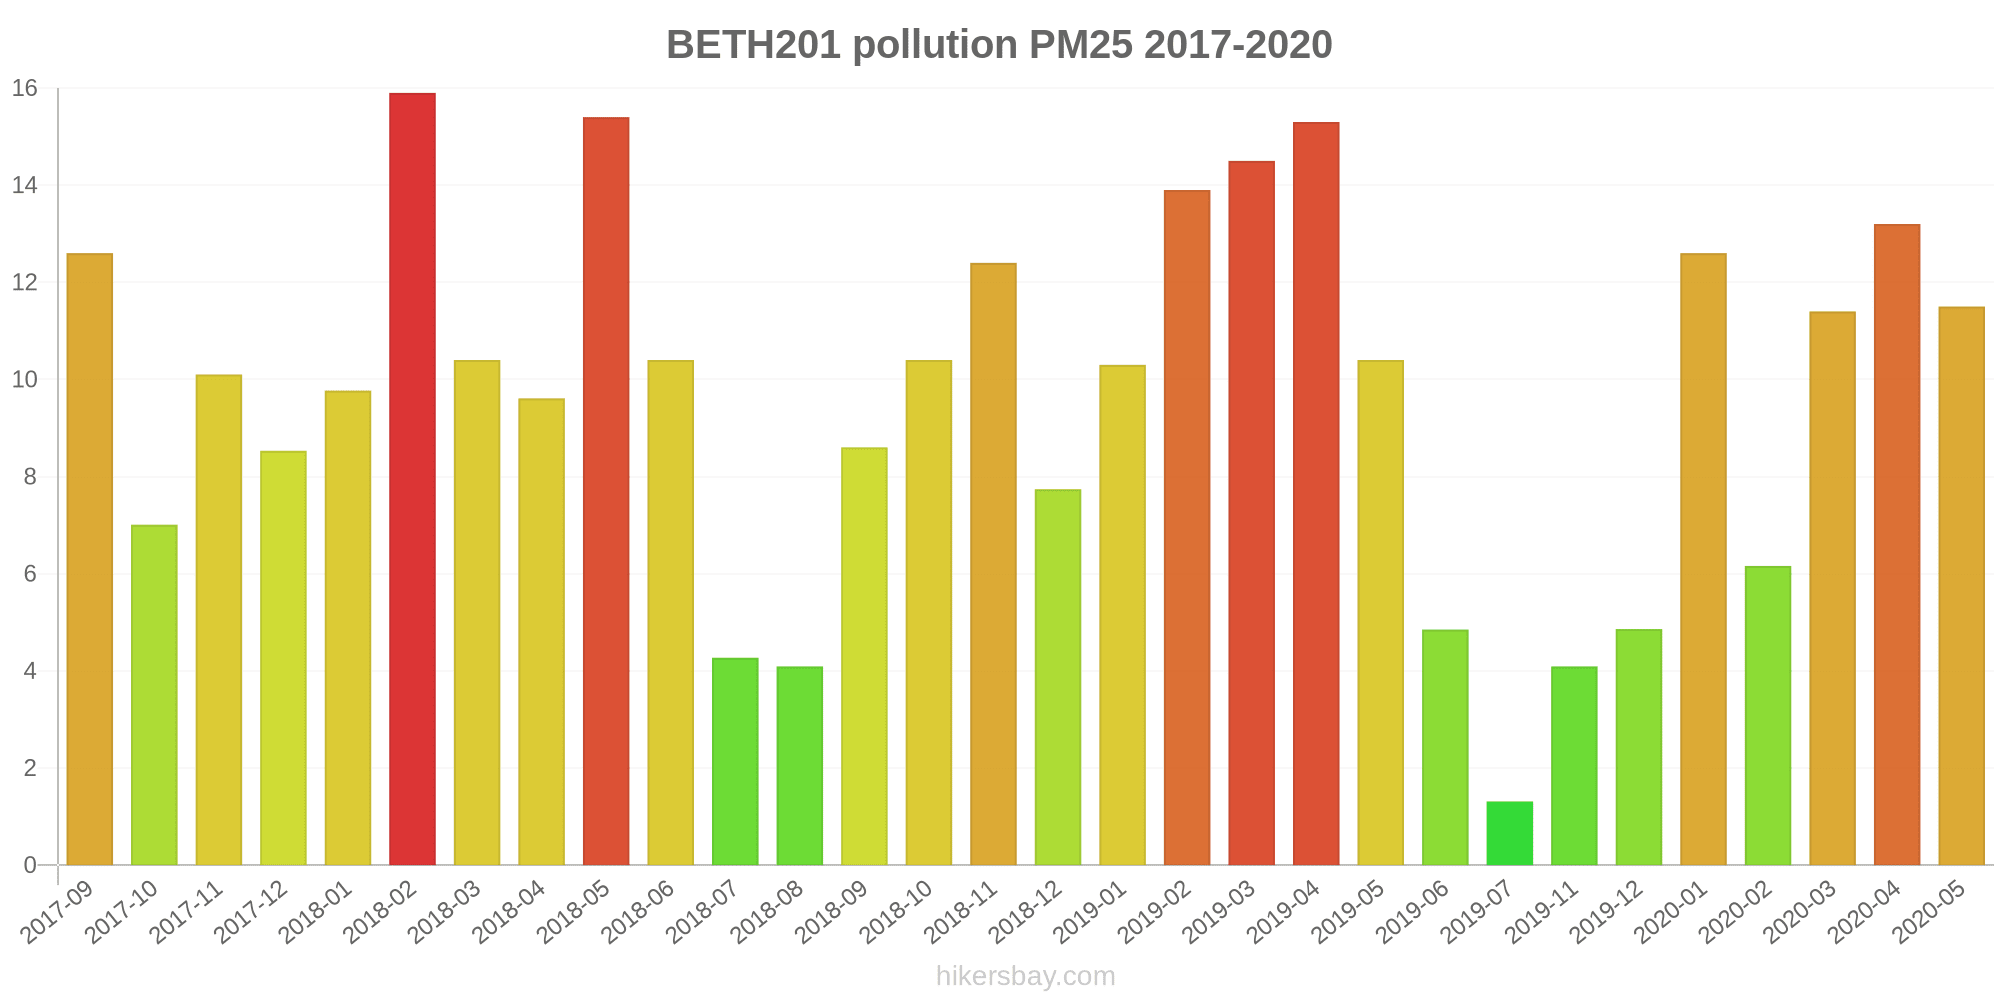
BETH201
2017-09 2020-05
index
2020-05
2020-04
2020-03
2020-02
2020-01
2019-12
2019-11
2019-10
2019-09
2019-07
2019-06
2019-05
2019-04
2019-03
2019-02
2019-01
2018-12
2018-11
2018-10
2018-09
2018-08
2018-07
2018-06
2018-05
2018-04
2018-03
2018-02
2018-01
2017-12
2017-11
2017-10
2017-09
pm25
12
13
11
6.2
13
4.9
4.1
-
-
1.3
4.8
10
15
15
14
10
7.7
12
10
8.6
4.1
4.3
10
15
9.6
10
16
9.8
8.5
10
7
13
pm10
19
26
15
6.5
16
5.5
5.7
5.4
8.2
4.8
11
15
20
19
26
16
8.6
13
16
15
11
18
19
25
17
15
23
11
12
14
12
17
BETM204
2017-09 2020-05
index
2020-05
2020-04
2020-03
2020-02
2020-01
2019-12
2019-11
2019-10
2019-09
2019-07
2019-06
2019-05
2019-04
2019-03
2019-02
2019-01
2018-12
2018-11
2018-10
2018-09
2018-08
2018-07
2018-06
2018-05
2018-04
2018-03
2018-02
2018-01
2017-12
2017-11
2017-10
2017-09
pm25
7.8
12
11
4.4
11
5.3
4.5
-
-
-
4.5
12
13
13
13
8.6
6.6
13
11
6.4
4.2
4.1
8.7
10
9.7
11
17
7.8
7.5
8.7
7.1
11
pm10
13
20
14
5.7
15
7.1
6.6
1.4
4.8
2.3
9.1
15
19
16
24
15
9.4
14
20
12
12
17
17
18
16
17
23
11
10
14
13
19
BETR221
2017-09 2020-05
index
2020-05
2020-04
2020-03
2020-02
2020-01
2019-12
2019-11
2019-10
2019-09
2019-07
2019-06
2019-05
2019-04
2019-03
2019-02
2019-01
2018-12
2018-11
2018-10
2018-09
2018-08
2018-07
2018-06
2018-05
2018-04
2018-03
2018-02
2018-01
2017-12
2017-11
2017-10
2017-09
pm25
9.8
13
12
4.9
15
5.9
5
-
-
0.62
4.4
9.7
15
15
15
12
5.7
15
11
5.6
3.5
3.5
7.8
9.2
11
12
16
9.5
7.7
10
7.4
15
pm10
17
24
14
6.1
16
6.3
6.6
1.4
-
4.6
11
15
20
19
26
15
7.7
15
17
11
10
16
16
19
17
19
25
12
9.9
14
12
20
no2
17
20
14
10
16
8.5
10
3.5
14
6.4
15
17
23
22
35
20
14
22
22
20
17
23
19
22
24
28
29
22
19
25
17
21
o3
51
48
49
58
37
24
10
21
27
26
53
45
44
48
13
36
37
28
21
33
43
54
44
42
49
48
34
40
36
25
33
22
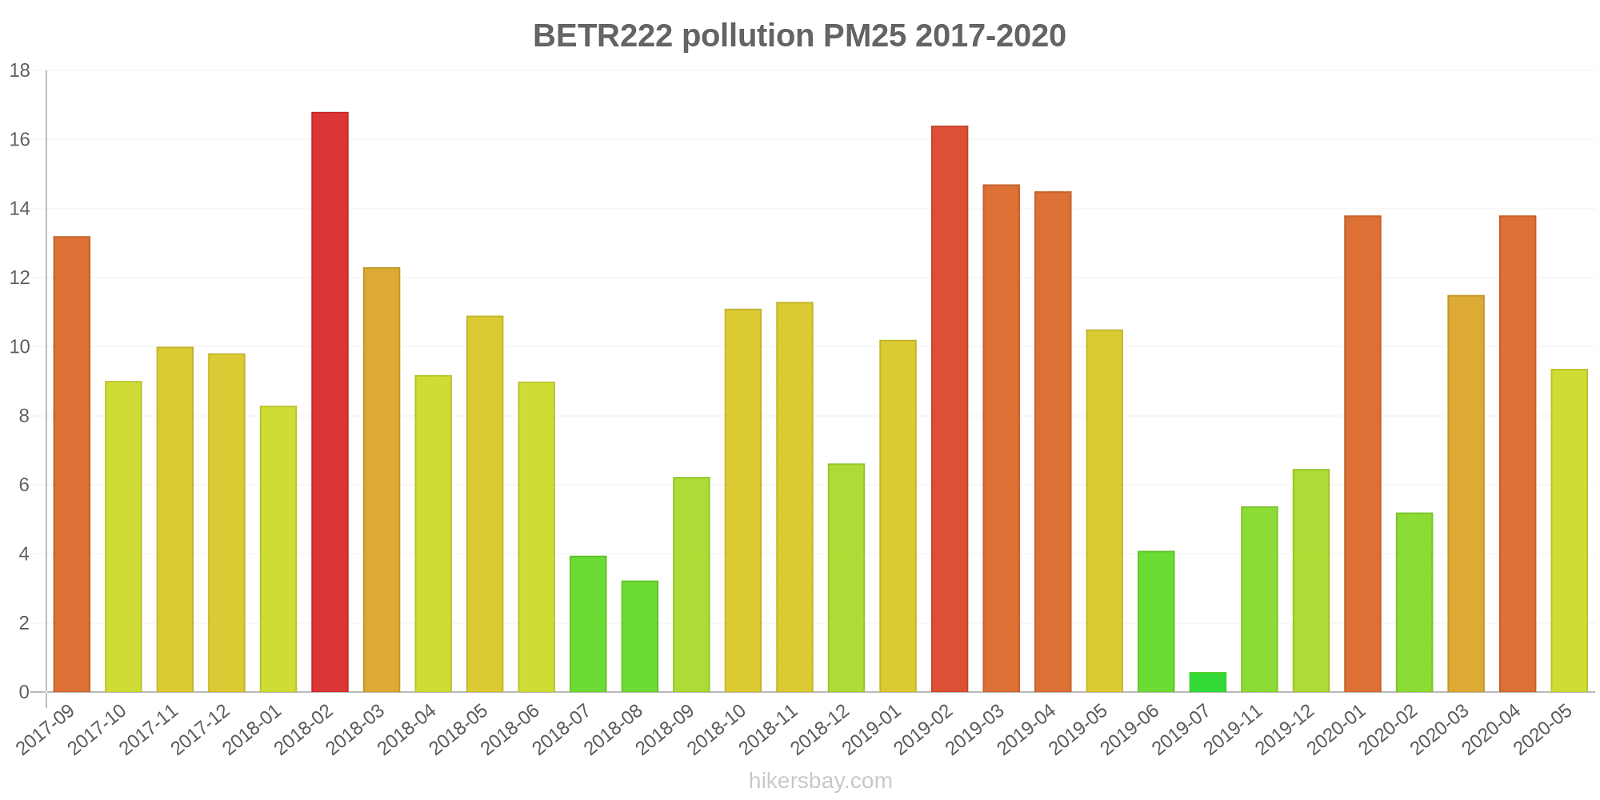
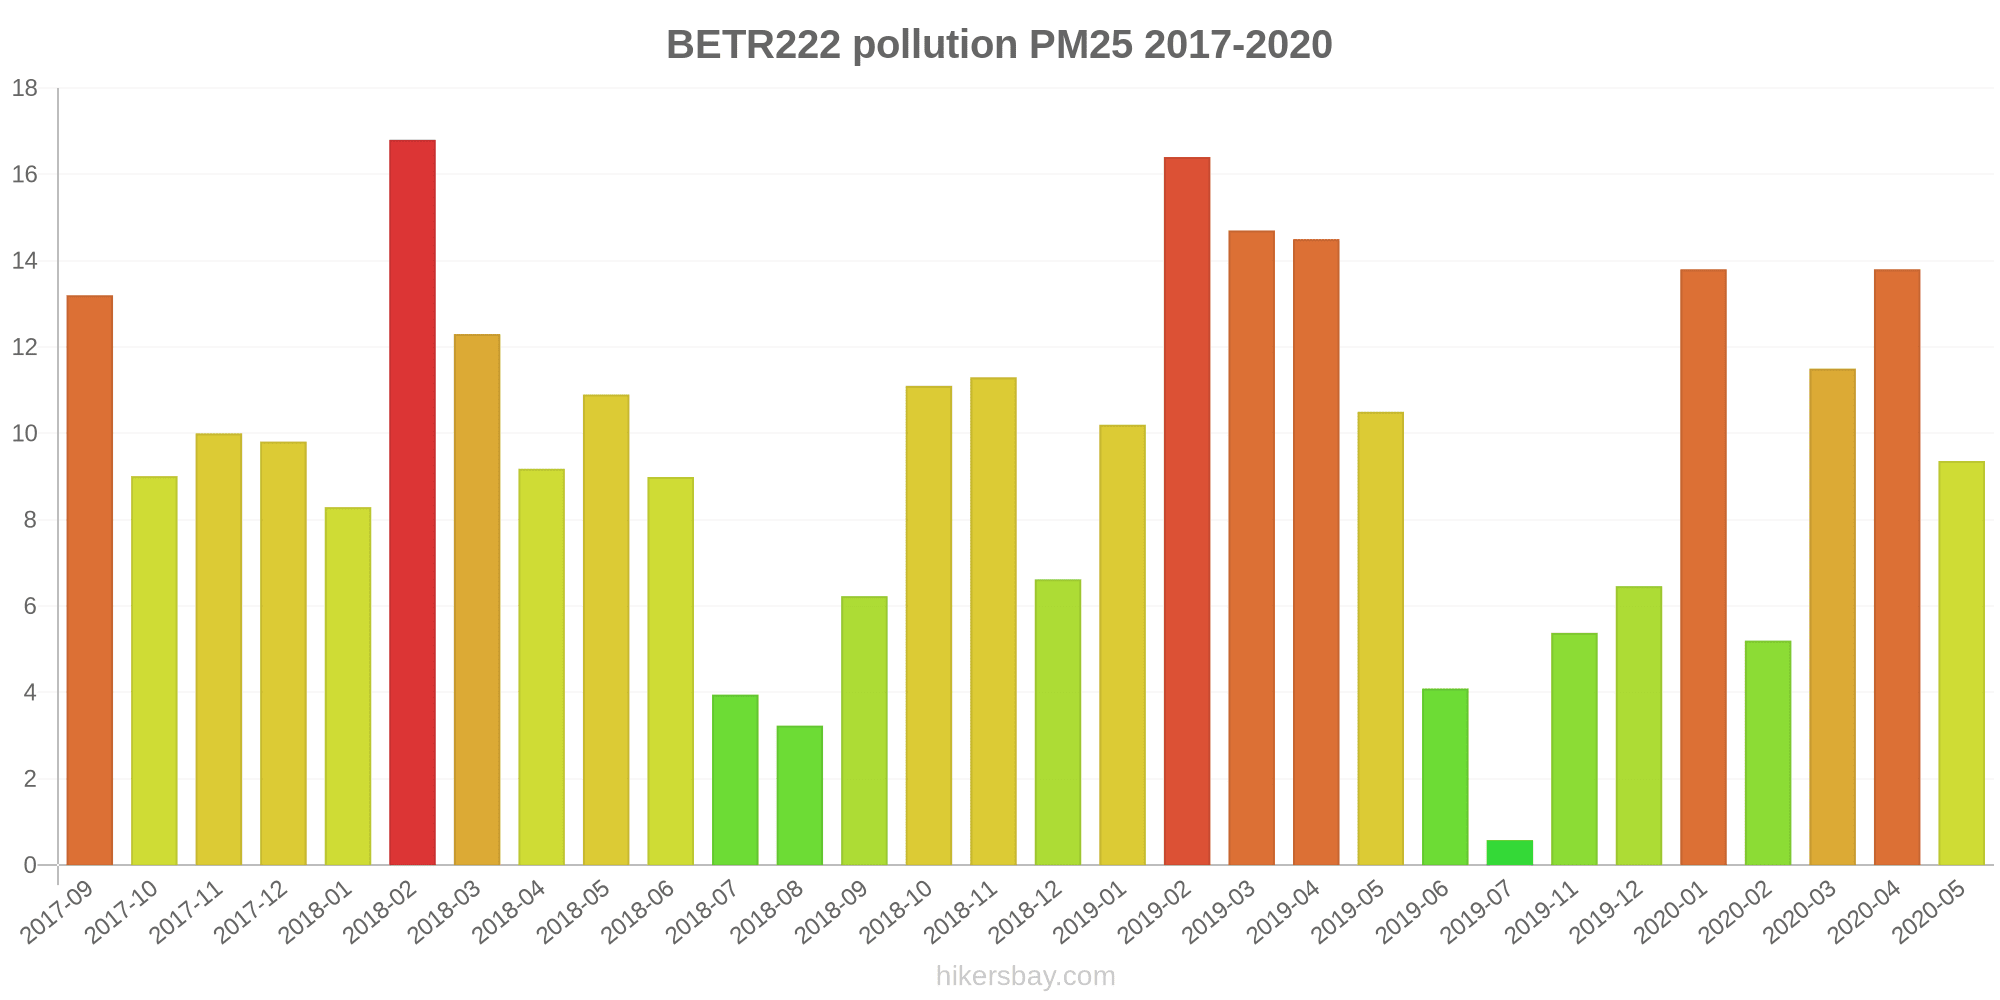
BETR222
2017-09 2020-05
index
2020-05
2020-04
2020-03
2020-02
2020-01
2019-12
2019-11
2019-10
2019-07
2019-06
2019-05
2019-04
2019-03
2019-02
2019-01
2018-12
2018-11
2018-10
2018-09
2018-08
2018-07
2018-06
2018-05
2018-04
2018-03
2018-02
2018-01
2017-12
2017-11
2017-10
2017-09
pm25
9.4
14
12
5.2
14
6.5
5.4
-
0.58
4.1
11
15
15
16
10
6.6
11
11
6.2
3.2
4
9
11
9.2
12
17
8.3
9.8
10
9
13
pm10
16
24
14
6.8
16
7.6
7.5
5.6
4.7
11
16
22
18
29
18
13
14
19
12
10
15
17
20
16
19
26
11
12
16
16
21
co
0.23
0.25
0.24
0.17
0.26
0.17
0.15
0.08
0.06
0.16
0.18
0.24
0.25
0.36
0.23
0.21
0.32
0.26
0.22
0.17
0.14
0.14
0.19
0.21
0.27
0.32
0.26
0.26
6.3
20
26
so2
7
4.3
4.4
1.4
9.3
6.2
3.1
2
6.1
12
5.1
6.5
11
9.1
4.5
4.6
3.3
5.5
3.1
4.4
9.5
12
6.2
4.6
3.4
4.6
3.6
1.3
5.5
3.3
8.9
no2
16
18
14
7.4
13
9.7
11
2
6.6
16
17
22
20
39
21
13
19
21
20
19
21
19
21
22
26
32
21
20
23
17
23
o3
51
46
47
60
36
22
11
21
26
46
41
44
44
4.6
38
40
29
23
32
46
54
36
40
51
48
32
44
37
25
33
24
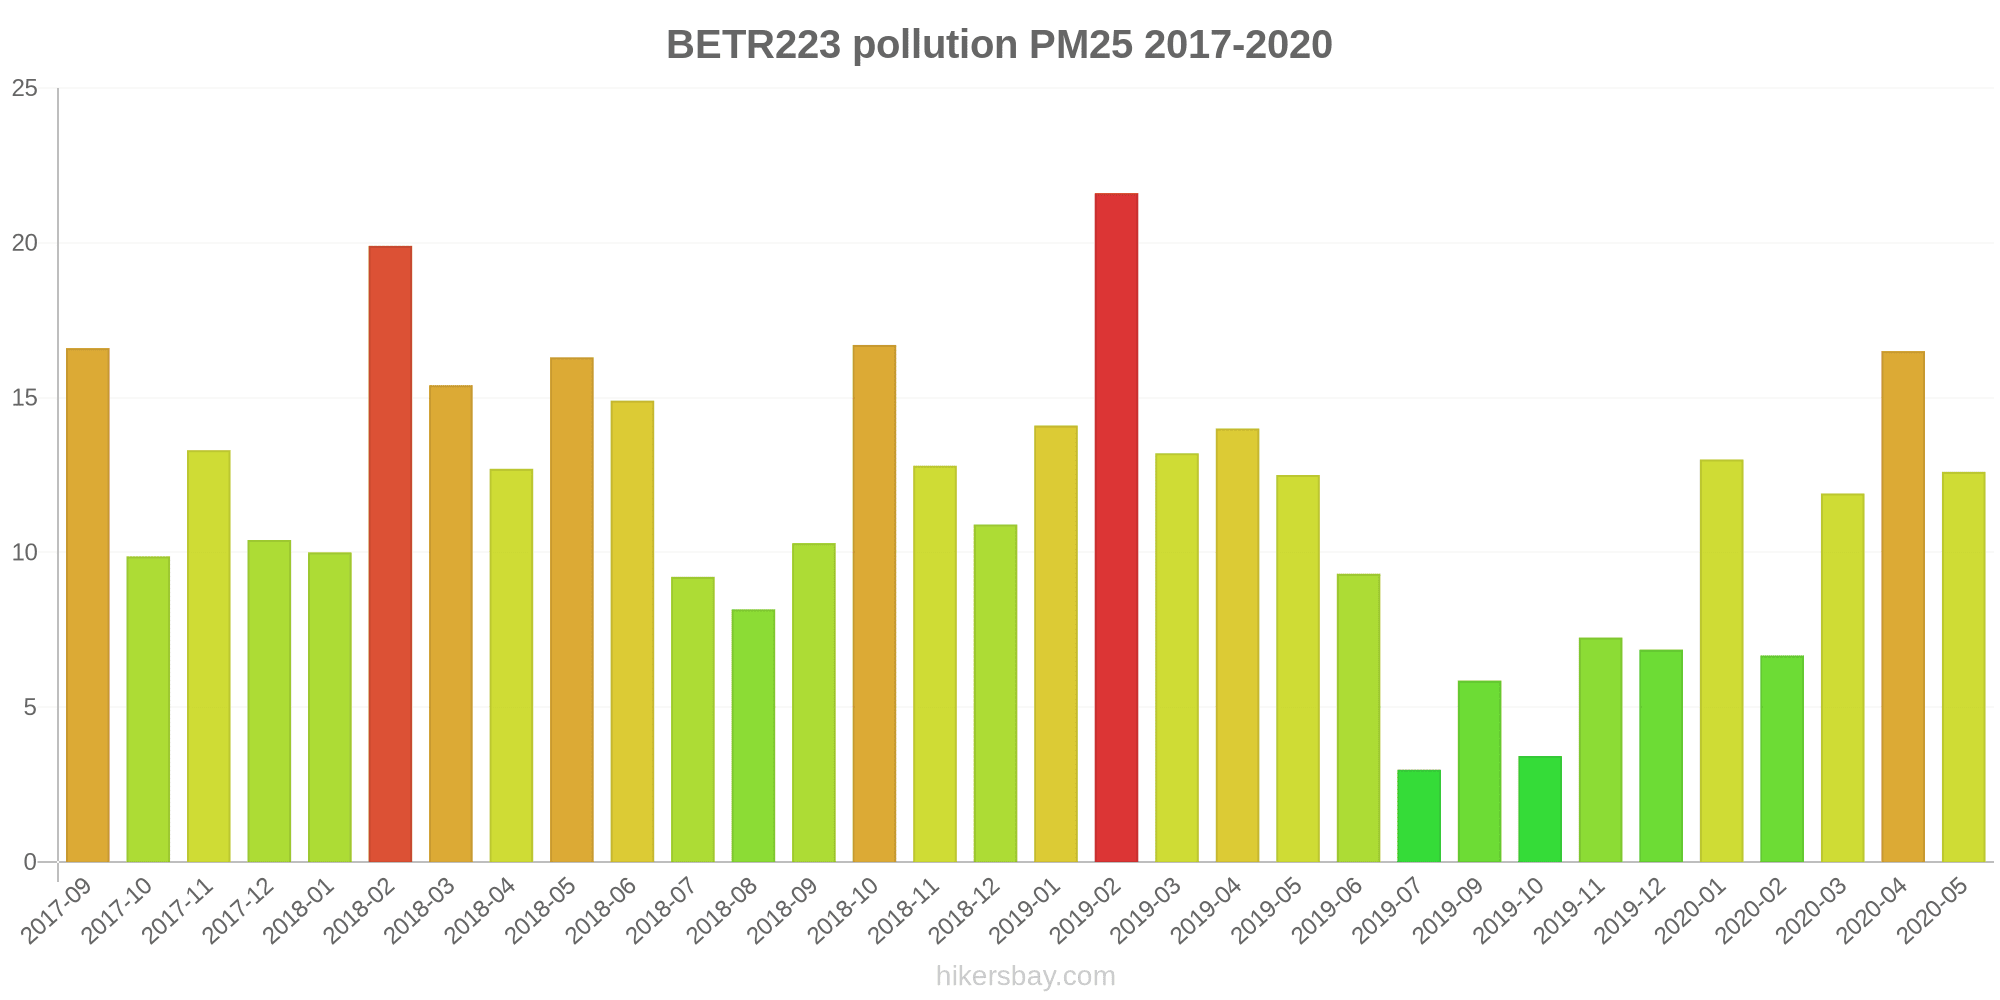
BETR223
2017-09 2020-05

index
2020-05
2020-04
2020-03
2020-02
2020-01
2019-12
2019-11
2019-10
2019-09
2019-07
2019-06
2019-05
2019-04
2019-03
2019-02
2019-01
2018-12
2018-11
2018-10
2018-09
2018-08
2018-07
2018-06
2018-05
2018-04
2018-03
2018-02
2018-01
2017-12
2017-11
2017-10
2017-09
pm25
13
17
12
6.7
13
6.9
7.3
3.4
5.9
3
9.3
13
14
13
22
14
11
13
17
10
8.2
9.2
15
16
13
15
20
10
10
13
9.9
17
pm10
17
25
17
8.4
20
8.2
10
4.9
8.5
3.5
13
16
20
21
34
18
19
16
25
15
13
17
22
25
21
20
25
15
13
15
11
19
co
0.25
0.29
0.3
0.22
0.32
0.19
0.19
0.07
0.15
0.07
0.22
0.23
0.28
0.29
0.48
0.27
0.27
0.36
0.35
0.24
0.17
0.17
0.18
0.24
0.27
0.3
0.38
0.28
0.27
8.9
23
30
so2
0.83
1.8
1.1
1
1.8
1.4
0.71
0.42
1.2
0.48
0.76
0.47
2.4
2.1
1.8
0.94
1.1
0.69
-
1
0.55
1.3
1.1
1
1.9
1.6
1.3
1.4
1
1
1.8
2.5
no2
17
21
16
12
17
11
9.5
3.3
16
5
14
16
20
20
34
20
15
19
19
22
17
23
17
21
25
23
28
22
20
25
19
19
* Pollution data source:
https://openaq.org
(EEA Belgium)
The data is licensed under CC-By 4.0
PM10 34 (Moderate)
PM2,5 22 (Moderate)
O3 8 (Good)
NO2 52 (Moderate)
CO 453 (Good)
SO2 1 (Good)
Data on air pollution from recent days in Arrondissement of Liège
| index | 2024-01-10 | 2024-01-11 | 2024-01-12 | 2024-01-13 | 2024-01-14 | 2024-01-15 | 2024-01-16 | 2024-01-17 |
|---|---|---|---|---|---|---|---|---|
| pm10 | 43 Moderate |
57 Unhealthy for Sensitive Groups |
37 Moderate |
29 Moderate |
12 Good |
14 Good |
15 Good |
17 Good |
| pm25 | 26 Moderate |
41 Unhealthy for Sensitive Groups |
29 Moderate |
23 Moderate |
10 Good |
10 Good |
9 Good |
13 Moderate |
| o3 | 5 Good |
4 Good |
8 Good |
26 Good |
35 Good |
38 Good |
38 Good |
26 Good |
| no2 | 42 Moderate |
43 Moderate |
38 Good |
26 Good |
10 Good |
22 Good |
26 Good |
28 Good |
| so2 | 1 Good |
2 Good |
1 Good |
1 Good |
1 Good |
1 Good |
0 Good |
0 Good |
| co | 583 Good |
779 Good |
405 Good |
327 Good |
244 Good |
258 Good |
262 Good |
299 Good |

| index | 2020-05 | 2020-04 | 2020-03 | 2020-02 | 2020-01 | 2019-12 | 2019-11 | 2019-10 | 2019-09 | 2019-07 | 2019-06 | 2019-05 | 2019-04 | 2019-03 | 2019-02 | 2019-01 | 2018-12 | 2018-11 | 2018-10 | 2018-09 | 2018-08 | 2018-07 | 2018-06 | 2018-05 | 2018-04 | 2018-03 | 2018-02 | 2018-01 | 2017-12 | 2017-11 | 2017-10 | 2017-09 |
|---|---|---|---|---|---|---|---|---|---|---|---|---|---|---|---|---|---|---|---|---|---|---|---|---|---|---|---|---|---|---|---|---|
| pm10 | 17 (Good) | 24 (Moderate) | 15 (Good) | 6.7 (Good) | 17 (Good) | 6.9 (Good) | 7.3 (Good) | 3.7 (Good) | 7.2 (Good) | 4 (Good) | 11 (Good) | 15 (Good) | 20 (Moderate) | 18 (Good) | 28 (Moderate) | 16 (Good) | 11 (Good) | 15 (Good) | 19 (Good) | 13 (Good) | 11 (Good) | 17 (Good) | 18 (Good) | 21 (Moderate) | 18 (Good) | 18 (Good) | 24 (Moderate) | 12 (Good) | 11 (Good) | 14 (Good) | 13 (Good) | 19 (Good) |
| pm25 | 10 (Good) | 14 (Moderate) | 12 (Good) | 5.5 (Good) | 13 (Moderate) | 5.9 (Good) | 5.3 (Good) | 3.4 (Good) | 5.9 (Good) | 1.4 (Good) | 5.4 (Good) | 11 (Good) | 14 (Moderate) | 14 (Moderate) | 16 (Moderate) | 11 (Good) | 7.5 (Good) | 13 (Good) | 12 (Good) | 7.4 (Good) | 4.7 (Good) | 5 (Good) | 10 (Good) | 12 (Good) | 10 (Good) | 12 (Good) | 17 (Moderate) | 9.1 (Good) | 8.8 (Good) | 10 (Good) | 8.1 (Good) | 14 (Moderate) |
| o3 | 51 (Good) | 47 (Good) | 48 (Good) | 59 (Good) | 36 (Good) | 23 (Good) | 11 (Good) | 21 (Good) | 27 (Good) | 26 (Good) | 49 (Good) | 43 (Good) | 44 (Good) | 46 (Good) | 8.7 (Good) | 37 (Good) | 39 (Good) | 29 (Good) | 22 (Good) | 32 (Good) | 44 (Good) | 54 (Good) | 40 (Good) | 41 (Good) | 50 (Good) | 48 (Good) | 33 (Good) | 42 (Good) | 36 (Good) | 25 (Good) | 33 (Good) | 23 (Good) |
| no2 | 17 (Good) | 20 (Good) | 15 (Good) | 9.9 (Good) | 15 (Good) | 9.8 (Good) | 10 (Good) | 2.9 (Good) | 15 (Good) | 6 (Good) | 15 (Good) | 17 (Good) | 22 (Good) | 21 (Good) | 36 (Good) | 20 (Good) | 14 (Good) | 20 (Good) | 21 (Good) | 21 (Good) | 18 (Good) | 22 (Good) | 18 (Good) | 21 (Good) | 24 (Good) | 26 (Good) | 30 (Good) | 22 (Good) | 20 (Good) | 24 (Good) | 18 (Good) | 21 (Good) |
| so2 | 3.9 (Good) | 3.1 (Good) | 2.8 (Good) | 1.2 (Good) | 5.5 (Good) | 3.8 (Good) | 1.9 (Good) | 1.2 (Good) | 1.2 (Good) | 3.3 (Good) | 6.2 (Good) | 2.8 (Good) | 4.5 (Good) | 6.3 (Good) | 5.4 (Good) | 2.7 (Good) | 2.8 (Good) | 2 (Good) | 5.5 (Good) | 2 (Good) | 2.5 (Good) | 5.4 (Good) | 6.4 (Good) | 3.6 (Good) | 3.3 (Good) | 2.5 (Good) | 2.9 (Good) | 2.5 (Good) | 1.1 (Good) | 3.2 (Good) | 2.6 (Good) | 5.7 (Good) |
| co | 0.24 (Good) | 0.27 (Good) | 0.27 (Good) | 0.2 (Good) | 0.29 (Good) | 0.18 (Good) | 0.17 (Good) | 0.08 (Good) | 0.15 (Good) | 0.07 (Good) | 0.19 (Good) | 0.21 (Good) | 0.26 (Good) | 0.27 (Good) | 0.42 (Good) | 0.25 (Good) | 0.24 (Good) | 0.34 (Good) | 0.31 (Good) | 0.23 (Good) | 0.17 (Good) | 0.16 (Good) | 0.16 (Good) | 0.21 (Good) | 0.24 (Good) | 0.29 (Good) | 0.35 (Good) | 0.27 (Good) | 0.26 (Good) | 7.6 (Good) | 21 (Good) | 28 (Good) |
Green and Parks in the City
Arrondissement of Liège 54%
Luxembourg: 83% Netherlands: 82% Germany: 78% Switzerland: 76% France: 61%particulate matter PM2.5
Arrondissement of Liège 11 (Good)
Pleasure of spending time in the city
Arrondissement of Liège 57%
Luxembourg: 85% Netherlands: 88% Germany: 80% Switzerland: 84% France: 68%particulate matter PM10
Arrondissement of Liège 20 (Good)
Air Pollution
Arrondissement of Liège 49%
Luxembourg: 19% Netherlands: 21% Germany: 25% Switzerland: 20% France: 36%Garbage Disposal
Arrondissement of Liège 56%
Luxembourg: 84% Netherlands: 79% Germany: 74% Switzerland: 82% France: 59%Availability and quality of drinking water
Arrondissement of Liège 73%
Luxembourg: 83% Netherlands: 92% Germany: 82% Switzerland: 90% France: 73%Cleanliness and tidiness
Arrondissement of Liège 31%
Luxembourg: 82% Netherlands: 77% Germany: 65% Switzerland: 82% France: 48%Noise and Light pollution
Arrondissement of Liège 54%
Luxembourg: 29% Netherlands: 31% Germany: 42% Switzerland: 38% France: 54%Water Pollution
Arrondissement of Liège 31%
Luxembourg: 19% Netherlands: 17% Germany: 23% Switzerland: 19% France: 39%PM10 45 (Moderate)
particulate matter (PM10) suspended dustPM2,5 29 (Moderate)
particulate matter (PM2.5) dustPM2,5 22 (Moderate)
particulate matter (PM2.5) dustPM10 35 (Moderate)
particulate matter (PM10) suspended dustO3 7.5 (Good)
ozone (O3)NO2 52 (Moderate)
nitrogen dioxide (NO2)PM10 25 (Moderate)
particulate matter (PM10) suspended dustPM2,5 16 (Moderate)
particulate matter (PM2.5) dustNO2 59 (Moderate)
nitrogen dioxide (NO2)CO 475 (Good)
carbon monoxide (CO)PM10 39 (Moderate)
particulate matter (PM10) suspended dustSO2 0.5 (Good)
sulfur dioxide (SO2)O3 7.5 (Good)
ozone (O3)PM2,5 25 (Moderate)
particulate matter (PM2.5) dustPM10 28 (Moderate)
particulate matter (PM10) suspended dustNO2 45 (Moderate)
nitrogen dioxide (NO2)PM2,5 20 (Moderate)
particulate matter (PM2.5) dustCO 430 (Good)
carbon monoxide (CO)SO2 1 (Good)
sulfur dioxide (SO2)43H201 - LIEGE
| index | 2024-01-17 | 2024-01-16 | 2024-01-15 | 2024-01-14 | 2024-01-13 | 2024-01-12 | 2024-01-11 | 2024-01-10 |
|---|---|---|---|---|---|---|---|---|
| pm10 | 16 | 13 | 15 | 12 | 31 | 34 | 54 | 42 |
| pm25 | 12 | 7.7 | 9.8 | 10 | 24 | 28 | 40 | 24 |
43M204 - ANGLEUR
| index | 2024-01-17 | 2024-01-16 | 2024-01-15 | 2024-01-14 | 2024-01-13 | 2024-01-12 | 2024-01-11 | 2024-01-10 |
|---|---|---|---|---|---|---|---|---|
| pm25 | 15 | 9.7 | 8.4 | 9.2 | 21 | 30 | 42 | 28 |
| pm10 | 19 | 15 | 13 | 11 | 24 | 37 | 55 | 42 |
BETR221
| index | 2024-01-17 | 2024-01-16 | 2024-01-15 | 2024-01-14 | 2024-01-13 | 2024-01-12 | 2024-01-11 | 2024-01-10 |
|---|---|---|---|---|---|---|---|---|
| pm25 | 12 | 8.2 | 7.7 | 8.8 | 20 | 29 | 39 | 26 |
| o3 | 23 | 33 | 36 | 33 | 23 | 6.4 | 3.5 | 6.1 |
| no2 | 35 | 29 | 24 | 10 | 28 | 40 | 46 | 43 |
| pm10 | 18 | 13 | 11 | 11 | 24 | 36 | 54 | 44 |
43R222 - SERAING
| index | 2024-01-17 | 2024-01-16 | 2024-01-15 | 2024-01-14 | 2024-01-13 | 2024-01-12 | 2024-01-11 | 2024-01-10 |
|---|---|---|---|---|---|---|---|---|
| o3 | 29 | 42 | 40 | 37 | 28 | 11 | 5.3 | 4.4 |
| pm25 | 13 | 8.5 | 10 | 10 | 23 | 30 | 41 | 26 |
| so2 | 0 | 0 | 0 | 0 | 0 | 0 | 0.02 | 0 |
| no2 | 26 | 19 | 18 | 6.7 | 21 | 40 | 42 | 42 |
| pm10 | 18 | 15 | 16 | 12 | 29 | 38 | 59 | 45 |
| co | 301 | 249 | 256 | 239 | 327 | 420 | 692 | 562 |
BETR223
| index | 2024-01-17 | 2024-01-16 | 2024-01-15 | 2024-01-14 | 2024-01-13 | 2024-01-12 | 2024-01-11 | 2024-01-10 |
|---|---|---|---|---|---|---|---|---|
| co | 296 | 276 | 261 | 248 | 327 | 391 | 865 | 605 |
| no2 | 24 | 31 | 25 | 14 | 30 | 34 | 42 | 40 |
| pm25 | 14 | 12 | 13 | 13 | 28 | 29 | 44 | 28 |
| so2 | 0.15 | 0.23 | 1.2 | 2.6 | 2.6 | 2.2 | 3.5 | 2.9 |
| pm10 | 15 | 19 | 18 | 13 | 36 | 37 | 60 | 43 |
BETH201
| index | 2020-05 | 2020-04 | 2020-03 | 2020-02 | 2020-01 | 2019-12 | 2019-11 | 2019-10 | 2019-09 | 2019-07 | 2019-06 | 2019-05 | 2019-04 | 2019-03 | 2019-02 | 2019-01 | 2018-12 | 2018-11 | 2018-10 | 2018-09 | 2018-08 | 2018-07 | 2018-06 | 2018-05 | 2018-04 | 2018-03 | 2018-02 | 2018-01 | 2017-12 | 2017-11 | 2017-10 | 2017-09 |
|---|---|---|---|---|---|---|---|---|---|---|---|---|---|---|---|---|---|---|---|---|---|---|---|---|---|---|---|---|---|---|---|---|
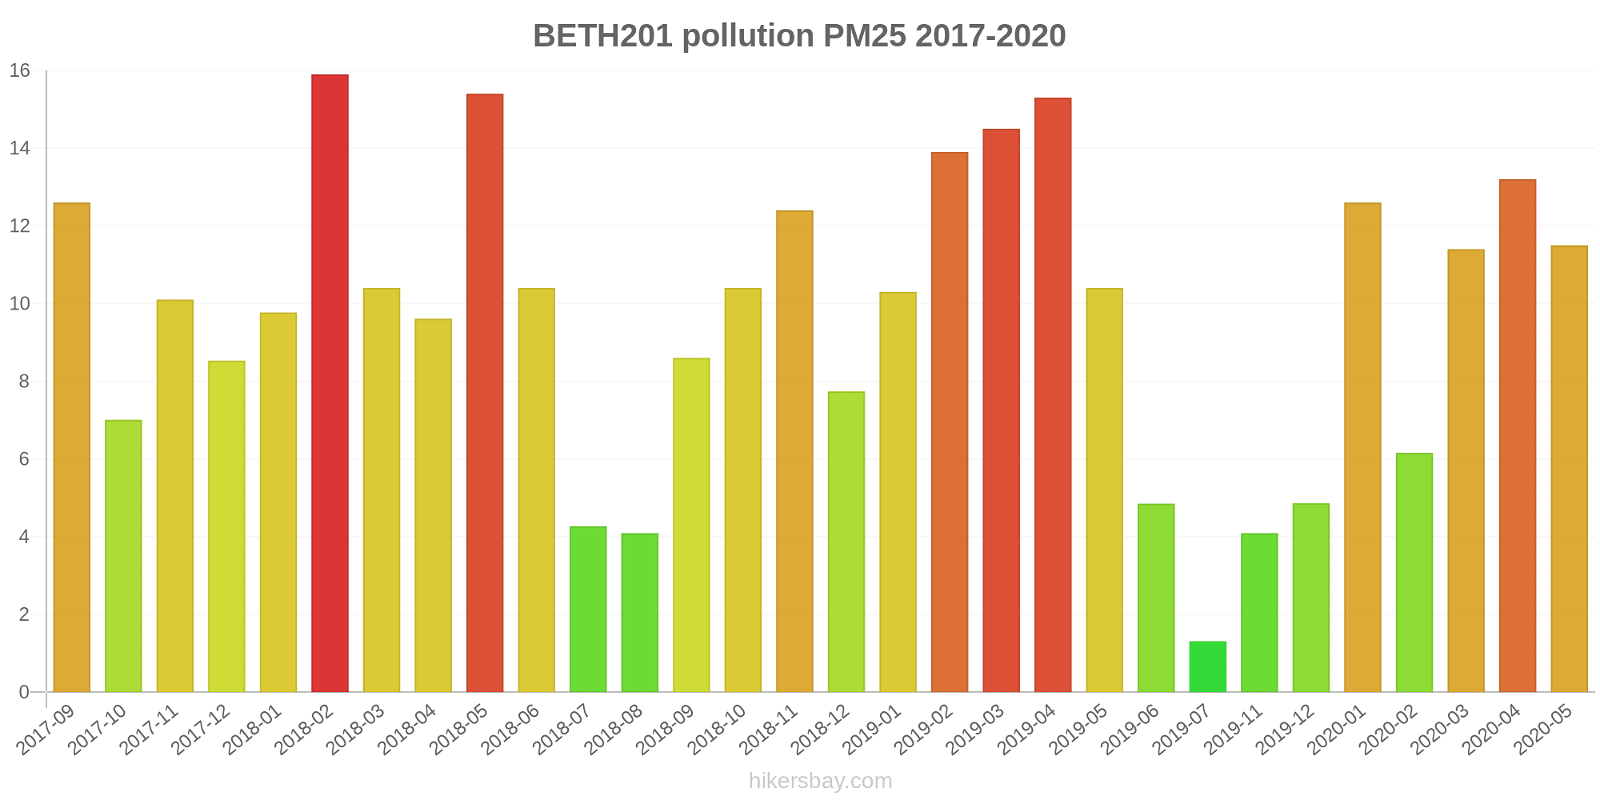
| pm25 | 12 | 13 | 11 | 6.2 | 13 | 4.9 | 4.1 | - | - | 1.3 | 4.8 | 10 | 15 | 15 | 14 | 10 | 7.7 | 12 | 10 | 8.6 | 4.1 | 4.3 | 10 | 15 | 9.6 | 10 | 16 | 9.8 | 8.5 | 10 | 7 | 13 |
| pm10 | 19 | 26 | 15 | 6.5 | 16 | 5.5 | 5.7 | 5.4 | 8.2 | 4.8 | 11 | 15 | 20 | 19 | 26 | 16 | 8.6 | 13 | 16 | 15 | 11 | 18 | 19 | 25 | 17 | 15 | 23 | 11 | 12 | 14 | 12 | 17 |
BETM204

| index | 2020-05 | 2020-04 | 2020-03 | 2020-02 | 2020-01 | 2019-12 | 2019-11 | 2019-10 | 2019-09 | 2019-07 | 2019-06 | 2019-05 | 2019-04 | 2019-03 | 2019-02 | 2019-01 | 2018-12 | 2018-11 | 2018-10 | 2018-09 | 2018-08 | 2018-07 | 2018-06 | 2018-05 | 2018-04 | 2018-03 | 2018-02 | 2018-01 | 2017-12 | 2017-11 | 2017-10 | 2017-09 |
|---|---|---|---|---|---|---|---|---|---|---|---|---|---|---|---|---|---|---|---|---|---|---|---|---|---|---|---|---|---|---|---|---|
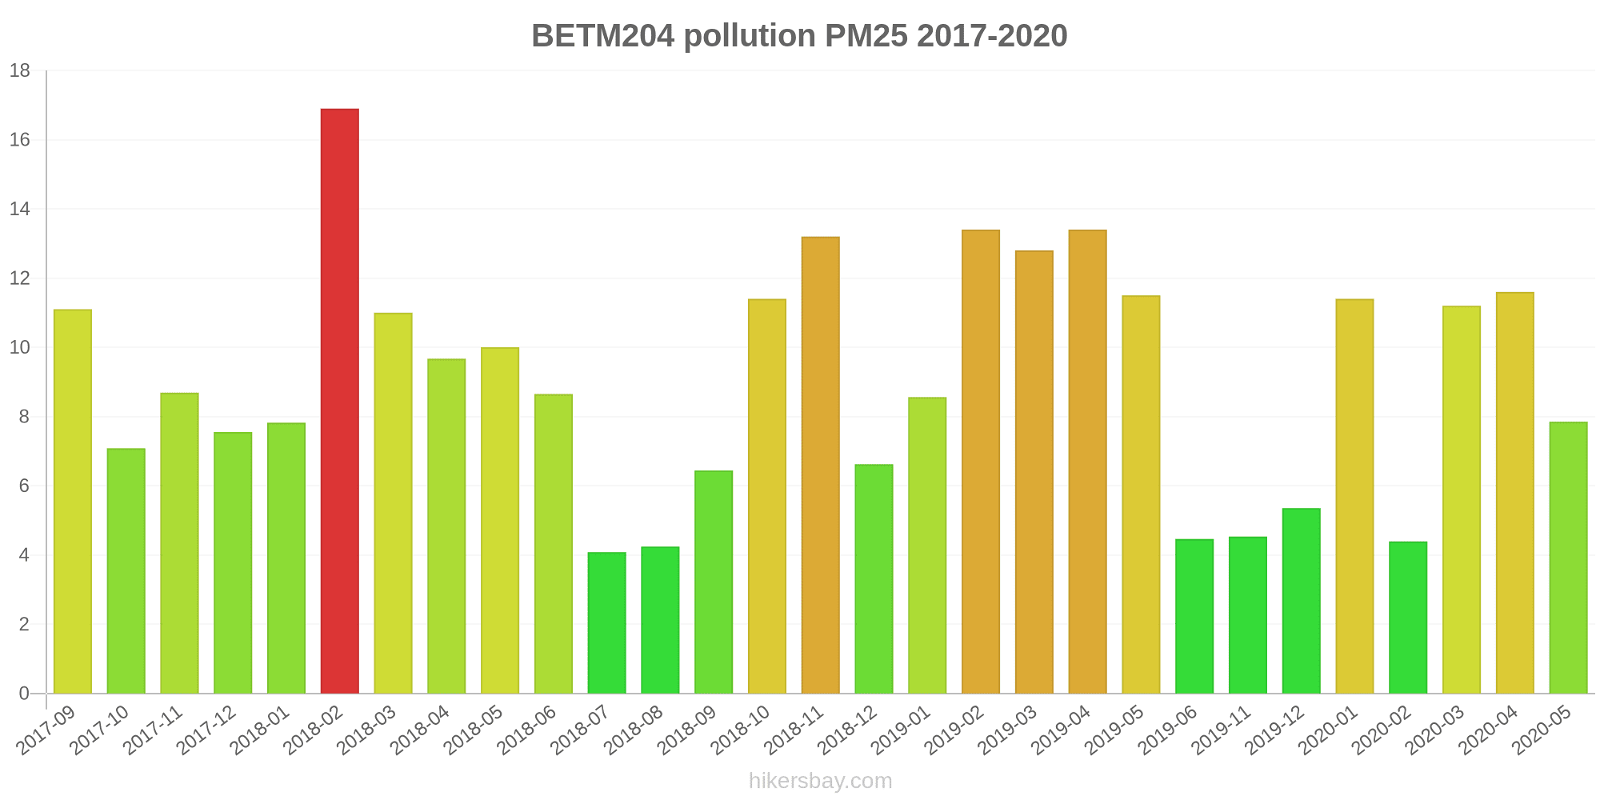
| pm25 | 7.8 | 12 | 11 | 4.4 | 11 | 5.3 | 4.5 | - | - | - | 4.5 | 12 | 13 | 13 | 13 | 8.6 | 6.6 | 13 | 11 | 6.4 | 4.2 | 4.1 | 8.7 | 10 | 9.7 | 11 | 17 | 7.8 | 7.5 | 8.7 | 7.1 | 11 |
| pm10 | 13 | 20 | 14 | 5.7 | 15 | 7.1 | 6.6 | 1.4 | 4.8 | 2.3 | 9.1 | 15 | 19 | 16 | 24 | 15 | 9.4 | 14 | 20 | 12 | 12 | 17 | 17 | 18 | 16 | 17 | 23 | 11 | 10 | 14 | 13 | 19 |
BETR221

| index | 2020-05 | 2020-04 | 2020-03 | 2020-02 | 2020-01 | 2019-12 | 2019-11 | 2019-10 | 2019-09 | 2019-07 | 2019-06 | 2019-05 | 2019-04 | 2019-03 | 2019-02 | 2019-01 | 2018-12 | 2018-11 | 2018-10 | 2018-09 | 2018-08 | 2018-07 | 2018-06 | 2018-05 | 2018-04 | 2018-03 | 2018-02 | 2018-01 | 2017-12 | 2017-11 | 2017-10 | 2017-09 |
|---|---|---|---|---|---|---|---|---|---|---|---|---|---|---|---|---|---|---|---|---|---|---|---|---|---|---|---|---|---|---|---|---|
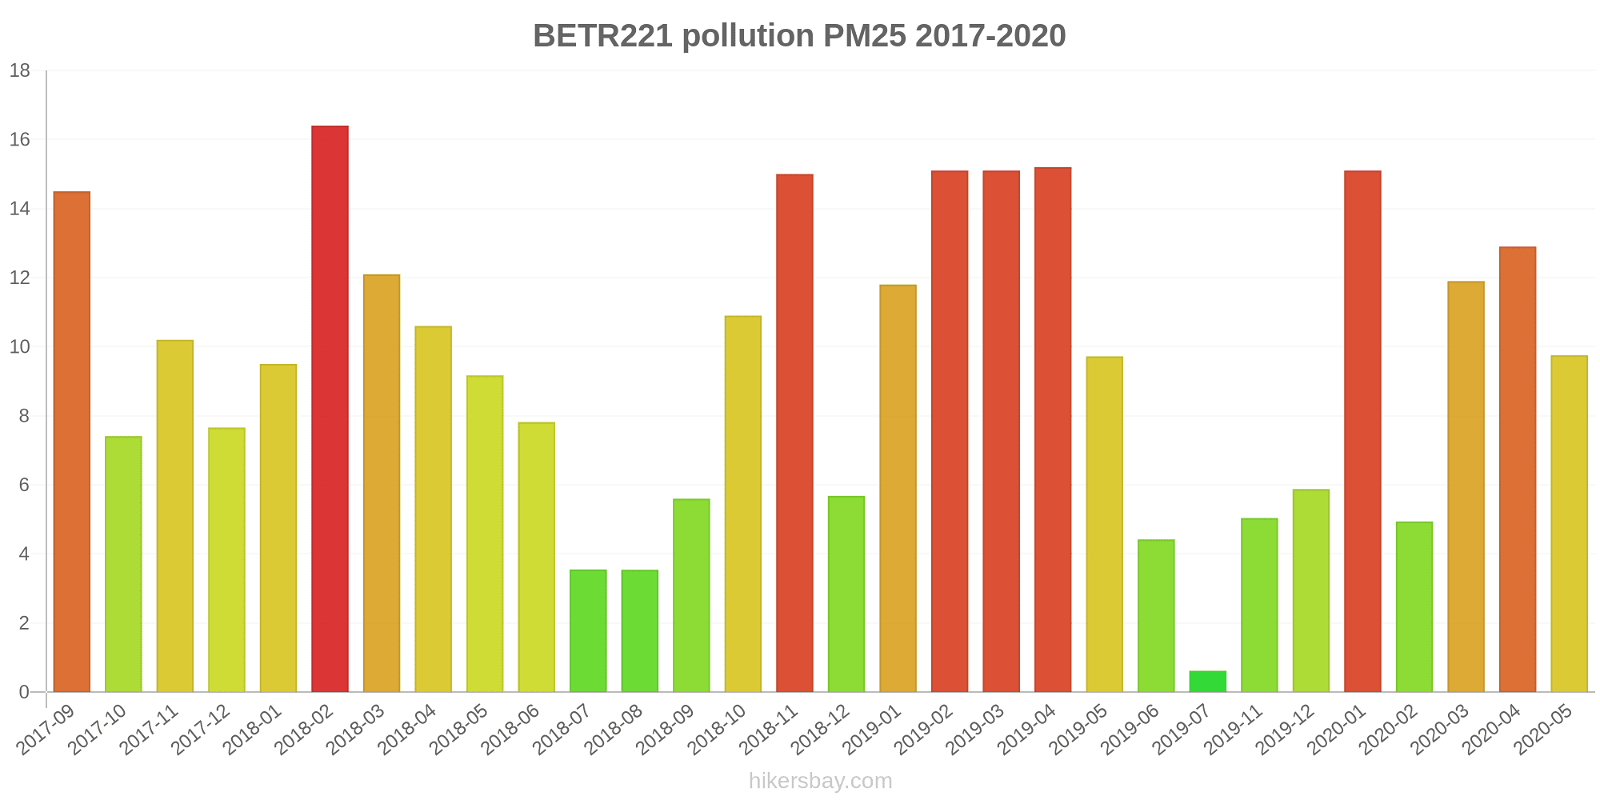
| pm25 | 9.8 | 13 | 12 | 4.9 | 15 | 5.9 | 5 | - | - | 0.62 | 4.4 | 9.7 | 15 | 15 | 15 | 12 | 5.7 | 15 | 11 | 5.6 | 3.5 | 3.5 | 7.8 | 9.2 | 11 | 12 | 16 | 9.5 | 7.7 | 10 | 7.4 | 15 |
| pm10 | 17 | 24 | 14 | 6.1 | 16 | 6.3 | 6.6 | 1.4 | - | 4.6 | 11 | 15 | 20 | 19 | 26 | 15 | 7.7 | 15 | 17 | 11 | 10 | 16 | 16 | 19 | 17 | 19 | 25 | 12 | 9.9 | 14 | 12 | 20 |
| no2 | 17 | 20 | 14 | 10 | 16 | 8.5 | 10 | 3.5 | 14 | 6.4 | 15 | 17 | 23 | 22 | 35 | 20 | 14 | 22 | 22 | 20 | 17 | 23 | 19 | 22 | 24 | 28 | 29 | 22 | 19 | 25 | 17 | 21 |
| o3 | 51 | 48 | 49 | 58 | 37 | 24 | 10 | 21 | 27 | 26 | 53 | 45 | 44 | 48 | 13 | 36 | 37 | 28 | 21 | 33 | 43 | 54 | 44 | 42 | 49 | 48 | 34 | 40 | 36 | 25 | 33 | 22 |
BETR222
| index | 2020-05 | 2020-04 | 2020-03 | 2020-02 | 2020-01 | 2019-12 | 2019-11 | 2019-10 | 2019-07 | 2019-06 | 2019-05 | 2019-04 | 2019-03 | 2019-02 | 2019-01 | 2018-12 | 2018-11 | 2018-10 | 2018-09 | 2018-08 | 2018-07 | 2018-06 | 2018-05 | 2018-04 | 2018-03 | 2018-02 | 2018-01 | 2017-12 | 2017-11 | 2017-10 | 2017-09 |
|---|---|---|---|---|---|---|---|---|---|---|---|---|---|---|---|---|---|---|---|---|---|---|---|---|---|---|---|---|---|---|---|
| pm25 | 9.4 | 14 | 12 | 5.2 | 14 | 6.5 | 5.4 | - | 0.58 | 4.1 | 11 | 15 | 15 | 16 | 10 | 6.6 | 11 | 11 | 6.2 | 3.2 | 4 | 9 | 11 | 9.2 | 12 | 17 | 8.3 | 9.8 | 10 | 9 | 13 |
| pm10 | 16 | 24 | 14 | 6.8 | 16 | 7.6 | 7.5 | 5.6 | 4.7 | 11 | 16 | 22 | 18 | 29 | 18 | 13 | 14 | 19 | 12 | 10 | 15 | 17 | 20 | 16 | 19 | 26 | 11 | 12 | 16 | 16 | 21 |
| co | 0.23 | 0.25 | 0.24 | 0.17 | 0.26 | 0.17 | 0.15 | 0.08 | 0.06 | 0.16 | 0.18 | 0.24 | 0.25 | 0.36 | 0.23 | 0.21 | 0.32 | 0.26 | 0.22 | 0.17 | 0.14 | 0.14 | 0.19 | 0.21 | 0.27 | 0.32 | 0.26 | 0.26 | 6.3 | 20 | 26 |
| so2 | 7 | 4.3 | 4.4 | 1.4 | 9.3 | 6.2 | 3.1 | 2 | 6.1 | 12 | 5.1 | 6.5 | 11 | 9.1 | 4.5 | 4.6 | 3.3 | 5.5 | 3.1 | 4.4 | 9.5 | 12 | 6.2 | 4.6 | 3.4 | 4.6 | 3.6 | 1.3 | 5.5 | 3.3 | 8.9 |
| no2 | 16 | 18 | 14 | 7.4 | 13 | 9.7 | 11 | 2 | 6.6 | 16 | 17 | 22 | 20 | 39 | 21 | 13 | 19 | 21 | 20 | 19 | 21 | 19 | 21 | 22 | 26 | 32 | 21 | 20 | 23 | 17 | 23 |
| o3 | 51 | 46 | 47 | 60 | 36 | 22 | 11 | 21 | 26 | 46 | 41 | 44 | 44 | 4.6 | 38 | 40 | 29 | 23 | 32 | 46 | 54 | 36 | 40 | 51 | 48 | 32 | 44 | 37 | 25 | 33 | 24 |
BETR223
| index | 2020-05 | 2020-04 | 2020-03 | 2020-02 | 2020-01 | 2019-12 | 2019-11 | 2019-10 | 2019-09 | 2019-07 | 2019-06 | 2019-05 | 2019-04 | 2019-03 | 2019-02 | 2019-01 | 2018-12 | 2018-11 | 2018-10 | 2018-09 | 2018-08 | 2018-07 | 2018-06 | 2018-05 | 2018-04 | 2018-03 | 2018-02 | 2018-01 | 2017-12 | 2017-11 | 2017-10 | 2017-09 |
|---|---|---|---|---|---|---|---|---|---|---|---|---|---|---|---|---|---|---|---|---|---|---|---|---|---|---|---|---|---|---|---|---|
| pm25 | 13 | 17 | 12 | 6.7 | 13 | 6.9 | 7.3 | 3.4 | 5.9 | 3 | 9.3 | 13 | 14 | 13 | 22 | 14 | 11 | 13 | 17 | 10 | 8.2 | 9.2 | 15 | 16 | 13 | 15 | 20 | 10 | 10 | 13 | 9.9 | 17 |
| pm10 | 17 | 25 | 17 | 8.4 | 20 | 8.2 | 10 | 4.9 | 8.5 | 3.5 | 13 | 16 | 20 | 21 | 34 | 18 | 19 | 16 | 25 | 15 | 13 | 17 | 22 | 25 | 21 | 20 | 25 | 15 | 13 | 15 | 11 | 19 |
| co | 0.25 | 0.29 | 0.3 | 0.22 | 0.32 | 0.19 | 0.19 | 0.07 | 0.15 | 0.07 | 0.22 | 0.23 | 0.28 | 0.29 | 0.48 | 0.27 | 0.27 | 0.36 | 0.35 | 0.24 | 0.17 | 0.17 | 0.18 | 0.24 | 0.27 | 0.3 | 0.38 | 0.28 | 0.27 | 8.9 | 23 | 30 |
| so2 | 0.83 | 1.8 | 1.1 | 1 | 1.8 | 1.4 | 0.71 | 0.42 | 1.2 | 0.48 | 0.76 | 0.47 | 2.4 | 2.1 | 1.8 | 0.94 | 1.1 | 0.69 | - | 1 | 0.55 | 1.3 | 1.1 | 1 | 1.9 | 1.6 | 1.3 | 1.4 | 1 | 1 | 1.8 | 2.5 |
| no2 | 17 | 21 | 16 | 12 | 17 | 11 | 9.5 | 3.3 | 16 | 5 | 14 | 16 | 20 | 20 | 34 | 20 | 15 | 19 | 19 | 22 | 17 | 23 | 17 | 21 | 25 | 23 | 28 | 22 | 20 | 25 | 19 | 19 |