Air Pollution in Townsville: Real-time Air Quality Index and smog alert.
Pollution and air quality forecast for Townsville. Today is Tuesday, June 16, 2026. The following air pollution values have been recorded for Townsville:- particulate matter (PM10) suspended dust - 16 (Good)
- particulate matter (PM2.5) dust - 5 (Good)
- ozone (O3) - 0 (Good)

What is the air quality in Townsville today? Is the air polluted in Townsville?. Is there smog?
What is the level of PM10 today in Townsville? (particulate matter (PM10) suspended dust)
The current level of particulate matter PM10 in Townsville is:
16 (Good)
The highest PM10 values usually occur in month: 33 (September 2019).
The lowest value of particulate matter PM10 pollution in Townsville is usually recorded in: March (11).
What is the current level of PM2.5 in Townsville? (particulate matter (PM2.5) dust)
Today's PM2.5 level is:
5 (Good)
For comparison, the highest level of PM2.5 in Townsville in the last 7 days was: 10 (Thursday, April 11, 2024) and the lowest: 3 (Monday, April 8, 2024).
The highest PM2.5 values were recorded: 11 (September 2019).
The lowest level of particulate matter PM2.5 pollution occurs in month: March (4.1).
How is the O3 level today in Townsville? (ozone (O3))
0 (Good)
Current data Monday, April 15, 2024, 5:00 PM
PM10 16 (Good)
PM2,5 5 (Good)
O3 0 (Good)
Data on air pollution from recent days in Townsville
index
2024-04-08
2024-04-09
2024-04-10
2024-04-11
2024-04-12
2024-04-13
2024-04-14
2024-04-15
pm10
8
Good
11
Good
17
Good
23
Moderate
17
Good
18
Good
17
Good
16
Good
pm25
3
Good
4
Good
7
Good
10
Good
6
Good
6
Good
5
Good
5
Good
o3
0
Good
0
Good
0
Good
0
Good
0
Good
0
Good
0
Good
0
Good
data source »
Air pollution in Townsville from April 2017 to May 2020

index
2020-05
2020-04
2020-03
2020-02
2020-01
2019-12
2019-11
2019-10
2019-09
2019-08
2019-07
2019-06
2019-05
2019-04
2019-03
2019-02
2019-01
2018-12
2018-11
2018-10
2018-09
2018-08
2018-07
2018-06
2018-05
2018-04
2018-03
2018-02
2018-01
2017-12
2017-11
2017-03
2017-02
2017-10
2017-09
2017-08
2017-07
2017-06
2017-05
2017-04
pm10
17 (Good)
16 (Good)
15 (Good)
14 (Good)
16 (Good)
18 (Good)
26 (Moderate)
22 (Moderate)
33 (Moderate)
20 (Good)
16 (Good)
15 (Good)
16 (Good)
17 (Good)
11 (Good)
17 (Good)
19 (Good)
19 (Good)
19 (Good)
13 (Good)
17 (Good)
17 (Good)
16 (Good)
18 (Good)
16 (Good)
16 (Good)
16 (Good)
13 (Good)
17 (Good)
13 (Good)
18 (Good)
11 (Good)
15 (Good)
- (Good)
- (Good)
- (Good)
- (Good)
- (Good)
- (Good)
- (Good)
pm25
5.5 (Good)
5.5 (Good)
5.2 (Good)
5.7 (Good)
6.5 (Good)
7.7 (Good)
11 (Good)
7.2 (Good)
11 (Good)
6.1 (Good)
4.5 (Good)
4.8 (Good)
4.5 (Good)
5.2 (Good)
4.1 (Good)
6.7 (Good)
6.3 (Good)
6.4 (Good)
8.7 (Good)
4.9 (Good)
6.1 (Good)
5.1 (Good)
5.4 (Good)
5 (Good)
5 (Good)
5.5 (Good)
6.2 (Good)
- (Good)
- (Good)
- (Good)
- (Good)
- (Good)
- (Good)
- (Good)
- (Good)
- (Good)
- (Good)
- (Good)
- (Good)
- (Good)
no2:ppm
- (Good)
- (Good)
- (Good)
- (Good)
- (Good)
- (Good)
- (Good)
- (Good)
- (Good)
- (Good)
- (Good)
- (Good)
- (Good)
0 (Good)
0 (Good)
0 (Good)
0 (Good)
0 (Good)
0 (Good)
0 (Good)
0 (Good)
0 (Good)
0 (Good)
0 (Good)
0 (Good)
0 (Good)
0 (Good)
- (Good)
- (Good)
- (Good)
- (Good)
- (Good)
- (Good)
- (Good)
- (Good)
- (Good)
- (Good)
- (Good)
- (Good)
- (Good)
so2:ppm
- (Good)
- (Good)
- (Good)
- (Good)
- (Good)
- (Good)
- (Good)
- (Good)
- (Good)
- (Good)
- (Good)
- (Good)
- (Good)
- (Good)
- (Good)
- (Good)
- (Good)
- (Good)
0 (Good)
0 (Good)
0 (Good)
0 (Good)
0 (Good)
0 (Good)
0 (Good)
0 (Good)
0 (Good)
0 (Good)
0 (Good)
0 (Good)
0 (Good)
0 (Good)
0 (Good)
0 (Good)
0 (Good)
0 (Good)
0 (Good)
0 (Good)
0 (Good)
0 (Good)
data source »
Quality of life in Townsville
Green and Parks in the City
Townsville
61%
East Timor: 53%
Papua New Guinea: 27%
New Caledonia: 70%
particulate matter PM2.5
Townsville
7 (Good)
Pleasure of spending time in the city
Townsville
79%
East Timor: 44%
Papua New Guinea: 34%
particulate matter PM10
Townsville
17 (Good)
Air Pollution
Townsville
12%
East Timor: 36%
Papua New Guinea: 63%
New Caledonia: 55%
Garbage Disposal
Townsville
60%
East Timor: 19%
Papua New Guinea: 18%
New Caledonia: 30%
Availability and quality of drinking water
Townsville
79%
East Timor: 38%
Papua New Guinea: 38%
New Caledonia: 75%
Cleanliness and tidiness
Townsville
56%
East Timor: 25%
Papua New Guinea: 22%
New Caledonia: 30%
Noise and Light pollution
Townsville
32%
East Timor: 53%
Papua New Guinea: 58%
New Caledonia: 45%
Water Pollution
Townsville
39%
East Timor: 64%
Papua New Guinea: 76%
New Caledonia: 55%
Source: Numbeo
Coastguard
Monday, April 15, 2024, 5:00 PM
PM10 18 (Good)
particulate matter (PM10) suspended dust
Environment Park
Monday, April 15, 2024, 5:00 PM
PM10 16 (Good)
particulate matter (PM10) suspended dust
Lennon Drive
Monday, April 15, 2024, 5:00 PM
PM10 18 (Good)
particulate matter (PM10) suspended dust
North Ward
Monday, April 15, 2024, 5:00 PM
PM10 18 (Good)
particulate matter (PM10) suspended dust
PM2,5 5.5 (Good)
particulate matter (PM2.5) dust
Stuart
Monday, April 15, 2024, 5:00 PM
PM2,5 3.6 (Good)
particulate matter (PM2.5) dust
PM10 11 (Good)
particulate matter (PM10) suspended dust
O3 0.05 (Good)
ozone (O3)
Coastguard
index
2024-04-15
2024-04-14
2024-04-13
2024-04-12
2024-04-11
2024-04-10
2024-04-09
2024-04-08
pm10
18
19
18
17
19
16
9.5
7.1
Environment Park
index
2024-04-15
2024-04-14
2024-04-13
2024-04-12
2024-04-11
2024-04-10
2024-04-09
2024-04-08
pm10
17
17
15
15
18
14
9.6
10
Lennon Drive
index
2024-04-15
2024-04-14
2024-04-13
2024-04-12
2024-04-11
2024-04-10
2024-04-09
2024-04-08
pm10
18
18
19
18
19
16
9.6
7.5
North Ward
index
2024-04-15
2024-04-14
2024-04-13
2024-04-12
2024-04-11
2024-04-10
2024-04-09
2024-04-08
pm10
18
19
18
17
20
18
10
7.5
pm25
5.6
6.3
5.7
5.1
8
6.3
4
2.9
Stuart
index
2024-04-15
2024-04-14
2024-04-13
2024-04-12
2024-04-11
2024-04-10
2024-04-09
2024-04-08
pm10
12
12
17
19
36
18
15
8.8
pm25
4
4.1
5.8
7.3
13
7.5
4.5
3
o3
0.04
0.04
0.05
0.04
0.04
0.05
0.05
0.05
Coastguard
index
2020-05
2020-04
2020-03
2020-02
2020-01
2019-12
2019-11
2019-10
2019-09
2019-08
2019-07
2019-06
2019-05
2019-04
2019-03
2019-02
2019-01
2018-12
2018-11
2018-10
2018-09
2018-08
2018-07
2018-06
2018-05
2018-04
2018-03
2018-02
2018-01
2017-12
2017-11
2017-03
2017-02
pm10
16
15
15
14
16
19
27
21
34
21
17
16
17
16
11
4
20
18
19
11
16
18
17
18
17
17
16
13
17
13
18
11
15
Lennon Drive
index
2020-05
2020-04
2020-03
2020-02
2020-01
2019-12
2019-11
2019-10
2019-09
2019-08
2019-07
2019-06
2019-05
2019-04
2019-03
2019-02
2019-01
2018-12
2018-11
2018-10
2018-09
2018-08
2018-07
2018-06
pm10
18
17
15
13
15
17
22
22
33
21
19
16
17
18
12
23
21
23
20
13
19
18
19
23
North Ward
2018-03 2020-05

index
2020-05
2020-04
2020-03
2020-02
2020-01
2019-12
2019-11
2019-10
2019-09
2019-08
2019-07
2019-06
2019-05
2019-04
2019-03
2019-02
2019-01
2018-12
2018-11
2018-10
2018-09
2018-08
2018-07
2018-06
2018-05
2018-04
2018-03
no2:ppm
-
-
-
-
-
-
-
-
-
-
-
-
-
0
0
0
0
0
0
0
0
0
0
0
0
0
0
so2:ppm
-
-
-
-
-
-
-
-
-
-
-
-
-
-
-
-
-
-
-
0
0
0
-
0
0
0
0
pm10
16
16
15
16
17
19
29
23
30
18
13
14
14
16
11
23
17
16
19
14
16
15
13
14
14
15
15
pm25
5.5
5.5
5.2
5.7
6.5
7.7
11
7.2
11
6.1
4.5
4.8
4.5
5.2
4.1
6.7
6.3
6.4
8.7
4.9
6.1
5.1
5.4
5
5
5.5
6.2
Stuart
index
2018-11
2018-10
2018-09
2018-08
2018-07
2018-06
2018-05
2018-03
2018-02
2018-01
2017-12
2017-11
2017-10
2017-09
2017-08
2017-07
2017-06
2017-05
2017-04
2017-03
2017-02
so2:ppm
0
0
0
0
0
0
0
0
0
0
0
0
0
0
0
0
0
0
0
0
0
* Pollution data source:
https://openaq.org
(Australia - Queensland, AirNow)
The data is licensed under CC-By 4.0
PM10 16 (Good)
PM2,5 5 (Good)
O3 0 (Good)
Data on air pollution from recent days in Townsville
| index | 2024-04-08 | 2024-04-09 | 2024-04-10 | 2024-04-11 | 2024-04-12 | 2024-04-13 | 2024-04-14 | 2024-04-15 |
|---|---|---|---|---|---|---|---|---|
| pm10 | 8 Good |
11 Good |
17 Good |
23 Moderate |
17 Good |
18 Good |
17 Good |
16 Good |
| pm25 | 3 Good |
4 Good |
7 Good |
10 Good |
6 Good |
6 Good |
5 Good |
5 Good |
| o3 | 0 Good |
0 Good |
0 Good |
0 Good |
0 Good |
0 Good |
0 Good |
0 Good |

| index | 2020-05 | 2020-04 | 2020-03 | 2020-02 | 2020-01 | 2019-12 | 2019-11 | 2019-10 | 2019-09 | 2019-08 | 2019-07 | 2019-06 | 2019-05 | 2019-04 | 2019-03 | 2019-02 | 2019-01 | 2018-12 | 2018-11 | 2018-10 | 2018-09 | 2018-08 | 2018-07 | 2018-06 | 2018-05 | 2018-04 | 2018-03 | 2018-02 | 2018-01 | 2017-12 | 2017-11 | 2017-03 | 2017-02 | 2017-10 | 2017-09 | 2017-08 | 2017-07 | 2017-06 | 2017-05 | 2017-04 |
|---|---|---|---|---|---|---|---|---|---|---|---|---|---|---|---|---|---|---|---|---|---|---|---|---|---|---|---|---|---|---|---|---|---|---|---|---|---|---|---|---|
| pm10 | 17 (Good) | 16 (Good) | 15 (Good) | 14 (Good) | 16 (Good) | 18 (Good) | 26 (Moderate) | 22 (Moderate) | 33 (Moderate) | 20 (Good) | 16 (Good) | 15 (Good) | 16 (Good) | 17 (Good) | 11 (Good) | 17 (Good) | 19 (Good) | 19 (Good) | 19 (Good) | 13 (Good) | 17 (Good) | 17 (Good) | 16 (Good) | 18 (Good) | 16 (Good) | 16 (Good) | 16 (Good) | 13 (Good) | 17 (Good) | 13 (Good) | 18 (Good) | 11 (Good) | 15 (Good) | - (Good) | - (Good) | - (Good) | - (Good) | - (Good) | - (Good) | - (Good) |
| pm25 | 5.5 (Good) | 5.5 (Good) | 5.2 (Good) | 5.7 (Good) | 6.5 (Good) | 7.7 (Good) | 11 (Good) | 7.2 (Good) | 11 (Good) | 6.1 (Good) | 4.5 (Good) | 4.8 (Good) | 4.5 (Good) | 5.2 (Good) | 4.1 (Good) | 6.7 (Good) | 6.3 (Good) | 6.4 (Good) | 8.7 (Good) | 4.9 (Good) | 6.1 (Good) | 5.1 (Good) | 5.4 (Good) | 5 (Good) | 5 (Good) | 5.5 (Good) | 6.2 (Good) | - (Good) | - (Good) | - (Good) | - (Good) | - (Good) | - (Good) | - (Good) | - (Good) | - (Good) | - (Good) | - (Good) | - (Good) | - (Good) |
| no2:ppm | - (Good) | - (Good) | - (Good) | - (Good) | - (Good) | - (Good) | - (Good) | - (Good) | - (Good) | - (Good) | - (Good) | - (Good) | - (Good) | 0 (Good) | 0 (Good) | 0 (Good) | 0 (Good) | 0 (Good) | 0 (Good) | 0 (Good) | 0 (Good) | 0 (Good) | 0 (Good) | 0 (Good) | 0 (Good) | 0 (Good) | 0 (Good) | - (Good) | - (Good) | - (Good) | - (Good) | - (Good) | - (Good) | - (Good) | - (Good) | - (Good) | - (Good) | - (Good) | - (Good) | - (Good) |
| so2:ppm | - (Good) | - (Good) | - (Good) | - (Good) | - (Good) | - (Good) | - (Good) | - (Good) | - (Good) | - (Good) | - (Good) | - (Good) | - (Good) | - (Good) | - (Good) | - (Good) | - (Good) | - (Good) | 0 (Good) | 0 (Good) | 0 (Good) | 0 (Good) | 0 (Good) | 0 (Good) | 0 (Good) | 0 (Good) | 0 (Good) | 0 (Good) | 0 (Good) | 0 (Good) | 0 (Good) | 0 (Good) | 0 (Good) | 0 (Good) | 0 (Good) | 0 (Good) | 0 (Good) | 0 (Good) | 0 (Good) | 0 (Good) |
Green and Parks in the City
Townsville 61%
East Timor: 53% Papua New Guinea: 27% New Caledonia: 70%particulate matter PM2.5
Townsville 7 (Good)
Pleasure of spending time in the city
Townsville 79%
East Timor: 44% Papua New Guinea: 34%particulate matter PM10
Townsville 17 (Good)
Air Pollution
Townsville 12%
East Timor: 36% Papua New Guinea: 63% New Caledonia: 55%Garbage Disposal
Townsville 60%
East Timor: 19% Papua New Guinea: 18% New Caledonia: 30%Availability and quality of drinking water
Townsville 79%
East Timor: 38% Papua New Guinea: 38% New Caledonia: 75%Cleanliness and tidiness
Townsville 56%
East Timor: 25% Papua New Guinea: 22% New Caledonia: 30%Noise and Light pollution
Townsville 32%
East Timor: 53% Papua New Guinea: 58% New Caledonia: 45%Water Pollution
Townsville 39%
East Timor: 64% Papua New Guinea: 76% New Caledonia: 55%PM10 18 (Good)
particulate matter (PM10) suspended dustPM10 16 (Good)
particulate matter (PM10) suspended dustPM10 18 (Good)
particulate matter (PM10) suspended dustPM10 18 (Good)
particulate matter (PM10) suspended dustPM2,5 5.5 (Good)
particulate matter (PM2.5) dustPM2,5 3.6 (Good)
particulate matter (PM2.5) dustPM10 11 (Good)
particulate matter (PM10) suspended dustO3 0.05 (Good)
ozone (O3)Coastguard
| index | 2024-04-15 | 2024-04-14 | 2024-04-13 | 2024-04-12 | 2024-04-11 | 2024-04-10 | 2024-04-09 | 2024-04-08 |
|---|---|---|---|---|---|---|---|---|
| pm10 | 18 | 19 | 18 | 17 | 19 | 16 | 9.5 | 7.1 |
Environment Park
| index | 2024-04-15 | 2024-04-14 | 2024-04-13 | 2024-04-12 | 2024-04-11 | 2024-04-10 | 2024-04-09 | 2024-04-08 |
|---|---|---|---|---|---|---|---|---|
| pm10 | 17 | 17 | 15 | 15 | 18 | 14 | 9.6 | 10 |
Lennon Drive
| index | 2024-04-15 | 2024-04-14 | 2024-04-13 | 2024-04-12 | 2024-04-11 | 2024-04-10 | 2024-04-09 | 2024-04-08 |
|---|---|---|---|---|---|---|---|---|
| pm10 | 18 | 18 | 19 | 18 | 19 | 16 | 9.6 | 7.5 |
North Ward
| index | 2024-04-15 | 2024-04-14 | 2024-04-13 | 2024-04-12 | 2024-04-11 | 2024-04-10 | 2024-04-09 | 2024-04-08 |
|---|---|---|---|---|---|---|---|---|
| pm10 | 18 | 19 | 18 | 17 | 20 | 18 | 10 | 7.5 |
| pm25 | 5.6 | 6.3 | 5.7 | 5.1 | 8 | 6.3 | 4 | 2.9 |
Stuart
| index | 2024-04-15 | 2024-04-14 | 2024-04-13 | 2024-04-12 | 2024-04-11 | 2024-04-10 | 2024-04-09 | 2024-04-08 |
|---|---|---|---|---|---|---|---|---|
| pm10 | 12 | 12 | 17 | 19 | 36 | 18 | 15 | 8.8 |
| pm25 | 4 | 4.1 | 5.8 | 7.3 | 13 | 7.5 | 4.5 | 3 |
| o3 | 0.04 | 0.04 | 0.05 | 0.04 | 0.04 | 0.05 | 0.05 | 0.05 |
Coastguard
| index | 2020-05 | 2020-04 | 2020-03 | 2020-02 | 2020-01 | 2019-12 | 2019-11 | 2019-10 | 2019-09 | 2019-08 | 2019-07 | 2019-06 | 2019-05 | 2019-04 | 2019-03 | 2019-02 | 2019-01 | 2018-12 | 2018-11 | 2018-10 | 2018-09 | 2018-08 | 2018-07 | 2018-06 | 2018-05 | 2018-04 | 2018-03 | 2018-02 | 2018-01 | 2017-12 | 2017-11 | 2017-03 | 2017-02 |
|---|---|---|---|---|---|---|---|---|---|---|---|---|---|---|---|---|---|---|---|---|---|---|---|---|---|---|---|---|---|---|---|---|---|
| pm10 | 16 | 15 | 15 | 14 | 16 | 19 | 27 | 21 | 34 | 21 | 17 | 16 | 17 | 16 | 11 | 4 | 20 | 18 | 19 | 11 | 16 | 18 | 17 | 18 | 17 | 17 | 16 | 13 | 17 | 13 | 18 | 11 | 15 |
Lennon Drive
| index | 2020-05 | 2020-04 | 2020-03 | 2020-02 | 2020-01 | 2019-12 | 2019-11 | 2019-10 | 2019-09 | 2019-08 | 2019-07 | 2019-06 | 2019-05 | 2019-04 | 2019-03 | 2019-02 | 2019-01 | 2018-12 | 2018-11 | 2018-10 | 2018-09 | 2018-08 | 2018-07 | 2018-06 |
|---|---|---|---|---|---|---|---|---|---|---|---|---|---|---|---|---|---|---|---|---|---|---|---|---|
| pm10 | 18 | 17 | 15 | 13 | 15 | 17 | 22 | 22 | 33 | 21 | 19 | 16 | 17 | 18 | 12 | 23 | 21 | 23 | 20 | 13 | 19 | 18 | 19 | 23 |
North Ward
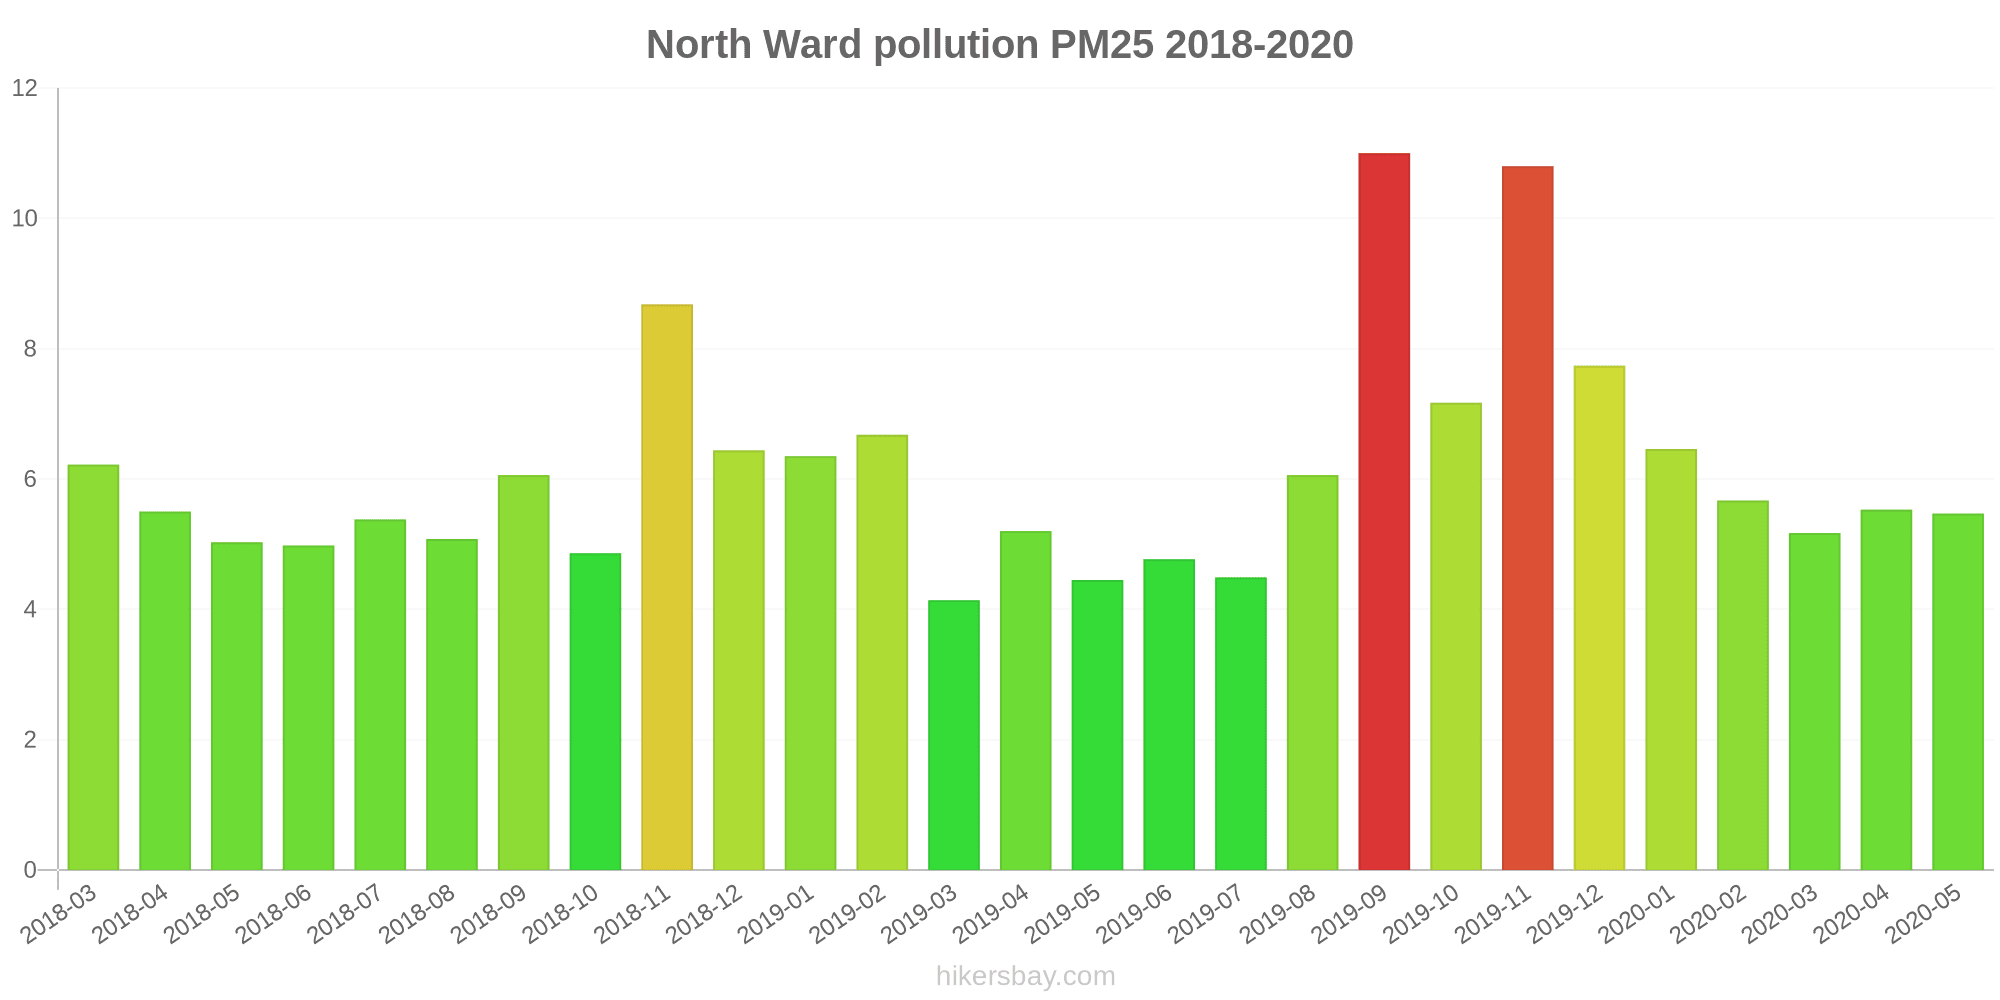
| index | 2020-05 | 2020-04 | 2020-03 | 2020-02 | 2020-01 | 2019-12 | 2019-11 | 2019-10 | 2019-09 | 2019-08 | 2019-07 | 2019-06 | 2019-05 | 2019-04 | 2019-03 | 2019-02 | 2019-01 | 2018-12 | 2018-11 | 2018-10 | 2018-09 | 2018-08 | 2018-07 | 2018-06 | 2018-05 | 2018-04 | 2018-03 |
|---|---|---|---|---|---|---|---|---|---|---|---|---|---|---|---|---|---|---|---|---|---|---|---|---|---|---|---|
| no2:ppm | - | - | - | - | - | - | - | - | - | - | - | - | - | 0 | 0 | 0 | 0 | 0 | 0 | 0 | 0 | 0 | 0 | 0 | 0 | 0 | 0 |
| so2:ppm | - | - | - | - | - | - | - | - | - | - | - | - | - | - | - | - | - | - | - | 0 | 0 | 0 | - | 0 | 0 | 0 | 0 |
| pm10 | 16 | 16 | 15 | 16 | 17 | 19 | 29 | 23 | 30 | 18 | 13 | 14 | 14 | 16 | 11 | 23 | 17 | 16 | 19 | 14 | 16 | 15 | 13 | 14 | 14 | 15 | 15 |
| pm25 | 5.5 | 5.5 | 5.2 | 5.7 | 6.5 | 7.7 | 11 | 7.2 | 11 | 6.1 | 4.5 | 4.8 | 4.5 | 5.2 | 4.1 | 6.7 | 6.3 | 6.4 | 8.7 | 4.9 | 6.1 | 5.1 | 5.4 | 5 | 5 | 5.5 | 6.2 |
Stuart
| index | 2018-11 | 2018-10 | 2018-09 | 2018-08 | 2018-07 | 2018-06 | 2018-05 | 2018-03 | 2018-02 | 2018-01 | 2017-12 | 2017-11 | 2017-10 | 2017-09 | 2017-08 | 2017-07 | 2017-06 | 2017-05 | 2017-04 | 2017-03 | 2017-02 |
|---|---|---|---|---|---|---|---|---|---|---|---|---|---|---|---|---|---|---|---|---|---|
| so2:ppm | 0 | 0 | 0 | 0 | 0 | 0 | 0 | 0 | 0 | 0 | 0 | 0 | 0 | 0 | 0 | 0 | 0 | 0 | 0 | 0 | 0 |