Luftverschmutzung in Shāhpur: Echtzeit-Luft-Qualitätsindex und Smog-Alarm.
Für die Shāhpur. Heute ist Samstag, 4. April 2026. Für Shāhpur wurden folgende Luftverschmutzungswerte gemessen:- Stickstoffdioxid (NO2) - 4 (gut)
- Schwefeldioxid (SO2) - 5 (gut)
- Kohlenmonoxid (CO) - 1060 (gut)
- Feinstaub (PM2,5) - 70 (ungesund)
- Feinstaub (PM10) Schwebestaub - 62 (Ungesund für sensible Gruppen)

Wie ist die Luftqualität Shāhpur heute? Ist die Luft in Shāhpur? verschmutzt. Gibt es Smog?
Wie hoch ist das NO2-Niveau? (Stickstoffdioxid (NO2))
4 (gut)
Wie hoch ist die SO2-Belastung? (Schwefeldioxid (SO2))
5 (gut)
Wie hoch ist der CO-Gehalt? (Kohlenmonoxid (CO))
1060 (gut)
Wie hoch ist der aktuelle PM2,5-Wert in Shāhpur? (Feinstaub (PM2,5))
Die heutige PM2.5-Stufe ist:
70 (ungesund)
Zum Vergleich: Der höchste PM2,5-Wert in Shāhpur in den letzten 7 Tagen war: 73 (Montag, 31. Oktober 2022) und der niedrigste: 73 (Montag, 31. Oktober 2022).
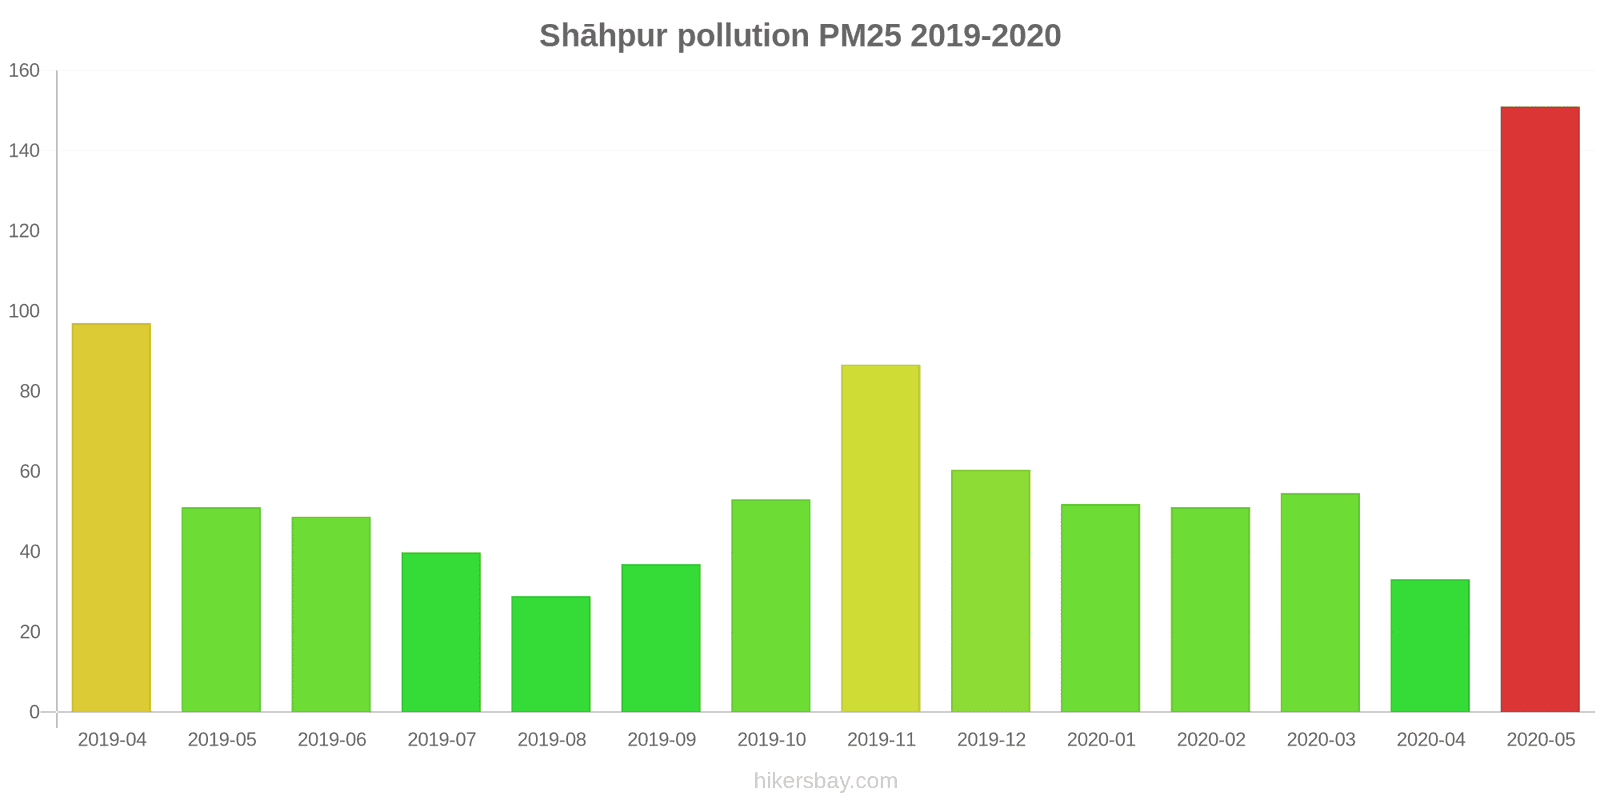
Die höchsten PM2,5-Werte wurden gemessen: 151 (Mai 2020).
Die niedrigste Feinstaubbelastung PM2,5 tritt im Monat auf: August (29).
Wie hoch ist der PM10-Stand heute in Shāhpur? (Feinstaub (PM10) Schwebestaub)
Der aktuelle Feinstaubgehalt PM10 in Shāhpur is:
62 (Ungesund für sensible Gruppen)
Die höchsten PM10-Werte treten in der Regel im Monat auf: 173 (April 2019).
Der niedrigste Wert der Feinstaub-PM10-Belastung in Shāhpur ist in der Regel in: April (51).
Aktuelle Daten Montag, 31. Oktober 2022, 01:45
NO2 4 (gut)
SO2 5 (gut)
CO 1060 (gut)
PM2,5 70 (ungesund)
PM10 62 (Ungesund für sensible Gruppen)
Daten zur Luftverschmutzung der letzten Tage in Shāhpur
index
2022-10-31
no2
4
Good
so2
5
Good
co
1225
Good
pm25
73
Unhealthy
pm10
73
Unhealthy for Sensitive Groups
data source »
Luftverschmutzung in Shāhpur von April 2019 bis Mai 2020
index
2020-05
2020-04
2020-03
2020-02
2020-01
2019-12
2019-11
2019-10
2019-09
2019-08
2019-07
2019-06
2019-05
2019-04
pm25
151 (Very bad Hazardous)
33 (Moderate)
55 (Unhealthy for Sensitive Groups)
51 (Unhealthy for Sensitive Groups)
52 (Unhealthy for Sensitive Groups)
60 (Unhealthy)
87 (Very Unhealthy)
53 (Unhealthy for Sensitive Groups)
37 (Unhealthy for Sensitive Groups)
29 (Moderate)
40 (Unhealthy for Sensitive Groups)
49 (Unhealthy for Sensitive Groups)
51 (Unhealthy for Sensitive Groups)
97 (Very Unhealthy)
pm10
78 (Unhealthy for Sensitive Groups)
51 (Unhealthy for Sensitive Groups)
83 (Unhealthy)
109 (Unhealthy)
100 (Unhealthy)
106 (Unhealthy)
158 (Very bad Hazardous)
97 (Unhealthy)
80 (Unhealthy for Sensitive Groups)
63 (Unhealthy for Sensitive Groups)
72 (Unhealthy for Sensitive Groups)
108 (Unhealthy)
75 (Unhealthy for Sensitive Groups)
173 (Very bad Hazardous)
no2
7.3 (Good)
9.7 (Good)
9 (Good)
4.1 (Good)
5 (Good)
5.2 (Good)
3.6 (Good)
6.4 (Good)
8.5 (Good)
11 (Good)
6.3 (Good)
1.1 (Good)
8.1 (Good)
8 (Good)
so2
8.2 (Good)
8.3 (Good)
8.2 (Good)
10 (Good)
10 (Good)
9.8 (Good)
9.8 (Good)
9.5 (Good)
8.3 (Good)
7.8 (Good)
5 (Good)
6.6 (Good)
8 (Good)
8.6 (Good)
co
386 (Good)
359 (Good)
347 (Good)
232 (Good)
229 (Good)
219 (Good)
226 (Good)
227 (Good)
238 (Good)
153 (Good)
184 (Good)
201 (Good)
236 (Good)
217 (Good)
data source »
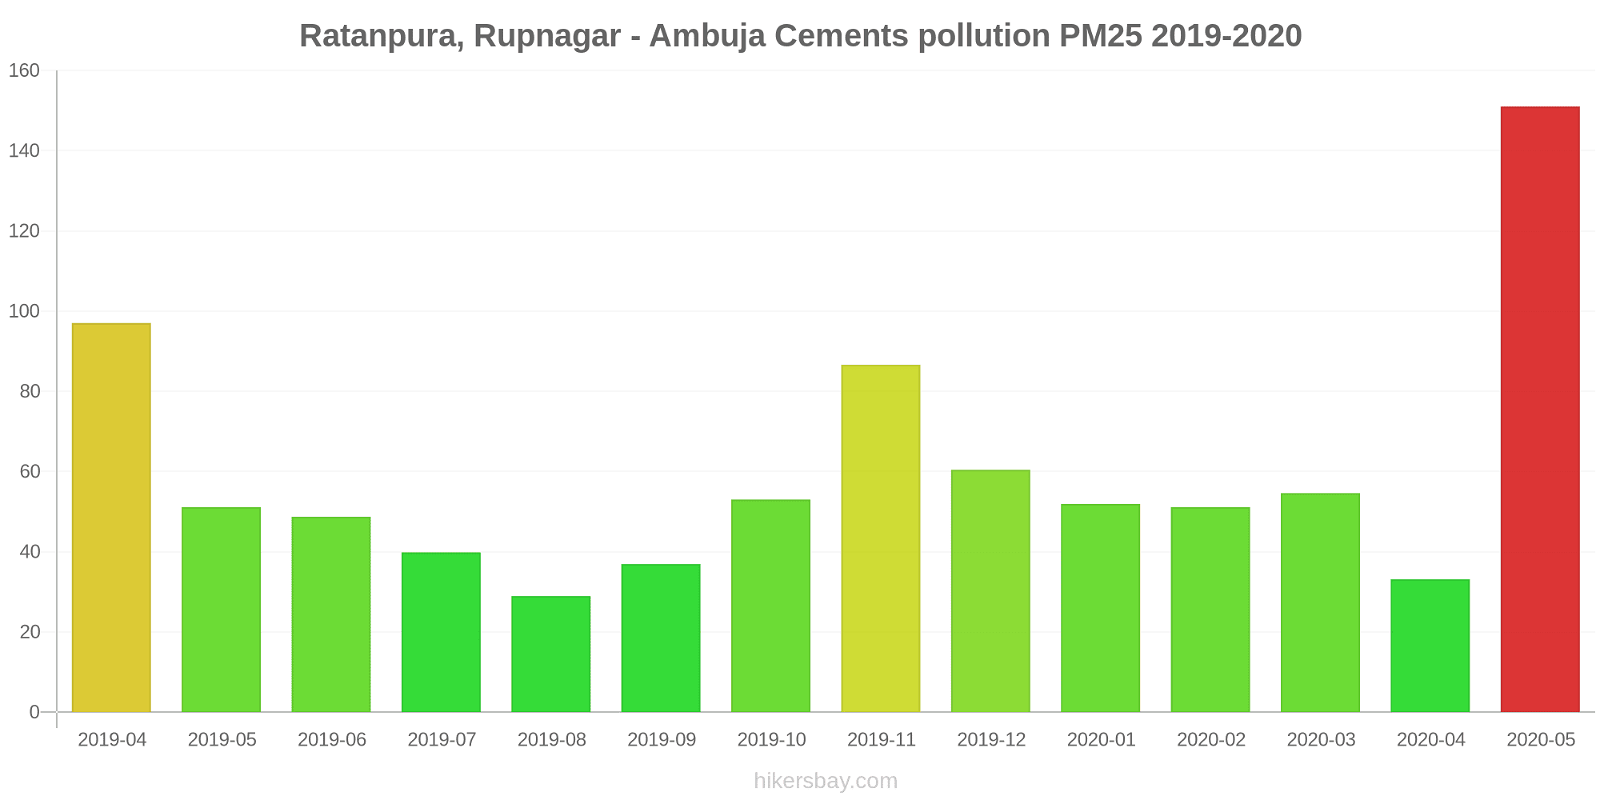
Ratanpura, Rupnagar - Ambuja Cements
Montag, 31. Oktober 2022, 01:45
NO2 3.8 (gut)
Stickstoffdioxid (NO2)
SO2 4.7 (gut)
Schwefeldioxid (SO2)
CO 1060 (gut)
Kohlenmonoxid (CO)
PM2,5 70 (ungesund)
Feinstaub (PM2,5)
PM10 62 (Ungesund für sensible Gruppen)
Feinstaub (PM10) Schwebestaub
Ratanpura, Rupnagar - Ambuja Cements
index
2022-10-31
no2
4.5
so2
4.7
co
1225
pm25
73
pm10
73
Ratanpura, Rupnagar - Ambuja Cements
2019-04 2020-05
index
2020-05
2020-04
2020-03
2020-02
2020-01
2019-12
2019-11
2019-10
2019-09
2019-08
2019-07
2019-06
2019-05
2019-04
pm25
151
33
55
51
52
60
87
53
37
29
40
49
51
97
pm10
78
51
83
109
100
106
158
97
80
63
72
108
75
173
no2
7.3
9.7
9
4.1
5
5.2
3.6
6.4
8.5
11
6.3
1.1
8.1
8
so2
8.2
8.3
8.2
10
10
9.8
9.8
9.5
8.3
7.8
5
6.6
8
8.6
co
386
359
347
232
229
219
226
227
238
153
184
201
236
217
* Pollution data source:
https://openaq.org
(caaqm)
The data is licensed under CC-By 4.0
NO2 4 (gut)
SO2 5 (gut)
CO 1060 (gut)
PM2,5 70 (ungesund)
PM10 62 (Ungesund für sensible Gruppen)
Daten zur Luftverschmutzung der letzten Tage in Shāhpur
| index | 2022-10-31 |
|---|---|
| no2 | 4 Good |
| so2 | 5 Good |
| co | 1225 Good |
| pm25 | 73 Unhealthy |
| pm10 | 73 Unhealthy for Sensitive Groups |

| index | 2020-05 | 2020-04 | 2020-03 | 2020-02 | 2020-01 | 2019-12 | 2019-11 | 2019-10 | 2019-09 | 2019-08 | 2019-07 | 2019-06 | 2019-05 | 2019-04 |
|---|---|---|---|---|---|---|---|---|---|---|---|---|---|---|
| pm25 | 151 (Very bad Hazardous) | 33 (Moderate) | 55 (Unhealthy for Sensitive Groups) | 51 (Unhealthy for Sensitive Groups) | 52 (Unhealthy for Sensitive Groups) | 60 (Unhealthy) | 87 (Very Unhealthy) | 53 (Unhealthy for Sensitive Groups) | 37 (Unhealthy for Sensitive Groups) | 29 (Moderate) | 40 (Unhealthy for Sensitive Groups) | 49 (Unhealthy for Sensitive Groups) | 51 (Unhealthy for Sensitive Groups) | 97 (Very Unhealthy) |
| pm10 | 78 (Unhealthy for Sensitive Groups) | 51 (Unhealthy for Sensitive Groups) | 83 (Unhealthy) | 109 (Unhealthy) | 100 (Unhealthy) | 106 (Unhealthy) | 158 (Very bad Hazardous) | 97 (Unhealthy) | 80 (Unhealthy for Sensitive Groups) | 63 (Unhealthy for Sensitive Groups) | 72 (Unhealthy for Sensitive Groups) | 108 (Unhealthy) | 75 (Unhealthy for Sensitive Groups) | 173 (Very bad Hazardous) |
| no2 | 7.3 (Good) | 9.7 (Good) | 9 (Good) | 4.1 (Good) | 5 (Good) | 5.2 (Good) | 3.6 (Good) | 6.4 (Good) | 8.5 (Good) | 11 (Good) | 6.3 (Good) | 1.1 (Good) | 8.1 (Good) | 8 (Good) |
| so2 | 8.2 (Good) | 8.3 (Good) | 8.2 (Good) | 10 (Good) | 10 (Good) | 9.8 (Good) | 9.8 (Good) | 9.5 (Good) | 8.3 (Good) | 7.8 (Good) | 5 (Good) | 6.6 (Good) | 8 (Good) | 8.6 (Good) |
| co | 386 (Good) | 359 (Good) | 347 (Good) | 232 (Good) | 229 (Good) | 219 (Good) | 226 (Good) | 227 (Good) | 238 (Good) | 153 (Good) | 184 (Good) | 201 (Good) | 236 (Good) | 217 (Good) |
NO2 3.8 (gut)
Stickstoffdioxid (NO2)SO2 4.7 (gut)
Schwefeldioxid (SO2)CO 1060 (gut)
Kohlenmonoxid (CO)PM2,5 70 (ungesund)
Feinstaub (PM2,5)PM10 62 (Ungesund für sensible Gruppen)
Feinstaub (PM10) SchwebestaubRatanpura, Rupnagar - Ambuja Cements
| index | 2022-10-31 |
|---|---|
| no2 | 4.5 |
| so2 | 4.7 |
| co | 1225 |
| pm25 | 73 |
| pm10 | 73 |
Ratanpura, Rupnagar - Ambuja Cements

| index | 2020-05 | 2020-04 | 2020-03 | 2020-02 | 2020-01 | 2019-12 | 2019-11 | 2019-10 | 2019-09 | 2019-08 | 2019-07 | 2019-06 | 2019-05 | 2019-04 |
|---|---|---|---|---|---|---|---|---|---|---|---|---|---|---|
| pm25 | 151 | 33 | 55 | 51 | 52 | 60 | 87 | 53 | 37 | 29 | 40 | 49 | 51 | 97 |
| pm10 | 78 | 51 | 83 | 109 | 100 | 106 | 158 | 97 | 80 | 63 | 72 | 108 | 75 | 173 |
| no2 | 7.3 | 9.7 | 9 | 4.1 | 5 | 5.2 | 3.6 | 6.4 | 8.5 | 11 | 6.3 | 1.1 | 8.1 | 8 |
| so2 | 8.2 | 8.3 | 8.2 | 10 | 10 | 9.8 | 9.8 | 9.5 | 8.3 | 7.8 | 5 | 6.6 | 8 | 8.6 |
| co | 386 | 359 | 347 | 232 | 229 | 219 | 226 | 227 | 238 | 153 | 184 | 201 | 236 | 217 |