Luftverschmutzung in Wulou: Echtzeit-Luft-Qualitätsindex und Smog-Alarm.
Für die Wulou. Heute ist Montag, 6. April 2026. Für Wulou wurden folgende Luftverschmutzungswerte gemessen:- Feinstaub (PM10) Schwebestaub - 53 (Ungesund für sensible Gruppen)
- Ozon (O3) - 0 (gut)
- Feinstaub (PM2,5) - 7 (gut)
- Schwefeldioxid (SO2) - 18 (gut)
- Stickstoffdioxid (NO2) - 3 (gut)
- Kohlenmonoxid (CO) - 1 (gut)

Wie ist die Luftqualität Wulou heute? Ist die Luft in Wulou? verschmutzt. Gibt es Smog?
Wie hoch ist der PM10-Stand heute in Wulou? (Feinstaub (PM10) Schwebestaub)
Der aktuelle Feinstaubgehalt PM10 in Wulou is:
53 (Ungesund für sensible Gruppen)
Die höchsten PM10-Werte treten in der Regel im Monat auf: 186 (Januar 2019).
Der niedrigste Wert der Feinstaub-PM10-Belastung in Wulou ist in der Regel in: August (51).
Wie ist das O3-Niveau heute in Wulou? (Ozon (O3))
0 (gut)
Wie hoch ist der aktuelle PM2,5-Wert in Wulou? (Feinstaub (PM2,5))
Die heutige PM2.5-Stufe ist:
7 (gut)
Zum Vergleich: Der höchste PM2,5-Wert in Wulou in den letzten 7 Tagen war: 21 (Freitag, 27. Mai 2022) und der niedrigste: 21 (Freitag, 27. Mai 2022).
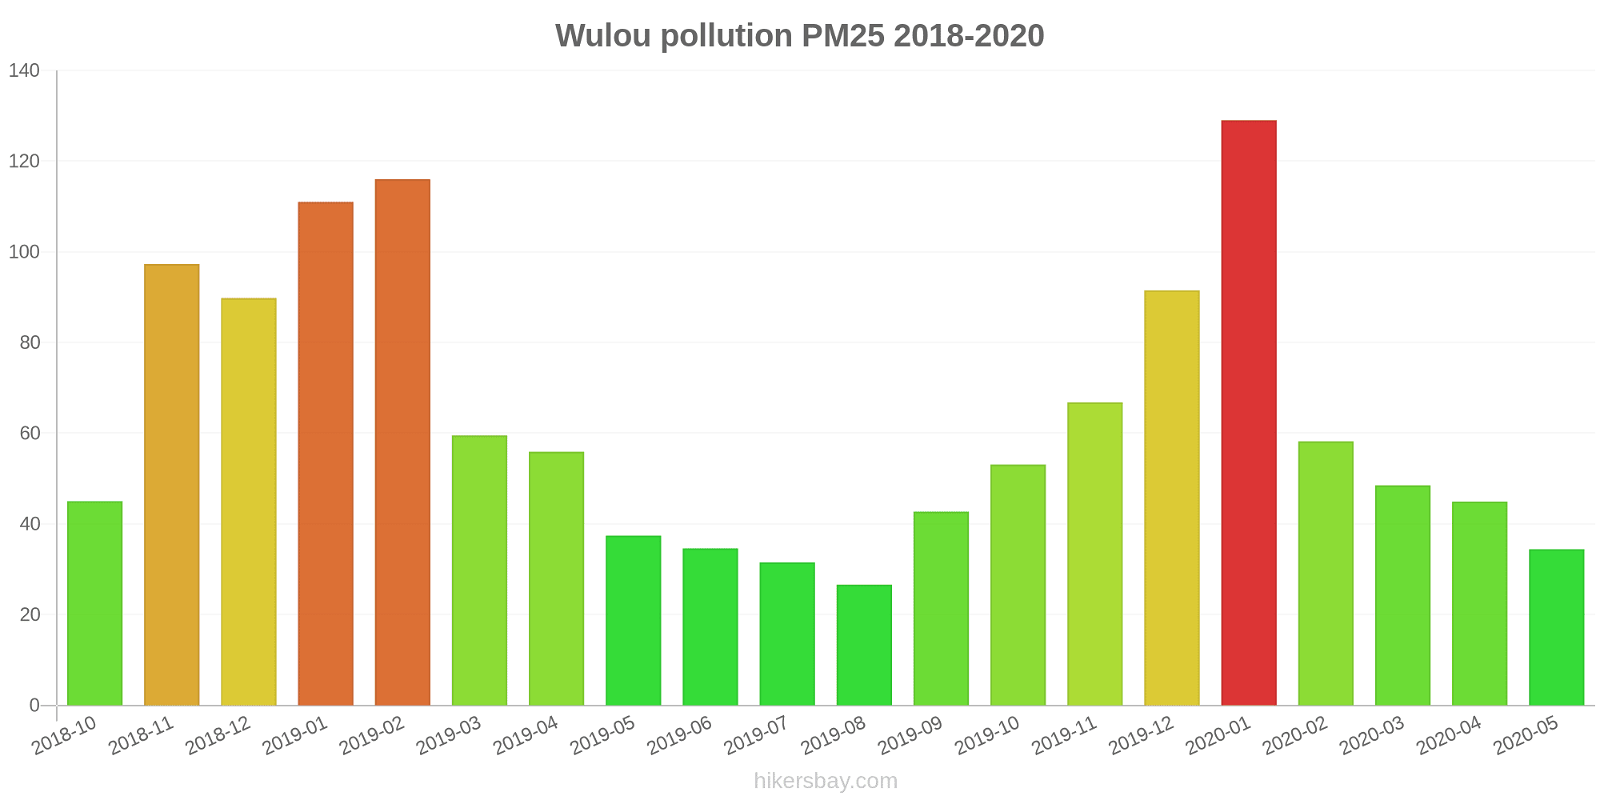
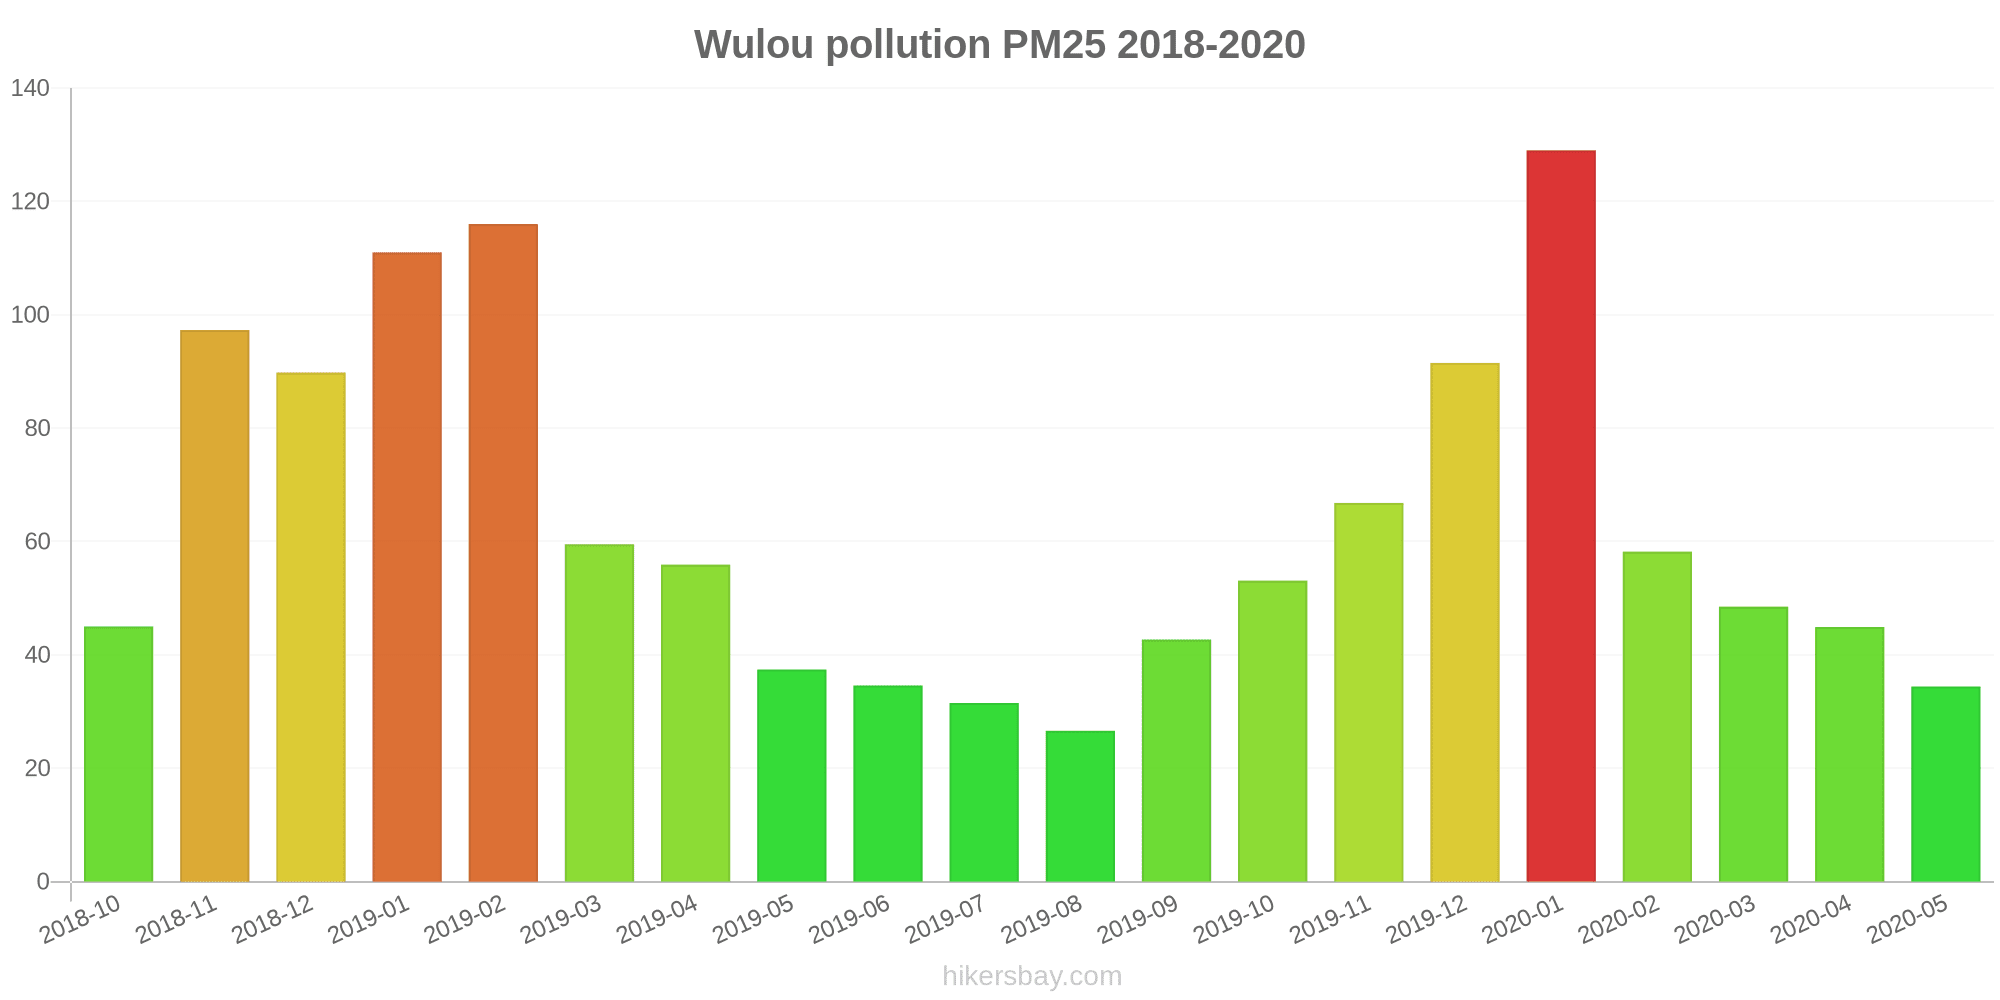
Die höchsten PM2,5-Werte wurden gemessen: 129 (Januar 2020).
Die niedrigste Feinstaubbelastung PM2,5 tritt im Monat auf: August (27).
Wie hoch ist die SO2-Belastung? (Schwefeldioxid (SO2))
18 (gut)
Wie hoch ist das NO2-Niveau? (Stickstoffdioxid (NO2))
3 (gut)
Wie hoch ist der CO-Gehalt? (Kohlenmonoxid (CO))
1 (gut)
Aktuelle Daten Freitag, 27. Mai 2022, 12:00
PM10 53 (Ungesund für sensible Gruppen)
O3 0 (gut)
PM2,5 7 (gut)
SO2 18 (gut)
NO2 3 (gut)
CO 1 (gut)
Daten zur Luftverschmutzung der letzten Tage in Wulou
index
2022-05-27
pm10
51
Unhealthy for Sensitive Groups
o3
0
Good
pm25
21
Moderate
so2
10
Good
no2
0
Good
co
1
Good
data source »
Luftverschmutzung in Wulou von Oktober 2018 bis Mai 2020
index
2020-05
2020-04
2020-03
2020-02
2020-01
2019-12
2019-11
2019-10
2019-09
2019-08
2019-07
2019-06
2019-05
2019-04
2019-03
2019-02
2019-01
2018-12
2018-11
2018-10
pm25
34 (Moderate)
45 (Unhealthy for Sensitive Groups)
49 (Unhealthy for Sensitive Groups)
58 (Unhealthy)
129 (Very bad Hazardous)
92 (Very Unhealthy)
67 (Unhealthy)
53 (Unhealthy for Sensitive Groups)
43 (Unhealthy for Sensitive Groups)
27 (Moderate)
32 (Moderate)
35 (Moderate)
37 (Unhealthy for Sensitive Groups)
56 (Unhealthy)
60 (Unhealthy)
116 (Very bad Hazardous)
111 (Very bad Hazardous)
90 (Very Unhealthy)
97 (Very Unhealthy)
45 (Unhealthy for Sensitive Groups)
co
520 (Good)
509 (Good)
517 (Good)
718 (Good)
1 (Good)
1 (Good)
740 (Good)
850 (Good)
876 (Good)
815 (Good)
740 (Good)
754 (Good)
524 (Good)
671 (Good)
708 (Good)
1 (Good)
1 (Good)
1 (Good)
1 (Good)
746 (Good)
no2
18 (Good)
29 (Good)
32 (Good)
21 (Good)
48 (Moderate)
50 (Moderate)
50 (Moderate)
45 (Moderate)
34 (Good)
30 (Good)
21 (Good)
24 (Good)
27 (Good)
31 (Good)
38 (Good)
41 (Moderate)
59 (Moderate)
61 (Moderate)
52 (Moderate)
53 (Moderate)
o3
151 (Unhealthy)
136 (Unhealthy for Sensitive Groups)
113 (Moderate)
93 (Moderate)
72 (Moderate)
51 (Good)
81 (Moderate)
122 (Unhealthy for Sensitive Groups)
180 (Very Unhealthy)
152 (Unhealthy)
207 (Very Unhealthy)
225 (Very Unhealthy)
175 (Unhealthy)
139 (Unhealthy for Sensitive Groups)
131 (Unhealthy for Sensitive Groups)
100 (Moderate)
70 (Good)
51 (Good)
81 (Moderate)
109 (Moderate)
pm10
67 (Unhealthy for Sensitive Groups)
87 (Unhealthy)
104 (Unhealthy)
76 (Unhealthy for Sensitive Groups)
159 (Very bad Hazardous)
131 (Very Unhealthy)
138 (Very Unhealthy)
112 (Very Unhealthy)
87 (Unhealthy)
51 (Unhealthy for Sensitive Groups)
63 (Unhealthy for Sensitive Groups)
87 (Unhealthy)
99 (Unhealthy)
115 (Very Unhealthy)
133 (Very Unhealthy)
166 (Very bad Hazardous)
186 (Very bad Hazardous)
166 (Very bad Hazardous)
170 (Very bad Hazardous)
104 (Unhealthy)
so2
7.5 (Good)
11 (Good)
13 (Good)
7.5 (Good)
14 (Good)
13 (Good)
17 (Good)
14 (Good)
12 (Good)
11 (Good)
9.2 (Good)
16 (Good)
17 (Good)
14 (Good)
13 (Good)
16 (Good)
24 (Good)
23 (Good)
13 (Good)
16 (Good)
data source »
聊大东校
Freitag, 27. Mai 2022, 12:00
PM10 53 (Ungesund für sensible Gruppen)
Feinstaub (PM10) Schwebestaub
O3 0.02 (gut)
Ozon (O3)
PM2,5 6.6 (gut)
Feinstaub (PM2,5)
SO2 18 (gut)
Schwefeldioxid (SO2)
NO2 3 (gut)
Stickstoffdioxid (NO2)
CO 1.3 (gut)
Kohlenmonoxid (CO)
聊大东校
index
2022-05-27
pm10
51
o3
0.02
pm25
21
so2
9.6
no2
0.38
co
0.64
聊大东校
2018-10 2020-05

index
2020-05
2020-04
2020-03
2020-02
2020-01
2019-12
2019-11
2019-10
2019-09
2019-08
2019-07
2019-06
2019-05
2019-04
2019-03
2019-02
2019-01
2018-12
2018-11
2018-10
pm25
34
45
49
58
129
92
67
53
43
27
32
35
37
56
60
116
111
90
97
45
co
520
509
517
718
1
1
740
850
876
815
740
754
524
671
708
1
1
1
1
746
no2
18
29
32
21
48
50
50
45
34
30
21
24
27
31
38
41
59
61
52
53
o3
151
136
113
93
72
51
81
122
180
152
207
225
175
139
131
100
70
51
81
109
pm10
67
87
104
76
159
131
138
112
87
51
63
87
99
115
133
166
186
166
170
104
so2
7.5
11
13
7.5
14
13
17
14
12
11
9.2
16
17
14
13
16
24
23
13
16
* Pollution data source:
https://openaq.org
(ChinaAQIData)
The data is licensed under CC-By 4.0
PM10 53 (Ungesund für sensible Gruppen)
O3 0 (gut)
PM2,5 7 (gut)
SO2 18 (gut)
NO2 3 (gut)
CO 1 (gut)
Daten zur Luftverschmutzung der letzten Tage in Wulou
| index | 2022-05-27 |
|---|---|
| pm10 | 51 Unhealthy for Sensitive Groups |
| o3 | 0 Good |
| pm25 | 21 Moderate |
| so2 | 10 Good |
| no2 | 0 Good |
| co | 1 Good |
| index | 2020-05 | 2020-04 | 2020-03 | 2020-02 | 2020-01 | 2019-12 | 2019-11 | 2019-10 | 2019-09 | 2019-08 | 2019-07 | 2019-06 | 2019-05 | 2019-04 | 2019-03 | 2019-02 | 2019-01 | 2018-12 | 2018-11 | 2018-10 |
|---|---|---|---|---|---|---|---|---|---|---|---|---|---|---|---|---|---|---|---|---|
| pm25 | 34 (Moderate) | 45 (Unhealthy for Sensitive Groups) | 49 (Unhealthy for Sensitive Groups) | 58 (Unhealthy) | 129 (Very bad Hazardous) | 92 (Very Unhealthy) | 67 (Unhealthy) | 53 (Unhealthy for Sensitive Groups) | 43 (Unhealthy for Sensitive Groups) | 27 (Moderate) | 32 (Moderate) | 35 (Moderate) | 37 (Unhealthy for Sensitive Groups) | 56 (Unhealthy) | 60 (Unhealthy) | 116 (Very bad Hazardous) | 111 (Very bad Hazardous) | 90 (Very Unhealthy) | 97 (Very Unhealthy) | 45 (Unhealthy for Sensitive Groups) |
| co | 520 (Good) | 509 (Good) | 517 (Good) | 718 (Good) | 1 (Good) | 1 (Good) | 740 (Good) | 850 (Good) | 876 (Good) | 815 (Good) | 740 (Good) | 754 (Good) | 524 (Good) | 671 (Good) | 708 (Good) | 1 (Good) | 1 (Good) | 1 (Good) | 1 (Good) | 746 (Good) |
| no2 | 18 (Good) | 29 (Good) | 32 (Good) | 21 (Good) | 48 (Moderate) | 50 (Moderate) | 50 (Moderate) | 45 (Moderate) | 34 (Good) | 30 (Good) | 21 (Good) | 24 (Good) | 27 (Good) | 31 (Good) | 38 (Good) | 41 (Moderate) | 59 (Moderate) | 61 (Moderate) | 52 (Moderate) | 53 (Moderate) |
| o3 | 151 (Unhealthy) | 136 (Unhealthy for Sensitive Groups) | 113 (Moderate) | 93 (Moderate) | 72 (Moderate) | 51 (Good) | 81 (Moderate) | 122 (Unhealthy for Sensitive Groups) | 180 (Very Unhealthy) | 152 (Unhealthy) | 207 (Very Unhealthy) | 225 (Very Unhealthy) | 175 (Unhealthy) | 139 (Unhealthy for Sensitive Groups) | 131 (Unhealthy for Sensitive Groups) | 100 (Moderate) | 70 (Good) | 51 (Good) | 81 (Moderate) | 109 (Moderate) |
| pm10 | 67 (Unhealthy for Sensitive Groups) | 87 (Unhealthy) | 104 (Unhealthy) | 76 (Unhealthy for Sensitive Groups) | 159 (Very bad Hazardous) | 131 (Very Unhealthy) | 138 (Very Unhealthy) | 112 (Very Unhealthy) | 87 (Unhealthy) | 51 (Unhealthy for Sensitive Groups) | 63 (Unhealthy for Sensitive Groups) | 87 (Unhealthy) | 99 (Unhealthy) | 115 (Very Unhealthy) | 133 (Very Unhealthy) | 166 (Very bad Hazardous) | 186 (Very bad Hazardous) | 166 (Very bad Hazardous) | 170 (Very bad Hazardous) | 104 (Unhealthy) |
| so2 | 7.5 (Good) | 11 (Good) | 13 (Good) | 7.5 (Good) | 14 (Good) | 13 (Good) | 17 (Good) | 14 (Good) | 12 (Good) | 11 (Good) | 9.2 (Good) | 16 (Good) | 17 (Good) | 14 (Good) | 13 (Good) | 16 (Good) | 24 (Good) | 23 (Good) | 13 (Good) | 16 (Good) |
PM10 53 (Ungesund für sensible Gruppen)
Feinstaub (PM10) SchwebestaubO3 0.02 (gut)
Ozon (O3)PM2,5 6.6 (gut)
Feinstaub (PM2,5)SO2 18 (gut)
Schwefeldioxid (SO2)NO2 3 (gut)
Stickstoffdioxid (NO2)CO 1.3 (gut)
Kohlenmonoxid (CO)聊大东校
| index | 2022-05-27 |
|---|---|
| pm10 | 51 |
| o3 | 0.02 |
| pm25 | 21 |
| so2 | 9.6 |
| no2 | 0.38 |
| co | 0.64 |
聊大东校

| index | 2020-05 | 2020-04 | 2020-03 | 2020-02 | 2020-01 | 2019-12 | 2019-11 | 2019-10 | 2019-09 | 2019-08 | 2019-07 | 2019-06 | 2019-05 | 2019-04 | 2019-03 | 2019-02 | 2019-01 | 2018-12 | 2018-11 | 2018-10 |
|---|---|---|---|---|---|---|---|---|---|---|---|---|---|---|---|---|---|---|---|---|
| pm25 | 34 | 45 | 49 | 58 | 129 | 92 | 67 | 53 | 43 | 27 | 32 | 35 | 37 | 56 | 60 | 116 | 111 | 90 | 97 | 45 |
| co | 520 | 509 | 517 | 718 | 1 | 1 | 740 | 850 | 876 | 815 | 740 | 754 | 524 | 671 | 708 | 1 | 1 | 1 | 1 | 746 |
| no2 | 18 | 29 | 32 | 21 | 48 | 50 | 50 | 45 | 34 | 30 | 21 | 24 | 27 | 31 | 38 | 41 | 59 | 61 | 52 | 53 |
| o3 | 151 | 136 | 113 | 93 | 72 | 51 | 81 | 122 | 180 | 152 | 207 | 225 | 175 | 139 | 131 | 100 | 70 | 51 | 81 | 109 |
| pm10 | 67 | 87 | 104 | 76 | 159 | 131 | 138 | 112 | 87 | 51 | 63 | 87 | 99 | 115 | 133 | 166 | 186 | 166 | 170 | 104 |
| so2 | 7.5 | 11 | 13 | 7.5 | 14 | 13 | 17 | 14 | 12 | 11 | 9.2 | 16 | 17 | 14 | 13 | 16 | 24 | 23 | 13 | 16 |