Luftverschmutzung in Shuanglong: Echtzeit-Luft-Qualitätsindex und Smog-Alarm.
Für die Shuanglong. Heute ist Montag, 6. April 2026. Für Shuanglong wurden folgende Luftverschmutzungswerte gemessen:- Feinstaub (PM10) Schwebestaub - 53 (Ungesund für sensible Gruppen)
- Ozon (O3) - 0 (gut)
- Feinstaub (PM2,5) - 7 (gut)
- Schwefeldioxid (SO2) - 18 (gut)
- Stickstoffdioxid (NO2) - 3 (gut)
- Kohlenmonoxid (CO) - 1 (gut)

Wie ist die Luftqualität Shuanglong heute? Ist die Luft in Shuanglong? verschmutzt. Gibt es Smog?
Wie hoch ist der PM10-Stand heute in Shuanglong? (Feinstaub (PM10) Schwebestaub)
Der aktuelle Feinstaubgehalt PM10 in Shuanglong is:
53 (Ungesund für sensible Gruppen)
Die höchsten PM10-Werte treten in der Regel im Monat auf: 147 (Januar 2019).
Der niedrigste Wert der Feinstaub-PM10-Belastung in Shuanglong ist in der Regel in: August (47).
Wie ist das O3-Niveau heute in Shuanglong? (Ozon (O3))
0 (gut)
Wie hoch ist der aktuelle PM2,5-Wert in Shuanglong? (Feinstaub (PM2,5))
Die heutige PM2.5-Stufe ist:
7 (gut)
Zum Vergleich: Der höchste PM2,5-Wert in Shuanglong in den letzten 7 Tagen war: 21 (Freitag, 27. Mai 2022) und der niedrigste: 21 (Freitag, 27. Mai 2022).
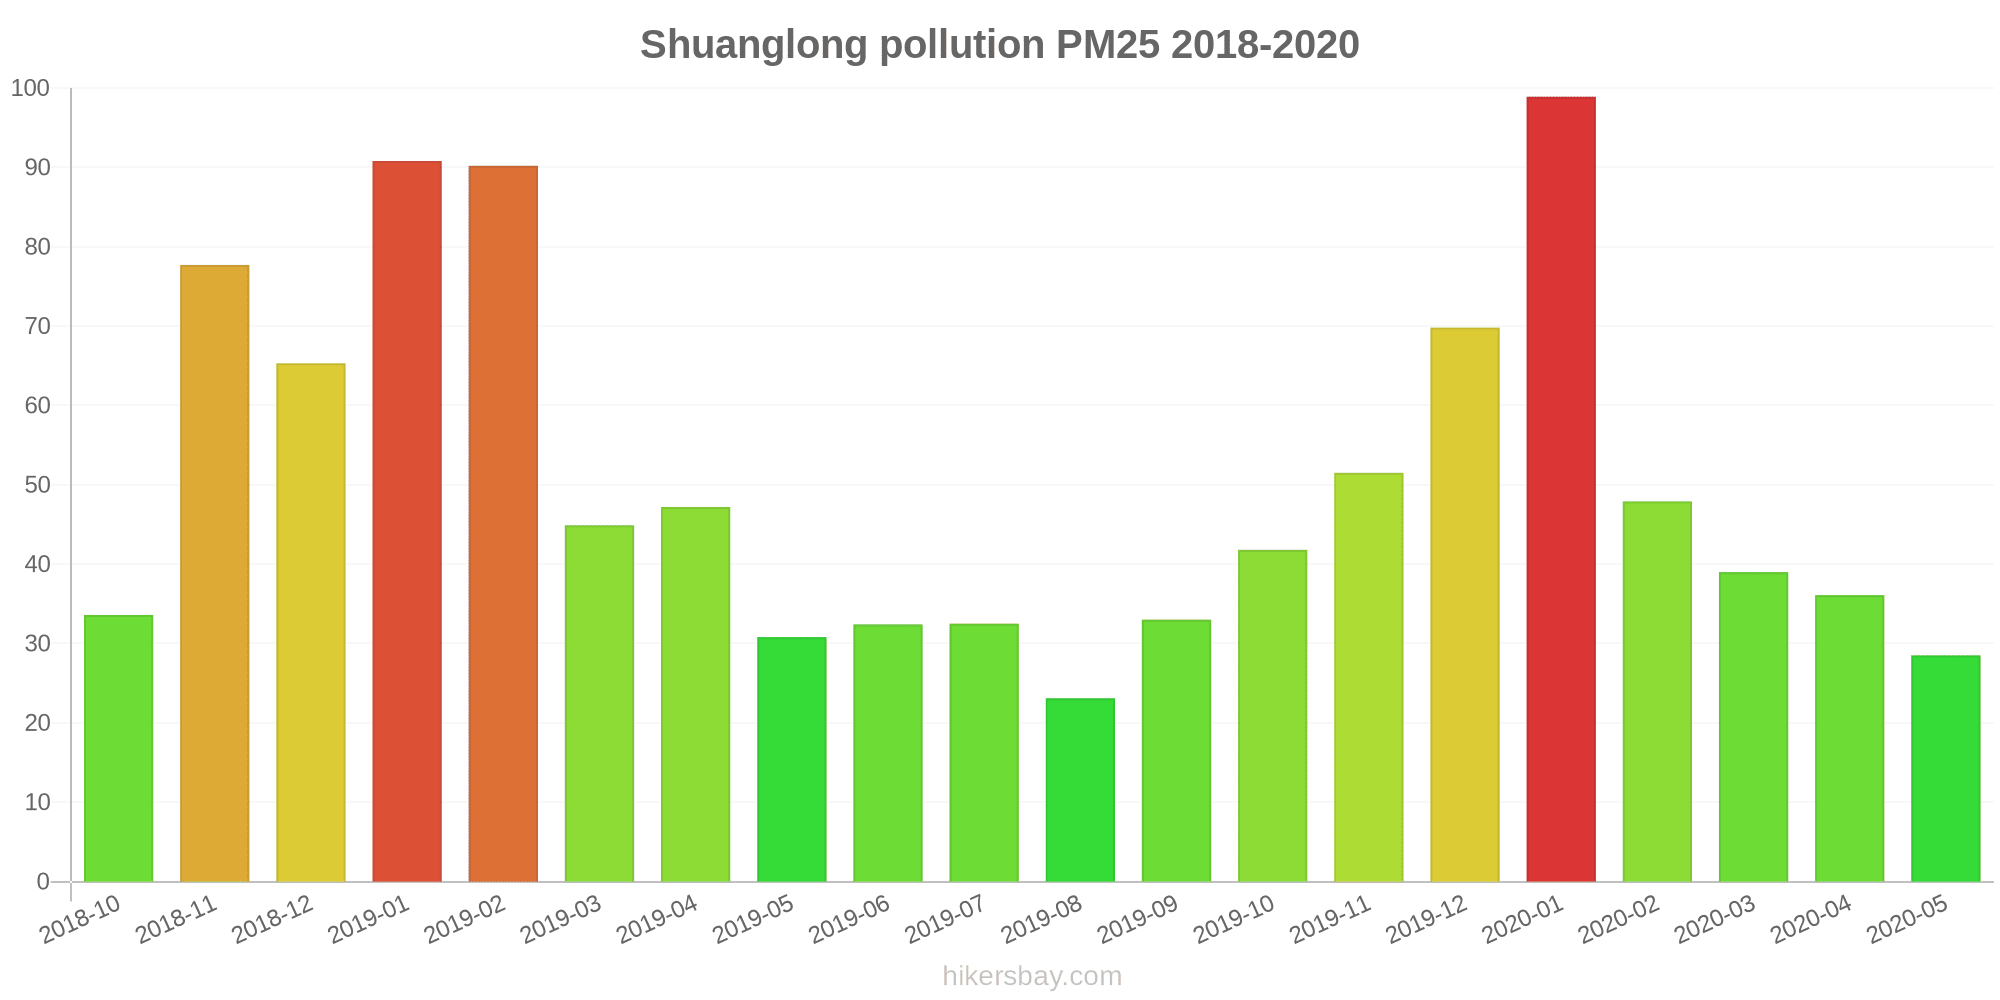
Die höchsten PM2,5-Werte wurden gemessen: 99 (Januar 2020).
Die niedrigste Feinstaubbelastung PM2,5 tritt im Monat auf: August (23).
Wie hoch ist die SO2-Belastung? (Schwefeldioxid (SO2))
18 (gut)
Wie hoch ist das NO2-Niveau? (Stickstoffdioxid (NO2))
3 (gut)
Wie hoch ist der CO-Gehalt? (Kohlenmonoxid (CO))
1 (gut)
Aktuelle Daten Freitag, 27. Mai 2022, 12:00
PM10 53 (Ungesund für sensible Gruppen)
O3 0 (gut)
PM2,5 7 (gut)
SO2 18 (gut)
NO2 3 (gut)
CO 1 (gut)
Daten zur Luftverschmutzung der letzten Tage in Shuanglong
index
2022-05-27
pm10
51
Unhealthy for Sensitive Groups
o3
0
Good
pm25
21
Moderate
so2
10
Good
no2
0
Good
co
1
Good
data source »
Luftverschmutzung in Shuanglong von Oktober 2018 bis Mai 2020

index
2020-05
2020-04
2020-03
2020-02
2020-01
2019-12
2019-11
2019-10
2019-09
2019-08
2019-07
2019-06
2019-05
2019-04
2019-03
2019-02
2019-01
2018-12
2018-11
2018-10
pm25
29 (Moderate)
36 (Unhealthy for Sensitive Groups)
39 (Unhealthy for Sensitive Groups)
48 (Unhealthy for Sensitive Groups)
99 (Very Unhealthy)
70 (Unhealthy)
52 (Unhealthy for Sensitive Groups)
42 (Unhealthy for Sensitive Groups)
33 (Moderate)
23 (Moderate)
33 (Moderate)
32 (Moderate)
31 (Moderate)
47 (Unhealthy for Sensitive Groups)
45 (Unhealthy for Sensitive Groups)
90 (Very Unhealthy)
91 (Very Unhealthy)
65 (Unhealthy)
78 (Very Unhealthy)
34 (Moderate)
co
861 (Good)
825 (Good)
745 (Good)
760 (Good)
1 (Good)
1 (Good)
922 (Good)
796 (Good)
795 (Good)
703 (Good)
618 (Good)
595 (Good)
493 (Good)
717 (Good)
554 (Good)
1 (Good)
1 (Good)
1 (Good)
1 (Good)
579 (Good)
no2
21 (Good)
31 (Good)
25 (Good)
21 (Good)
49 (Moderate)
48 (Moderate)
49 (Moderate)
38 (Good)
34 (Good)
28 (Good)
20 (Good)
26 (Good)
34 (Good)
47 (Moderate)
46 (Moderate)
45 (Moderate)
47 (Moderate)
49 (Moderate)
43 (Moderate)
36 (Good)
o3
172 (Unhealthy)
143 (Unhealthy for Sensitive Groups)
121 (Unhealthy for Sensitive Groups)
99 (Moderate)
76 (Moderate)
63 (Good)
83 (Moderate)
125 (Unhealthy for Sensitive Groups)
171 (Unhealthy)
152 (Unhealthy)
213 (Very Unhealthy)
227 (Very Unhealthy)
179 (Unhealthy)
137 (Unhealthy for Sensitive Groups)
122 (Unhealthy for Sensitive Groups)
94 (Moderate)
63 (Good)
51 (Good)
86 (Moderate)
109 (Moderate)
pm10
68 (Unhealthy for Sensitive Groups)
78 (Unhealthy for Sensitive Groups)
84 (Unhealthy)
67 (Unhealthy for Sensitive Groups)
129 (Very Unhealthy)
108 (Unhealthy)
119 (Very Unhealthy)
107 (Unhealthy)
72 (Unhealthy for Sensitive Groups)
47 (Moderate)
62 (Unhealthy for Sensitive Groups)
77 (Unhealthy for Sensitive Groups)
90 (Unhealthy)
112 (Very Unhealthy)
112 (Very Unhealthy)
137 (Very Unhealthy)
147 (Very Unhealthy)
124 (Very Unhealthy)
145 (Very Unhealthy)
91 (Unhealthy)
so2
9.4 (Good)
9.9 (Good)
10 (Good)
10 (Good)
22 (Good)
16 (Good)
11 (Good)
9.3 (Good)
9 (Good)
6.8 (Good)
7 (Good)
13 (Good)
12 (Good)
13 (Good)
12 (Good)
16 (Good)
22 (Good)
18 (Good)
11 (Good)
10 (Good)
data source »
科干所
Freitag, 27. Mai 2022, 12:00
PM10 53 (Ungesund für sensible Gruppen)
Feinstaub (PM10) Schwebestaub
O3 0.02 (gut)
Ozon (O3)
PM2,5 6.6 (gut)
Feinstaub (PM2,5)
SO2 18 (gut)
Schwefeldioxid (SO2)
NO2 3 (gut)
Stickstoffdioxid (NO2)
CO 1.3 (gut)
Kohlenmonoxid (CO)
科干所
index
2022-05-27
pm10
51
o3
0.02
pm25
21
so2
9.6
no2
0.38
co
0.64
科干所
2018-10 2020-05

index
2020-05
2020-04
2020-03
2020-02
2020-01
2019-12
2019-11
2019-10
2019-09
2019-08
2019-07
2019-06
2019-05
2019-04
2019-03
2019-02
2019-01
2018-12
2018-11
2018-10
pm25
29
36
39
48
99
70
52
42
33
23
33
32
31
47
45
90
91
65
78
34
co
861
825
745
760
1
1
922
796
795
703
618
595
493
717
554
1
1
1
1
579
no2
21
31
25
21
49
48
49
38
34
28
20
26
34
47
46
45
47
49
43
36
o3
172
143
121
99
76
63
83
125
171
152
213
227
179
137
122
94
63
51
86
109
pm10
68
78
84
67
129
108
119
107
72
47
62
77
90
112
112
137
147
124
145
91
so2
9.4
9.9
10
10
22
16
11
9.3
9
6.8
7
13
12
13
12
16
22
18
11
10
* Pollution data source:
https://openaq.org
(ChinaAQIData)
The data is licensed under CC-By 4.0
PM10 53 (Ungesund für sensible Gruppen)
O3 0 (gut)
PM2,5 7 (gut)
SO2 18 (gut)
NO2 3 (gut)
CO 1 (gut)
Daten zur Luftverschmutzung der letzten Tage in Shuanglong
| index | 2022-05-27 |
|---|---|
| pm10 | 51 Unhealthy for Sensitive Groups |
| o3 | 0 Good |
| pm25 | 21 Moderate |
| so2 | 10 Good |
| no2 | 0 Good |
| co | 1 Good |
| index | 2020-05 | 2020-04 | 2020-03 | 2020-02 | 2020-01 | 2019-12 | 2019-11 | 2019-10 | 2019-09 | 2019-08 | 2019-07 | 2019-06 | 2019-05 | 2019-04 | 2019-03 | 2019-02 | 2019-01 | 2018-12 | 2018-11 | 2018-10 |
|---|---|---|---|---|---|---|---|---|---|---|---|---|---|---|---|---|---|---|---|---|
| pm25 | 29 (Moderate) | 36 (Unhealthy for Sensitive Groups) | 39 (Unhealthy for Sensitive Groups) | 48 (Unhealthy for Sensitive Groups) | 99 (Very Unhealthy) | 70 (Unhealthy) | 52 (Unhealthy for Sensitive Groups) | 42 (Unhealthy for Sensitive Groups) | 33 (Moderate) | 23 (Moderate) | 33 (Moderate) | 32 (Moderate) | 31 (Moderate) | 47 (Unhealthy for Sensitive Groups) | 45 (Unhealthy for Sensitive Groups) | 90 (Very Unhealthy) | 91 (Very Unhealthy) | 65 (Unhealthy) | 78 (Very Unhealthy) | 34 (Moderate) |
| co | 861 (Good) | 825 (Good) | 745 (Good) | 760 (Good) | 1 (Good) | 1 (Good) | 922 (Good) | 796 (Good) | 795 (Good) | 703 (Good) | 618 (Good) | 595 (Good) | 493 (Good) | 717 (Good) | 554 (Good) | 1 (Good) | 1 (Good) | 1 (Good) | 1 (Good) | 579 (Good) |
| no2 | 21 (Good) | 31 (Good) | 25 (Good) | 21 (Good) | 49 (Moderate) | 48 (Moderate) | 49 (Moderate) | 38 (Good) | 34 (Good) | 28 (Good) | 20 (Good) | 26 (Good) | 34 (Good) | 47 (Moderate) | 46 (Moderate) | 45 (Moderate) | 47 (Moderate) | 49 (Moderate) | 43 (Moderate) | 36 (Good) |
| o3 | 172 (Unhealthy) | 143 (Unhealthy for Sensitive Groups) | 121 (Unhealthy for Sensitive Groups) | 99 (Moderate) | 76 (Moderate) | 63 (Good) | 83 (Moderate) | 125 (Unhealthy for Sensitive Groups) | 171 (Unhealthy) | 152 (Unhealthy) | 213 (Very Unhealthy) | 227 (Very Unhealthy) | 179 (Unhealthy) | 137 (Unhealthy for Sensitive Groups) | 122 (Unhealthy for Sensitive Groups) | 94 (Moderate) | 63 (Good) | 51 (Good) | 86 (Moderate) | 109 (Moderate) |
| pm10 | 68 (Unhealthy for Sensitive Groups) | 78 (Unhealthy for Sensitive Groups) | 84 (Unhealthy) | 67 (Unhealthy for Sensitive Groups) | 129 (Very Unhealthy) | 108 (Unhealthy) | 119 (Very Unhealthy) | 107 (Unhealthy) | 72 (Unhealthy for Sensitive Groups) | 47 (Moderate) | 62 (Unhealthy for Sensitive Groups) | 77 (Unhealthy for Sensitive Groups) | 90 (Unhealthy) | 112 (Very Unhealthy) | 112 (Very Unhealthy) | 137 (Very Unhealthy) | 147 (Very Unhealthy) | 124 (Very Unhealthy) | 145 (Very Unhealthy) | 91 (Unhealthy) |
| so2 | 9.4 (Good) | 9.9 (Good) | 10 (Good) | 10 (Good) | 22 (Good) | 16 (Good) | 11 (Good) | 9.3 (Good) | 9 (Good) | 6.8 (Good) | 7 (Good) | 13 (Good) | 12 (Good) | 13 (Good) | 12 (Good) | 16 (Good) | 22 (Good) | 18 (Good) | 11 (Good) | 10 (Good) |
PM10 53 (Ungesund für sensible Gruppen)
Feinstaub (PM10) SchwebestaubO3 0.02 (gut)
Ozon (O3)PM2,5 6.6 (gut)
Feinstaub (PM2,5)SO2 18 (gut)
Schwefeldioxid (SO2)NO2 3 (gut)
Stickstoffdioxid (NO2)CO 1.3 (gut)
Kohlenmonoxid (CO)科干所
| index | 2022-05-27 |
|---|---|
| pm10 | 51 |
| o3 | 0.02 |
| pm25 | 21 |
| so2 | 9.6 |
| no2 | 0.38 |
| co | 0.64 |
科干所

| index | 2020-05 | 2020-04 | 2020-03 | 2020-02 | 2020-01 | 2019-12 | 2019-11 | 2019-10 | 2019-09 | 2019-08 | 2019-07 | 2019-06 | 2019-05 | 2019-04 | 2019-03 | 2019-02 | 2019-01 | 2018-12 | 2018-11 | 2018-10 |
|---|---|---|---|---|---|---|---|---|---|---|---|---|---|---|---|---|---|---|---|---|
| pm25 | 29 | 36 | 39 | 48 | 99 | 70 | 52 | 42 | 33 | 23 | 33 | 32 | 31 | 47 | 45 | 90 | 91 | 65 | 78 | 34 |
| co | 861 | 825 | 745 | 760 | 1 | 1 | 922 | 796 | 795 | 703 | 618 | 595 | 493 | 717 | 554 | 1 | 1 | 1 | 1 | 579 |
| no2 | 21 | 31 | 25 | 21 | 49 | 48 | 49 | 38 | 34 | 28 | 20 | 26 | 34 | 47 | 46 | 45 | 47 | 49 | 43 | 36 |
| o3 | 172 | 143 | 121 | 99 | 76 | 63 | 83 | 125 | 171 | 152 | 213 | 227 | 179 | 137 | 122 | 94 | 63 | 51 | 86 | 109 |
| pm10 | 68 | 78 | 84 | 67 | 129 | 108 | 119 | 107 | 72 | 47 | 62 | 77 | 90 | 112 | 112 | 137 | 147 | 124 | 145 | 91 |
| so2 | 9.4 | 9.9 | 10 | 10 | 22 | 16 | 11 | 9.3 | 9 | 6.8 | 7 | 13 | 12 | 13 | 12 | 16 | 22 | 18 | 11 | 10 |