Luftverschmutzung in Hetaozhuang: Echtzeit-Luft-Qualitätsindex und Smog-Alarm.
Für die Hetaozhuang. Heute ist Montag, 6. April 2026. Für Hetaozhuang wurden folgende Luftverschmutzungswerte gemessen:- Feinstaub (PM10) Schwebestaub - 53 (Ungesund für sensible Gruppen)
- Ozon (O3) - 0 (gut)
- Feinstaub (PM2,5) - 7 (gut)
- Schwefeldioxid (SO2) - 18 (gut)
- Stickstoffdioxid (NO2) - 3 (gut)
- Kohlenmonoxid (CO) - 1 (gut)

Wie ist die Luftqualität Hetaozhuang heute? Ist die Luft in Hetaozhuang? verschmutzt. Gibt es Smog?
Wie hoch ist der PM10-Stand heute in Hetaozhuang? (Feinstaub (PM10) Schwebestaub)
Der aktuelle Feinstaubgehalt PM10 in Hetaozhuang is:
53 (Ungesund für sensible Gruppen)
Die höchsten PM10-Werte treten in der Regel im Monat auf: 172 (Januar 2019).
Der niedrigste Wert der Feinstaub-PM10-Belastung in Hetaozhuang ist in der Regel in: August (64).
Wie ist das O3-Niveau heute in Hetaozhuang? (Ozon (O3))
0 (gut)
Wie hoch ist der aktuelle PM2,5-Wert in Hetaozhuang? (Feinstaub (PM2,5))
Die heutige PM2.5-Stufe ist:
7 (gut)
Zum Vergleich: Der höchste PM2,5-Wert in Hetaozhuang in den letzten 7 Tagen war: 21 (Freitag, 27. Mai 2022) und der niedrigste: 21 (Freitag, 27. Mai 2022).
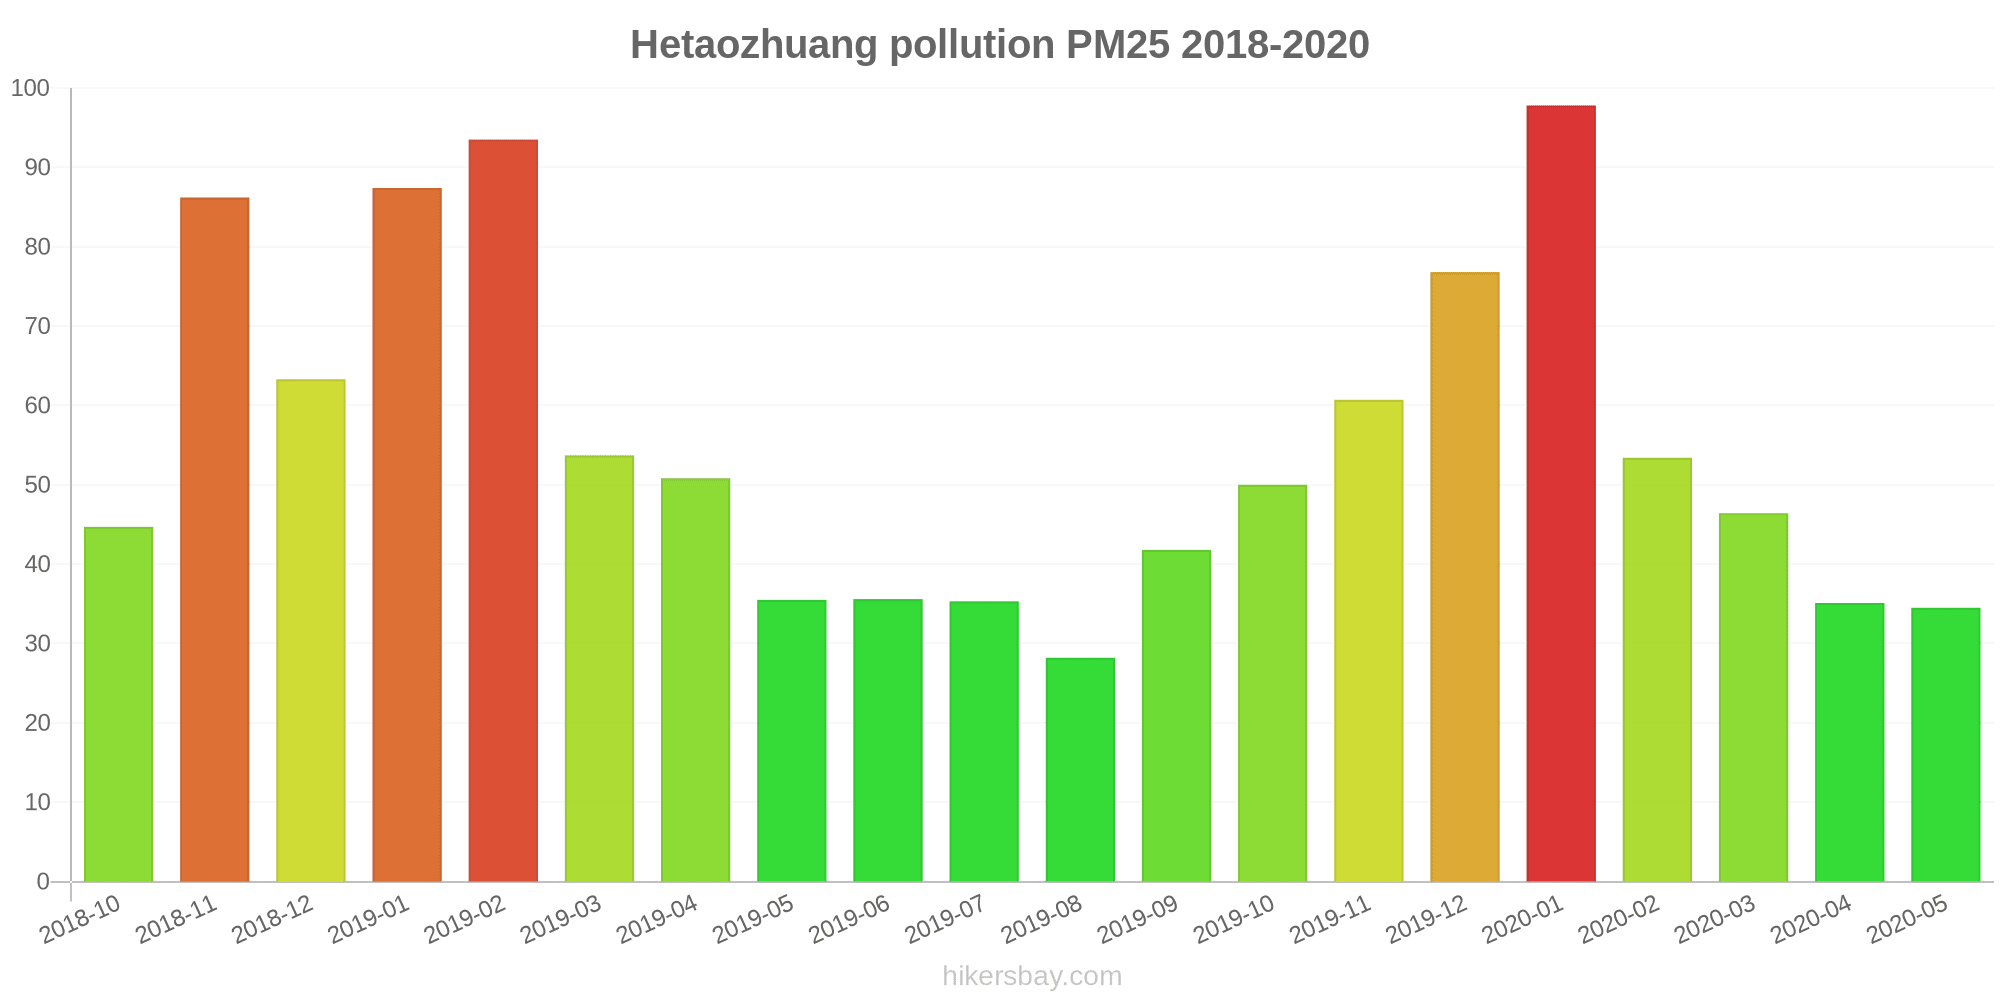
Die höchsten PM2,5-Werte wurden gemessen: 98 (Januar 2020).
Die niedrigste Feinstaubbelastung PM2,5 tritt im Monat auf: August (28).
Wie hoch ist die SO2-Belastung? (Schwefeldioxid (SO2))
18 (gut)
Wie hoch ist das NO2-Niveau? (Stickstoffdioxid (NO2))
3 (gut)
Wie hoch ist der CO-Gehalt? (Kohlenmonoxid (CO))
1 (gut)
Aktuelle Daten Freitag, 27. Mai 2022, 12:00
PM10 53 (Ungesund für sensible Gruppen)
O3 0 (gut)
PM2,5 7 (gut)
SO2 18 (gut)
NO2 3 (gut)
CO 1 (gut)
Daten zur Luftverschmutzung der letzten Tage in Hetaozhuang
index
2022-05-27
pm10
51
Unhealthy for Sensitive Groups
o3
0
Good
pm25
21
Moderate
so2
10
Good
no2
0
Good
co
1
Good
data source »
Luftverschmutzung in Hetaozhuang von Oktober 2018 bis Mai 2020

index
2020-05
2020-04
2020-03
2020-02
2020-01
2019-12
2019-11
2019-10
2019-09
2019-08
2019-07
2019-06
2019-05
2019-04
2019-03
2019-02
2019-01
2018-12
2018-11
2018-10
pm25
35 (Moderate)
35 (Unhealthy for Sensitive Groups)
46 (Unhealthy for Sensitive Groups)
53 (Unhealthy for Sensitive Groups)
98 (Very Unhealthy)
77 (Very Unhealthy)
61 (Unhealthy)
50 (Unhealthy for Sensitive Groups)
42 (Unhealthy for Sensitive Groups)
28 (Moderate)
35 (Unhealthy for Sensitive Groups)
36 (Unhealthy for Sensitive Groups)
36 (Unhealthy for Sensitive Groups)
51 (Unhealthy for Sensitive Groups)
54 (Unhealthy for Sensitive Groups)
94 (Very Unhealthy)
87 (Very Unhealthy)
63 (Unhealthy)
86 (Very Unhealthy)
45 (Unhealthy for Sensitive Groups)
co
611 (Good)
585 (Good)
740 (Good)
780 (Good)
1 (Good)
1 (Good)
1 (Good)
904 (Good)
997 (Good)
990 (Good)
823 (Good)
738 (Good)
559 (Good)
879 (Good)
767 (Good)
1 (Good)
1 (Good)
1 (Good)
1 (Good)
787 (Good)
no2
29 (Good)
38 (Good)
34 (Good)
23 (Good)
46 (Moderate)
45 (Moderate)
44 (Moderate)
38 (Good)
40 (Moderate)
29 (Good)
25 (Good)
25 (Good)
29 (Good)
35 (Good)
39 (Good)
42 (Moderate)
55 (Moderate)
51 (Moderate)
44 (Moderate)
50 (Moderate)
o3
152 (Unhealthy)
133 (Unhealthy for Sensitive Groups)
119 (Moderate)
96 (Moderate)
78 (Moderate)
52 (Good)
70 (Moderate)
118 (Moderate)
173 (Unhealthy)
145 (Unhealthy for Sensitive Groups)
188 (Very Unhealthy)
210 (Very Unhealthy)
169 (Unhealthy)
133 (Unhealthy for Sensitive Groups)
119 (Moderate)
91 (Moderate)
68 (Good)
59 (Good)
88 (Moderate)
96 (Moderate)
pm10
78 (Unhealthy for Sensitive Groups)
99 (Unhealthy)
107 (Unhealthy)
80 (Unhealthy)
142 (Very Unhealthy)
134 (Very Unhealthy)
146 (Very Unhealthy)
117 (Very Unhealthy)
93 (Unhealthy)
64 (Unhealthy for Sensitive Groups)
68 (Unhealthy for Sensitive Groups)
84 (Unhealthy)
101 (Unhealthy)
120 (Very Unhealthy)
131 (Very Unhealthy)
158 (Very bad Hazardous)
172 (Very bad Hazardous)
148 (Very Unhealthy)
155 (Very bad Hazardous)
103 (Unhealthy)
so2
15 (Good)
19 (Good)
21 (Good)
20 (Good)
29 (Good)
21 (Good)
20 (Good)
15 (Good)
16 (Good)
16 (Good)
15 (Good)
24 (Good)
20 (Good)
22 (Good)
22 (Good)
29 (Good)
32 (Good)
32 (Good)
28 (Good)
29 (Good)
data source »
Freitag, 27. Mai 2022, 12:00
PM10 53 (Ungesund für sensible Gruppen)
Feinstaub (PM10) Schwebestaub
O3 0.02 (gut)
Ozon (O3)
PM2,5 6.6 (gut)
Feinstaub (PM2,5)
SO2 18 (gut)
Schwefeldioxid (SO2)
NO2 3 (gut)
Stickstoffdioxid (NO2)
CO 1.3 (gut)
Kohlenmonoxid (CO)
index
2022-05-27
pm10
51
o3
0.02
pm25
21
so2
9.6
no2
0.38
co
0.64
明水开发区
2018-10 2020-05

index
2020-05
2020-04
2020-03
2020-02
2020-01
2019-12
2019-11
2019-10
2019-09
2019-08
2019-07
2019-06
2019-05
2019-04
2019-03
2019-02
2019-01
2018-12
2018-11
2018-10
pm25
35
35
46
53
98
77
61
50
42
28
35
36
36
51
54
94
87
63
86
45
co
611
585
740
780
1
1
1
904
997
990
823
738
559
879
767
1
1
1
1
787
no2
29
38
34
23
46
45
44
38
40
29
25
25
29
35
39
42
55
51
44
50
o3
152
133
119
96
78
52
70
118
173
145
188
210
169
133
119
91
68
59
88
96
pm10
78
99
107
80
142
134
146
117
93
64
68
84
101
120
131
158
172
148
155
103
so2
15
19
21
20
29
21
20
15
16
16
15
24
20
22
22
29
32
32
28
29
* Pollution data source:
https://openaq.org
(ChinaAQIData)
The data is licensed under CC-By 4.0
PM10 53 (Ungesund für sensible Gruppen)
O3 0 (gut)
PM2,5 7 (gut)
SO2 18 (gut)
NO2 3 (gut)
CO 1 (gut)
Daten zur Luftverschmutzung der letzten Tage in Hetaozhuang
| index | 2022-05-27 |
|---|---|
| pm10 | 51 Unhealthy for Sensitive Groups |
| o3 | 0 Good |
| pm25 | 21 Moderate |
| so2 | 10 Good |
| no2 | 0 Good |
| co | 1 Good |
| index | 2020-05 | 2020-04 | 2020-03 | 2020-02 | 2020-01 | 2019-12 | 2019-11 | 2019-10 | 2019-09 | 2019-08 | 2019-07 | 2019-06 | 2019-05 | 2019-04 | 2019-03 | 2019-02 | 2019-01 | 2018-12 | 2018-11 | 2018-10 |
|---|---|---|---|---|---|---|---|---|---|---|---|---|---|---|---|---|---|---|---|---|
| pm25 | 35 (Moderate) | 35 (Unhealthy for Sensitive Groups) | 46 (Unhealthy for Sensitive Groups) | 53 (Unhealthy for Sensitive Groups) | 98 (Very Unhealthy) | 77 (Very Unhealthy) | 61 (Unhealthy) | 50 (Unhealthy for Sensitive Groups) | 42 (Unhealthy for Sensitive Groups) | 28 (Moderate) | 35 (Unhealthy for Sensitive Groups) | 36 (Unhealthy for Sensitive Groups) | 36 (Unhealthy for Sensitive Groups) | 51 (Unhealthy for Sensitive Groups) | 54 (Unhealthy for Sensitive Groups) | 94 (Very Unhealthy) | 87 (Very Unhealthy) | 63 (Unhealthy) | 86 (Very Unhealthy) | 45 (Unhealthy for Sensitive Groups) |
| co | 611 (Good) | 585 (Good) | 740 (Good) | 780 (Good) | 1 (Good) | 1 (Good) | 1 (Good) | 904 (Good) | 997 (Good) | 990 (Good) | 823 (Good) | 738 (Good) | 559 (Good) | 879 (Good) | 767 (Good) | 1 (Good) | 1 (Good) | 1 (Good) | 1 (Good) | 787 (Good) |
| no2 | 29 (Good) | 38 (Good) | 34 (Good) | 23 (Good) | 46 (Moderate) | 45 (Moderate) | 44 (Moderate) | 38 (Good) | 40 (Moderate) | 29 (Good) | 25 (Good) | 25 (Good) | 29 (Good) | 35 (Good) | 39 (Good) | 42 (Moderate) | 55 (Moderate) | 51 (Moderate) | 44 (Moderate) | 50 (Moderate) |
| o3 | 152 (Unhealthy) | 133 (Unhealthy for Sensitive Groups) | 119 (Moderate) | 96 (Moderate) | 78 (Moderate) | 52 (Good) | 70 (Moderate) | 118 (Moderate) | 173 (Unhealthy) | 145 (Unhealthy for Sensitive Groups) | 188 (Very Unhealthy) | 210 (Very Unhealthy) | 169 (Unhealthy) | 133 (Unhealthy for Sensitive Groups) | 119 (Moderate) | 91 (Moderate) | 68 (Good) | 59 (Good) | 88 (Moderate) | 96 (Moderate) |
| pm10 | 78 (Unhealthy for Sensitive Groups) | 99 (Unhealthy) | 107 (Unhealthy) | 80 (Unhealthy) | 142 (Very Unhealthy) | 134 (Very Unhealthy) | 146 (Very Unhealthy) | 117 (Very Unhealthy) | 93 (Unhealthy) | 64 (Unhealthy for Sensitive Groups) | 68 (Unhealthy for Sensitive Groups) | 84 (Unhealthy) | 101 (Unhealthy) | 120 (Very Unhealthy) | 131 (Very Unhealthy) | 158 (Very bad Hazardous) | 172 (Very bad Hazardous) | 148 (Very Unhealthy) | 155 (Very bad Hazardous) | 103 (Unhealthy) |
| so2 | 15 (Good) | 19 (Good) | 21 (Good) | 20 (Good) | 29 (Good) | 21 (Good) | 20 (Good) | 15 (Good) | 16 (Good) | 16 (Good) | 15 (Good) | 24 (Good) | 20 (Good) | 22 (Good) | 22 (Good) | 29 (Good) | 32 (Good) | 32 (Good) | 28 (Good) | 29 (Good) |
PM10 53 (Ungesund für sensible Gruppen)
Feinstaub (PM10) SchwebestaubO3 0.02 (gut)
Ozon (O3)PM2,5 6.6 (gut)
Feinstaub (PM2,5)SO2 18 (gut)
Schwefeldioxid (SO2)NO2 3 (gut)
Stickstoffdioxid (NO2)CO 1.3 (gut)
Kohlenmonoxid (CO)
| index | 2022-05-27 |
|---|---|
| pm10 | 51 |
| o3 | 0.02 |
| pm25 | 21 |
| so2 | 9.6 |
| no2 | 0.38 |
| co | 0.64 |
明水开发区

| index | 2020-05 | 2020-04 | 2020-03 | 2020-02 | 2020-01 | 2019-12 | 2019-11 | 2019-10 | 2019-09 | 2019-08 | 2019-07 | 2019-06 | 2019-05 | 2019-04 | 2019-03 | 2019-02 | 2019-01 | 2018-12 | 2018-11 | 2018-10 |
|---|---|---|---|---|---|---|---|---|---|---|---|---|---|---|---|---|---|---|---|---|
| pm25 | 35 | 35 | 46 | 53 | 98 | 77 | 61 | 50 | 42 | 28 | 35 | 36 | 36 | 51 | 54 | 94 | 87 | 63 | 86 | 45 |
| co | 611 | 585 | 740 | 780 | 1 | 1 | 1 | 904 | 997 | 990 | 823 | 738 | 559 | 879 | 767 | 1 | 1 | 1 | 1 | 787 |
| no2 | 29 | 38 | 34 | 23 | 46 | 45 | 44 | 38 | 40 | 29 | 25 | 25 | 29 | 35 | 39 | 42 | 55 | 51 | 44 | 50 |
| o3 | 152 | 133 | 119 | 96 | 78 | 52 | 70 | 118 | 173 | 145 | 188 | 210 | 169 | 133 | 119 | 91 | 68 | 59 | 88 | 96 |
| pm10 | 78 | 99 | 107 | 80 | 142 | 134 | 146 | 117 | 93 | 64 | 68 | 84 | 101 | 120 | 131 | 158 | 172 | 148 | 155 | 103 |
| so2 | 15 | 19 | 21 | 20 | 29 | 21 | 20 | 15 | 16 | 16 | 15 | 24 | 20 | 22 | 22 | 29 | 32 | 32 | 28 | 29 |