Luftverschmutzung in Suijiatun: Echtzeit-Luft-Qualitätsindex und Smog-Alarm.
Für die Suijiatun. Heute ist Montag, 6. April 2026. Für Suijiatun wurden folgende Luftverschmutzungswerte gemessen:- Feinstaub (PM10) Schwebestaub - 53 (Ungesund für sensible Gruppen)
- Ozon (O3) - 0 (gut)
- Feinstaub (PM2,5) - 7 (gut)
- Schwefeldioxid (SO2) - 18 (gut)
- Stickstoffdioxid (NO2) - 3 (gut)
- Kohlenmonoxid (CO) - 1 (gut)

Wie ist die Luftqualität Suijiatun heute? Ist die Luft in Suijiatun? verschmutzt. Gibt es Smog?
Wie hoch ist der PM10-Stand heute in Suijiatun? (Feinstaub (PM10) Schwebestaub)
Der aktuelle Feinstaubgehalt PM10 in Suijiatun is:
53 (Ungesund für sensible Gruppen)
Die höchsten PM10-Werte treten in der Regel im Monat auf: 131 (Januar 2019).
Der niedrigste Wert der Feinstaub-PM10-Belastung in Suijiatun ist in der Regel in: August (39).
Wie ist das O3-Niveau heute in Suijiatun? (Ozon (O3))
0 (gut)
Wie hoch ist der aktuelle PM2,5-Wert in Suijiatun? (Feinstaub (PM2,5))
Die heutige PM2.5-Stufe ist:
7 (gut)
Zum Vergleich: Der höchste PM2,5-Wert in Suijiatun in den letzten 7 Tagen war: 21 (Freitag, 27. Mai 2022) und der niedrigste: 21 (Freitag, 27. Mai 2022).
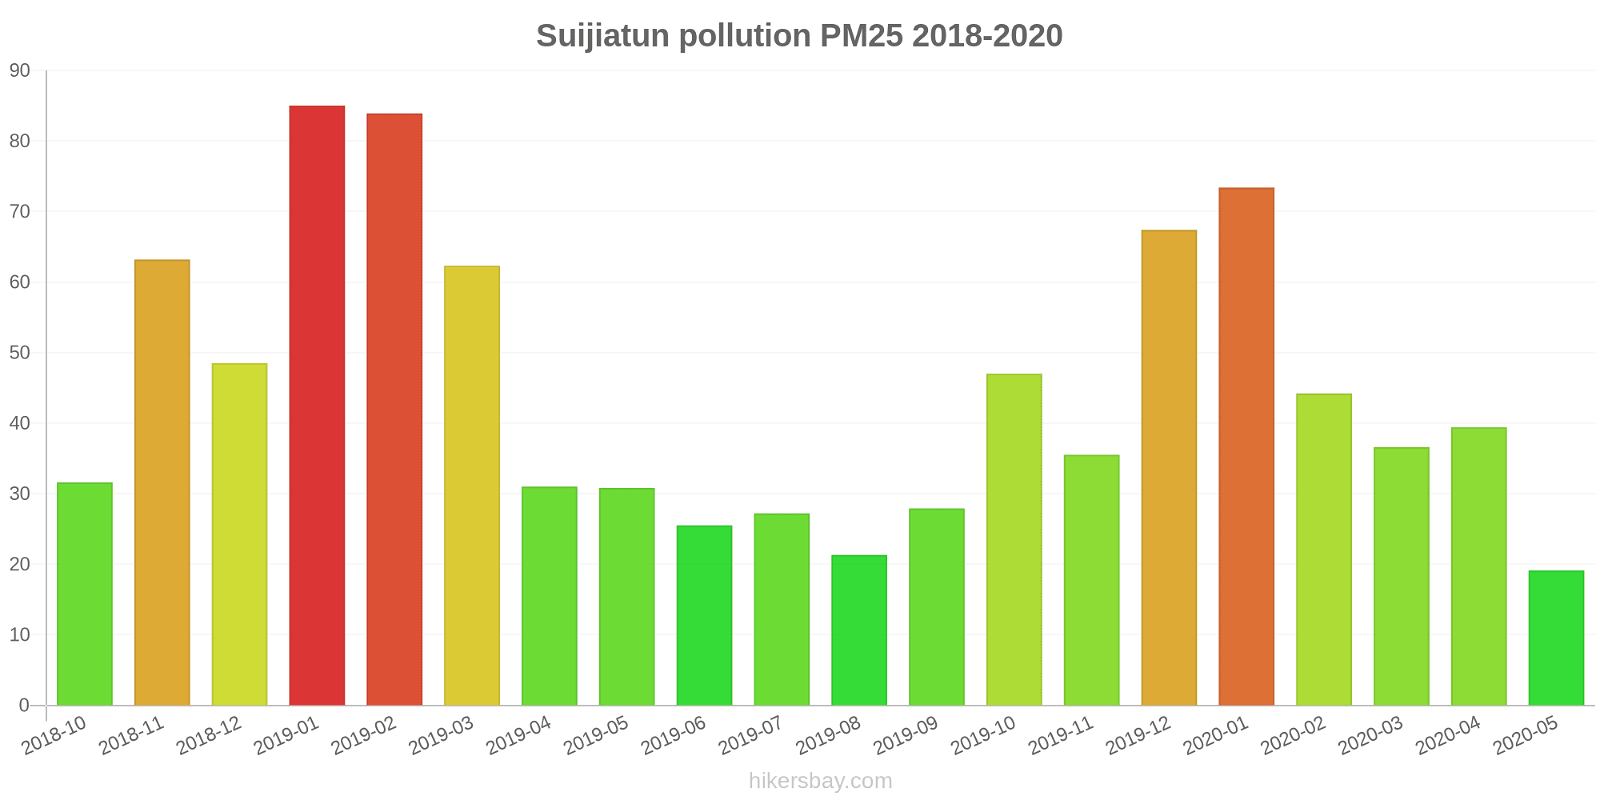
Die höchsten PM2,5-Werte wurden gemessen: 85 (Januar 2019).
Die niedrigste Feinstaubbelastung PM2,5 tritt im Monat auf: Mai (19).
Wie hoch ist die SO2-Belastung? (Schwefeldioxid (SO2))
18 (gut)
Wie hoch ist das NO2-Niveau? (Stickstoffdioxid (NO2))
3 (gut)
Wie hoch ist der CO-Gehalt? (Kohlenmonoxid (CO))
1 (gut)
Aktuelle Daten Freitag, 27. Mai 2022, 12:00
PM10 53 (Ungesund für sensible Gruppen)
O3 0 (gut)
PM2,5 7 (gut)
SO2 18 (gut)
NO2 3 (gut)
CO 1 (gut)
Daten zur Luftverschmutzung der letzten Tage in Suijiatun
index
2022-05-27
pm10
51
Unhealthy for Sensitive Groups
o3
0
Good
pm25
21
Moderate
so2
10
Good
no2
0
Good
co
1
Good
data source »
Luftverschmutzung in Suijiatun von Oktober 2018 bis Mai 2020
index
2020-05
2020-04
2020-03
2020-02
2020-01
2019-12
2019-11
2019-10
2019-09
2019-08
2019-07
2019-06
2019-05
2019-04
2019-03
2019-02
2019-01
2018-12
2018-11
2018-10
pm25
19 (Moderate)
39 (Unhealthy for Sensitive Groups)
37 (Unhealthy for Sensitive Groups)
44 (Unhealthy for Sensitive Groups)
73 (Unhealthy)
67 (Unhealthy)
36 (Unhealthy for Sensitive Groups)
47 (Unhealthy for Sensitive Groups)
28 (Moderate)
21 (Moderate)
27 (Moderate)
26 (Moderate)
31 (Moderate)
31 (Moderate)
62 (Unhealthy)
84 (Very Unhealthy)
85 (Very Unhealthy)
49 (Unhealthy for Sensitive Groups)
63 (Unhealthy)
32 (Moderate)
co
364 (Good)
541 (Good)
549 (Good)
770 (Good)
1 (Good)
1 (Good)
660 (Good)
633 (Good)
518 (Good)
489 (Good)
430 (Good)
330 (Good)
395 (Good)
454 (Good)
742 (Good)
1 (Good)
1 (Good)
911 (Good)
1 (Good)
673 (Good)
no2
6.2 (Good)
19 (Good)
18 (Good)
15 (Good)
24 (Good)
35 (Good)
29 (Good)
29 (Good)
28 (Good)
18 (Good)
15 (Good)
15 (Good)
22 (Good)
16 (Good)
27 (Good)
24 (Good)
42 (Moderate)
33 (Good)
38 (Good)
28 (Good)
o3
121 (Unhealthy for Sensitive Groups)
135 (Unhealthy for Sensitive Groups)
107 (Moderate)
87 (Moderate)
75 (Moderate)
61 (Good)
80 (Moderate)
131 (Unhealthy for Sensitive Groups)
155 (Unhealthy)
126 (Unhealthy for Sensitive Groups)
149 (Unhealthy for Sensitive Groups)
154 (Unhealthy)
155 (Unhealthy)
119 (Moderate)
119 (Moderate)
88 (Moderate)
68 (Good)
62 (Good)
93 (Moderate)
104 (Moderate)
pm10
51 (Unhealthy for Sensitive Groups)
92 (Unhealthy)
77 (Unhealthy for Sensitive Groups)
59 (Unhealthy for Sensitive Groups)
97 (Unhealthy)
99 (Unhealthy)
84 (Unhealthy)
97 (Unhealthy)
57 (Unhealthy for Sensitive Groups)
39 (Moderate)
45 (Moderate)
45 (Moderate)
69 (Unhealthy for Sensitive Groups)
73 (Unhealthy for Sensitive Groups)
103 (Unhealthy)
120 (Very Unhealthy)
131 (Very Unhealthy)
84 (Unhealthy)
114 (Very Unhealthy)
60 (Unhealthy for Sensitive Groups)
so2
4.5 (Good)
7 (Good)
7 (Good)
6.3 (Good)
12 (Good)
11 (Good)
6.5 (Good)
6.2 (Good)
6.8 (Good)
6 (Good)
6.7 (Good)
6.8 (Good)
6.8 (Good)
6.1 (Good)
11 (Good)
21 (Good)
26 (Good)
13 (Good)
9.4 (Good)
7.3 (Good)
data source »
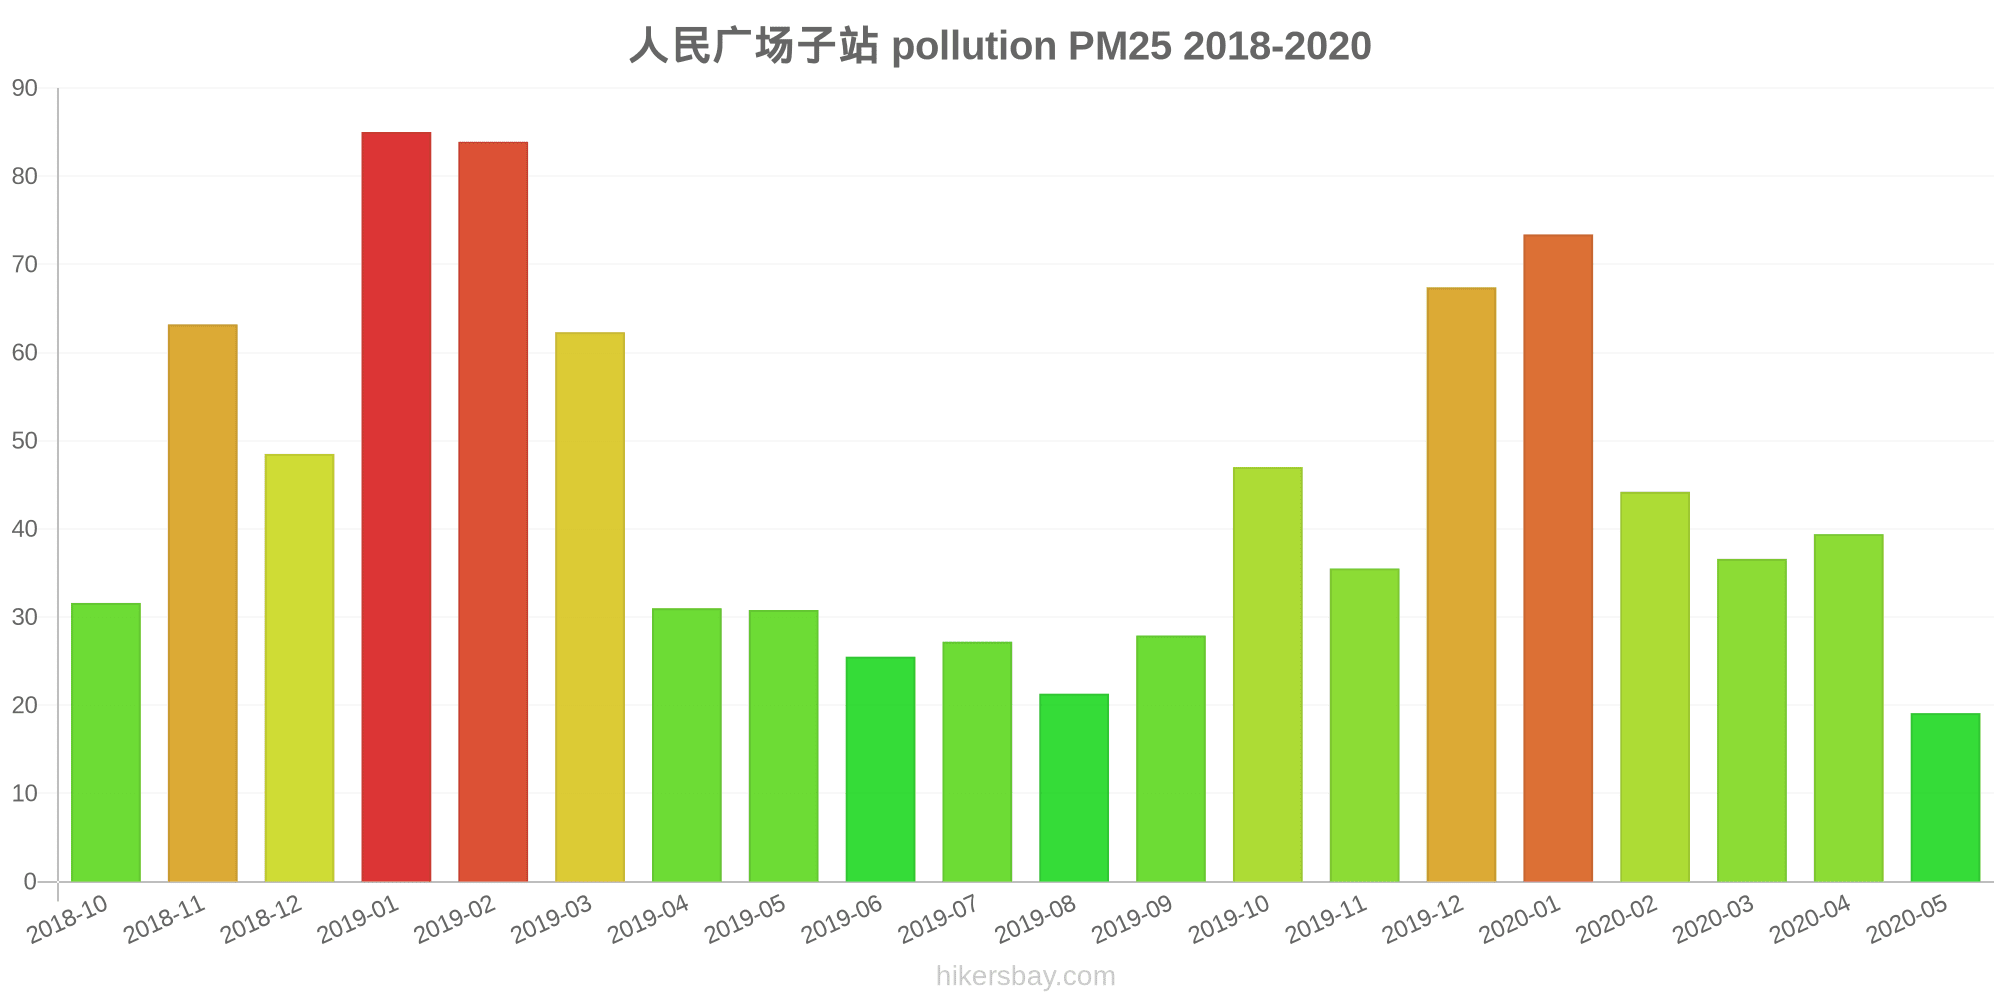
人民广场子站
Freitag, 27. Mai 2022, 12:00
PM10 53 (Ungesund für sensible Gruppen)
Feinstaub (PM10) Schwebestaub
O3 0.02 (gut)
Ozon (O3)
PM2,5 6.6 (gut)
Feinstaub (PM2,5)
SO2 18 (gut)
Schwefeldioxid (SO2)
NO2 3 (gut)
Stickstoffdioxid (NO2)
CO 1.3 (gut)
Kohlenmonoxid (CO)
人民广场子站
index
2022-05-27
pm10
51
o3
0.02
pm25
21
so2
9.6
no2
0.38
co
0.64
人民广场子站
2018-10 2020-05

index
2020-05
2020-04
2020-03
2020-02
2020-01
2019-12
2019-11
2019-10
2019-09
2019-08
2019-07
2019-06
2019-05
2019-04
2019-03
2019-02
2019-01
2018-12
2018-11
2018-10
pm25
19
39
37
44
73
67
36
47
28
21
27
26
31
31
62
84
85
49
63
32
co
364
541
549
770
1
1
660
633
518
489
430
330
395
454
742
1
1
911
1
673
no2
6.2
19
18
15
24
35
29
29
28
18
15
15
22
16
27
24
42
33
38
28
o3
121
135
107
87
75
61
80
131
155
126
149
154
155
119
119
88
68
62
93
104
pm10
51
92
77
59
97
99
84
97
57
39
45
45
69
73
103
120
131
84
114
60
so2
4.5
7
7
6.3
12
11
6.5
6.2
6.8
6
6.7
6.8
6.8
6.1
11
21
26
13
9.4
7.3
* Pollution data source:
https://openaq.org
(ChinaAQIData)
The data is licensed under CC-By 4.0
PM10 53 (Ungesund für sensible Gruppen)
O3 0 (gut)
PM2,5 7 (gut)
SO2 18 (gut)
NO2 3 (gut)
CO 1 (gut)
Daten zur Luftverschmutzung der letzten Tage in Suijiatun
| index | 2022-05-27 |
|---|---|
| pm10 | 51 Unhealthy for Sensitive Groups |
| o3 | 0 Good |
| pm25 | 21 Moderate |
| so2 | 10 Good |
| no2 | 0 Good |
| co | 1 Good |

| index | 2020-05 | 2020-04 | 2020-03 | 2020-02 | 2020-01 | 2019-12 | 2019-11 | 2019-10 | 2019-09 | 2019-08 | 2019-07 | 2019-06 | 2019-05 | 2019-04 | 2019-03 | 2019-02 | 2019-01 | 2018-12 | 2018-11 | 2018-10 |
|---|---|---|---|---|---|---|---|---|---|---|---|---|---|---|---|---|---|---|---|---|
| pm25 | 19 (Moderate) | 39 (Unhealthy for Sensitive Groups) | 37 (Unhealthy for Sensitive Groups) | 44 (Unhealthy for Sensitive Groups) | 73 (Unhealthy) | 67 (Unhealthy) | 36 (Unhealthy for Sensitive Groups) | 47 (Unhealthy for Sensitive Groups) | 28 (Moderate) | 21 (Moderate) | 27 (Moderate) | 26 (Moderate) | 31 (Moderate) | 31 (Moderate) | 62 (Unhealthy) | 84 (Very Unhealthy) | 85 (Very Unhealthy) | 49 (Unhealthy for Sensitive Groups) | 63 (Unhealthy) | 32 (Moderate) |
| co | 364 (Good) | 541 (Good) | 549 (Good) | 770 (Good) | 1 (Good) | 1 (Good) | 660 (Good) | 633 (Good) | 518 (Good) | 489 (Good) | 430 (Good) | 330 (Good) | 395 (Good) | 454 (Good) | 742 (Good) | 1 (Good) | 1 (Good) | 911 (Good) | 1 (Good) | 673 (Good) |
| no2 | 6.2 (Good) | 19 (Good) | 18 (Good) | 15 (Good) | 24 (Good) | 35 (Good) | 29 (Good) | 29 (Good) | 28 (Good) | 18 (Good) | 15 (Good) | 15 (Good) | 22 (Good) | 16 (Good) | 27 (Good) | 24 (Good) | 42 (Moderate) | 33 (Good) | 38 (Good) | 28 (Good) |
| o3 | 121 (Unhealthy for Sensitive Groups) | 135 (Unhealthy for Sensitive Groups) | 107 (Moderate) | 87 (Moderate) | 75 (Moderate) | 61 (Good) | 80 (Moderate) | 131 (Unhealthy for Sensitive Groups) | 155 (Unhealthy) | 126 (Unhealthy for Sensitive Groups) | 149 (Unhealthy for Sensitive Groups) | 154 (Unhealthy) | 155 (Unhealthy) | 119 (Moderate) | 119 (Moderate) | 88 (Moderate) | 68 (Good) | 62 (Good) | 93 (Moderate) | 104 (Moderate) |
| pm10 | 51 (Unhealthy for Sensitive Groups) | 92 (Unhealthy) | 77 (Unhealthy for Sensitive Groups) | 59 (Unhealthy for Sensitive Groups) | 97 (Unhealthy) | 99 (Unhealthy) | 84 (Unhealthy) | 97 (Unhealthy) | 57 (Unhealthy for Sensitive Groups) | 39 (Moderate) | 45 (Moderate) | 45 (Moderate) | 69 (Unhealthy for Sensitive Groups) | 73 (Unhealthy for Sensitive Groups) | 103 (Unhealthy) | 120 (Very Unhealthy) | 131 (Very Unhealthy) | 84 (Unhealthy) | 114 (Very Unhealthy) | 60 (Unhealthy for Sensitive Groups) |
| so2 | 4.5 (Good) | 7 (Good) | 7 (Good) | 6.3 (Good) | 12 (Good) | 11 (Good) | 6.5 (Good) | 6.2 (Good) | 6.8 (Good) | 6 (Good) | 6.7 (Good) | 6.8 (Good) | 6.8 (Good) | 6.1 (Good) | 11 (Good) | 21 (Good) | 26 (Good) | 13 (Good) | 9.4 (Good) | 7.3 (Good) |
PM10 53 (Ungesund für sensible Gruppen)
Feinstaub (PM10) SchwebestaubO3 0.02 (gut)
Ozon (O3)PM2,5 6.6 (gut)
Feinstaub (PM2,5)SO2 18 (gut)
Schwefeldioxid (SO2)NO2 3 (gut)
Stickstoffdioxid (NO2)CO 1.3 (gut)
Kohlenmonoxid (CO)人民广场子站
| index | 2022-05-27 |
|---|---|
| pm10 | 51 |
| o3 | 0.02 |
| pm25 | 21 |
| so2 | 9.6 |
| no2 | 0.38 |
| co | 0.64 |
人民广场子站
| index | 2020-05 | 2020-04 | 2020-03 | 2020-02 | 2020-01 | 2019-12 | 2019-11 | 2019-10 | 2019-09 | 2019-08 | 2019-07 | 2019-06 | 2019-05 | 2019-04 | 2019-03 | 2019-02 | 2019-01 | 2018-12 | 2018-11 | 2018-10 |
|---|---|---|---|---|---|---|---|---|---|---|---|---|---|---|---|---|---|---|---|---|
| pm25 | 19 | 39 | 37 | 44 | 73 | 67 | 36 | 47 | 28 | 21 | 27 | 26 | 31 | 31 | 62 | 84 | 85 | 49 | 63 | 32 |
| co | 364 | 541 | 549 | 770 | 1 | 1 | 660 | 633 | 518 | 489 | 430 | 330 | 395 | 454 | 742 | 1 | 1 | 911 | 1 | 673 |
| no2 | 6.2 | 19 | 18 | 15 | 24 | 35 | 29 | 29 | 28 | 18 | 15 | 15 | 22 | 16 | 27 | 24 | 42 | 33 | 38 | 28 |
| o3 | 121 | 135 | 107 | 87 | 75 | 61 | 80 | 131 | 155 | 126 | 149 | 154 | 155 | 119 | 119 | 88 | 68 | 62 | 93 | 104 |
| pm10 | 51 | 92 | 77 | 59 | 97 | 99 | 84 | 97 | 57 | 39 | 45 | 45 | 69 | 73 | 103 | 120 | 131 | 84 | 114 | 60 |
| so2 | 4.5 | 7 | 7 | 6.3 | 12 | 11 | 6.5 | 6.2 | 6.8 | 6 | 6.7 | 6.8 | 6.8 | 6.1 | 11 | 21 | 26 | 13 | 9.4 | 7.3 |