Luftforurening i Shāhpur: Real-time Air Quality Index og smog alarm.
Prognoser for forurening og luftkvalitet for Shāhpur. I dag er lørdag den 7. februar 2026. Følgende luftforureningsværdier er blevet registreret for Shāhpur:- nitrogendioxid (NO2) - 4 (God)
- svovldioxid (SO2) - 5 (God)
- kulilte (CO) - 1060 (God)
- partikler (PM2,5) støv - 70 (Usunde)
- partikler (PM10) ophængt støv - 62 (Usundt for følsomme grupper)

Hvad er luftkvaliteten i Shāhpur dag? Er luften forurenet i Shāhpur?. Er der smog?
Hvor højt er niveauet af NO2? (nitrogendioxid (NO2))
4 (God)
Hvad er niveauet for SO2 forurening? (svovldioxid (SO2))
5 (God)
Hvor højt er CO-niveauet? (kulilte (CO))
1060 (God)
Hvad er det nuværende niveau for PM2,5 i Shāhpur? (partikler (PM2,5) støv)
Dagens PM2.5 niveau er:
70 (Usunde)
Til sammenligning var det højeste niveau af PM2,5 i Shāhpur i de sidste 7 dage: 73 (mandag den 31. oktober 2022) og det laveste: 73 (mandag den 31. oktober 2022).
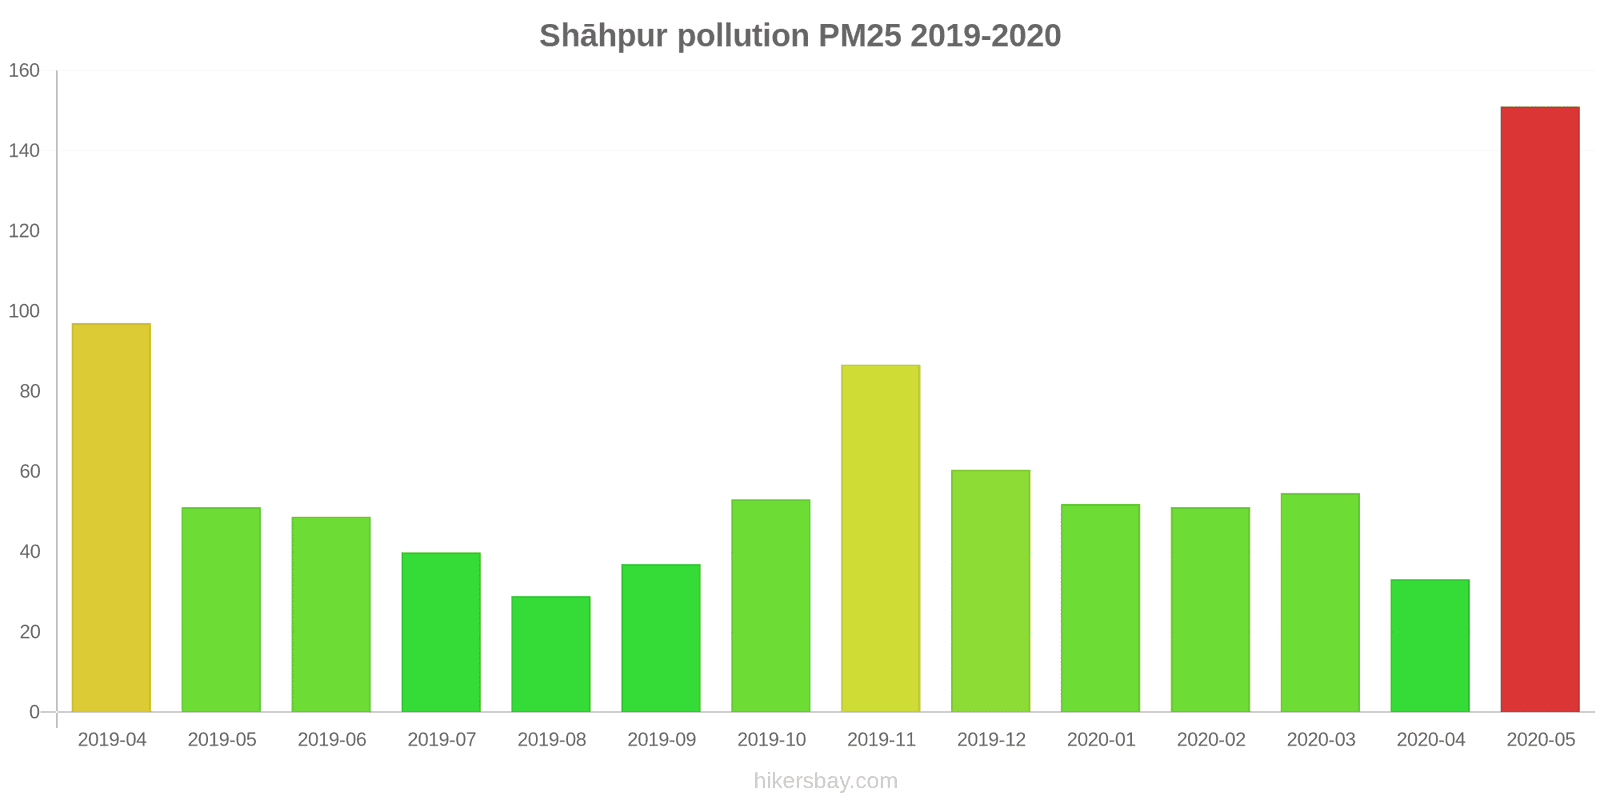
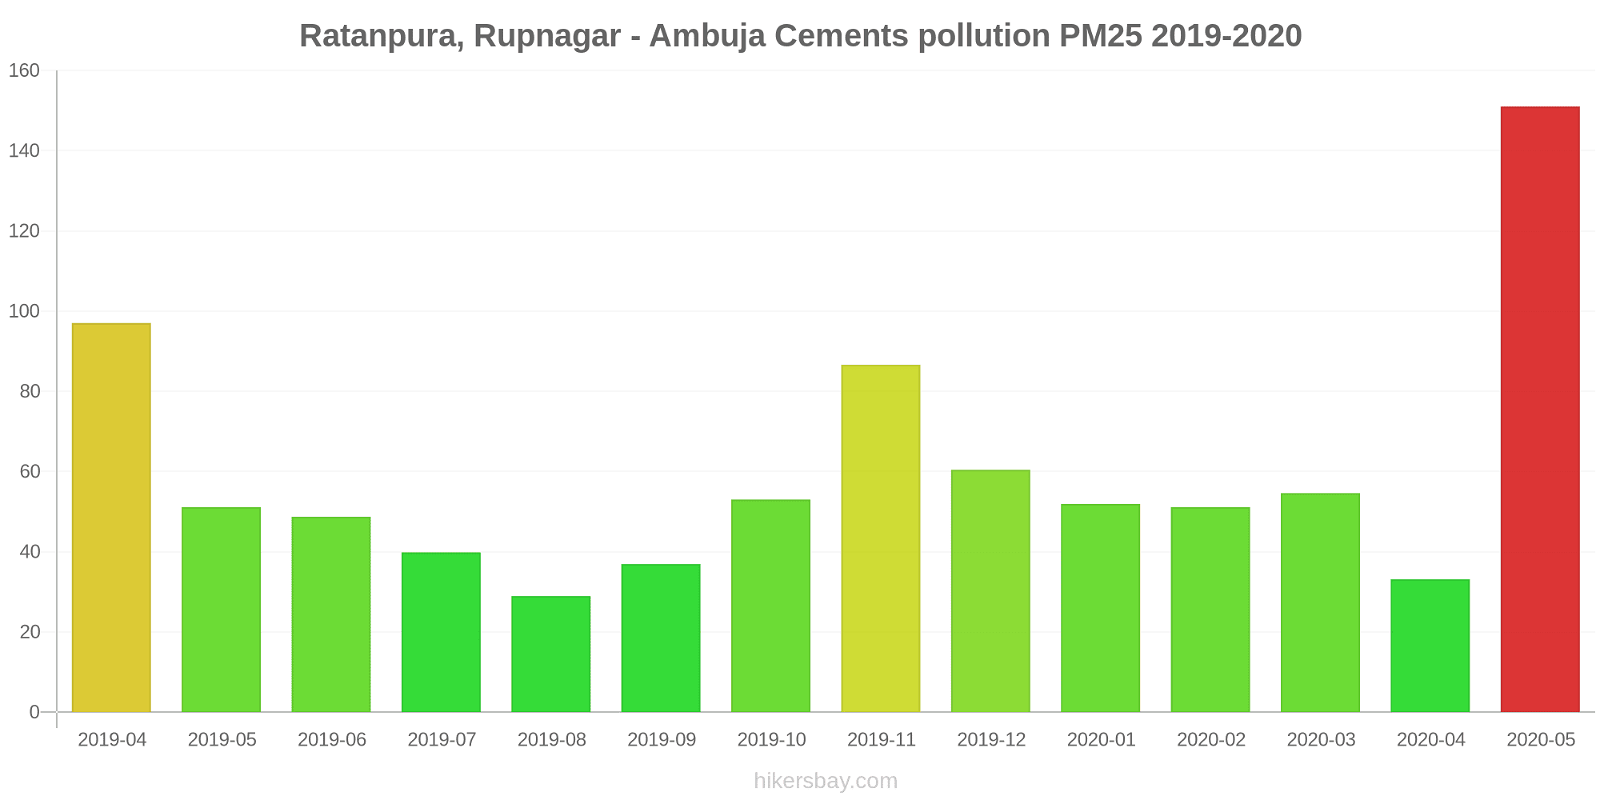
De højeste PM2,5-værdier blev registreret: 151 (maj 2020).
Det laveste niveau af partikler PM2,5 forurening forekommer i måned: august (29).
Hvad er niveauet for PM10 i dag i Shāhpur? (partikler (PM10) ophængt støv)
Det nuværende niveau af partikler PM10 i Shāhpur is:
62 (Usundt for følsomme grupper)
De højeste PM10-værdier forekommer normalt i måned: 173 (april 2019).
Den laveste værdi af partikel-PM10-forureningen Shāhpur er normalt registreret i: april (51).
Aktuelle data mandag den 31. oktober 2022 01.45
NO2 4 (God)
SO2 5 (God)
CO 1060 (God)
PM2,5 70 (Usunde)
PM10 62 (Usundt for følsomme grupper)
Data om luftforurening fra de seneste dage i Shāhpur
index
2022-10-31
no2
4
Good
so2
5
Good
co
1225
Good
pm25
73
Unhealthy
pm10
73
Unhealthy for Sensitive Groups
data source »
Luftforurening i Shāhpur fra april 2019 til maj 2020

index
2020-05
2020-04
2020-03
2020-02
2020-01
2019-12
2019-11
2019-10
2019-09
2019-08
2019-07
2019-06
2019-05
2019-04
pm25
151 (Very bad Hazardous)
33 (Moderate)
55 (Unhealthy for Sensitive Groups)
51 (Unhealthy for Sensitive Groups)
52 (Unhealthy for Sensitive Groups)
60 (Unhealthy)
87 (Very Unhealthy)
53 (Unhealthy for Sensitive Groups)
37 (Unhealthy for Sensitive Groups)
29 (Moderate)
40 (Unhealthy for Sensitive Groups)
49 (Unhealthy for Sensitive Groups)
51 (Unhealthy for Sensitive Groups)
97 (Very Unhealthy)
pm10
78 (Unhealthy for Sensitive Groups)
51 (Unhealthy for Sensitive Groups)
83 (Unhealthy)
109 (Unhealthy)
100 (Unhealthy)
106 (Unhealthy)
158 (Very bad Hazardous)
97 (Unhealthy)
80 (Unhealthy for Sensitive Groups)
63 (Unhealthy for Sensitive Groups)
72 (Unhealthy for Sensitive Groups)
108 (Unhealthy)
75 (Unhealthy for Sensitive Groups)
173 (Very bad Hazardous)
no2
7.3 (Good)
9.7 (Good)
9 (Good)
4.1 (Good)
5 (Good)
5.2 (Good)
3.6 (Good)
6.4 (Good)
8.5 (Good)
11 (Good)
6.3 (Good)
1.1 (Good)
8.1 (Good)
8 (Good)
so2
8.2 (Good)
8.3 (Good)
8.2 (Good)
10 (Good)
10 (Good)
9.8 (Good)
9.8 (Good)
9.5 (Good)
8.3 (Good)
7.8 (Good)
5 (Good)
6.6 (Good)
8 (Good)
8.6 (Good)
co
386 (Good)
359 (Good)
347 (Good)
232 (Good)
229 (Good)
219 (Good)
226 (Good)
227 (Good)
238 (Good)
153 (Good)
184 (Good)
201 (Good)
236 (Good)
217 (Good)
data source »
Ratanpura, Rupnagar - Ambuja Cements
mandag den 31. oktober 2022 01.45
NO2 3.8 (God)
nitrogendioxid (NO2)
SO2 4.7 (God)
svovldioxid (SO2)
CO 1060 (God)
kulilte (CO)
PM2,5 70 (Usunde)
partikler (PM2,5) støv
PM10 62 (Usundt for følsomme grupper)
partikler (PM10) ophængt støv
Ratanpura, Rupnagar - Ambuja Cements
index
2022-10-31
no2
4.5
so2
4.7
co
1225
pm25
73
pm10
73
Ratanpura, Rupnagar - Ambuja Cements
2019-04 2020-05

index
2020-05
2020-04
2020-03
2020-02
2020-01
2019-12
2019-11
2019-10
2019-09
2019-08
2019-07
2019-06
2019-05
2019-04
pm25
151
33
55
51
52
60
87
53
37
29
40
49
51
97
pm10
78
51
83
109
100
106
158
97
80
63
72
108
75
173
no2
7.3
9.7
9
4.1
5
5.2
3.6
6.4
8.5
11
6.3
1.1
8.1
8
so2
8.2
8.3
8.2
10
10
9.8
9.8
9.5
8.3
7.8
5
6.6
8
8.6
co
386
359
347
232
229
219
226
227
238
153
184
201
236
217
* Pollution data source:
https://openaq.org
(caaqm)
The data is licensed under CC-By 4.0
NO2 4 (God)
SO2 5 (God)
CO 1060 (God)
PM2,5 70 (Usunde)
PM10 62 (Usundt for følsomme grupper)
Data om luftforurening fra de seneste dage i Shāhpur
| index | 2022-10-31 |
|---|---|
| no2 | 4 Good |
| so2 | 5 Good |
| co | 1225 Good |
| pm25 | 73 Unhealthy |
| pm10 | 73 Unhealthy for Sensitive Groups |

| index | 2020-05 | 2020-04 | 2020-03 | 2020-02 | 2020-01 | 2019-12 | 2019-11 | 2019-10 | 2019-09 | 2019-08 | 2019-07 | 2019-06 | 2019-05 | 2019-04 |
|---|---|---|---|---|---|---|---|---|---|---|---|---|---|---|
| pm25 | 151 (Very bad Hazardous) | 33 (Moderate) | 55 (Unhealthy for Sensitive Groups) | 51 (Unhealthy for Sensitive Groups) | 52 (Unhealthy for Sensitive Groups) | 60 (Unhealthy) | 87 (Very Unhealthy) | 53 (Unhealthy for Sensitive Groups) | 37 (Unhealthy for Sensitive Groups) | 29 (Moderate) | 40 (Unhealthy for Sensitive Groups) | 49 (Unhealthy for Sensitive Groups) | 51 (Unhealthy for Sensitive Groups) | 97 (Very Unhealthy) |
| pm10 | 78 (Unhealthy for Sensitive Groups) | 51 (Unhealthy for Sensitive Groups) | 83 (Unhealthy) | 109 (Unhealthy) | 100 (Unhealthy) | 106 (Unhealthy) | 158 (Very bad Hazardous) | 97 (Unhealthy) | 80 (Unhealthy for Sensitive Groups) | 63 (Unhealthy for Sensitive Groups) | 72 (Unhealthy for Sensitive Groups) | 108 (Unhealthy) | 75 (Unhealthy for Sensitive Groups) | 173 (Very bad Hazardous) |
| no2 | 7.3 (Good) | 9.7 (Good) | 9 (Good) | 4.1 (Good) | 5 (Good) | 5.2 (Good) | 3.6 (Good) | 6.4 (Good) | 8.5 (Good) | 11 (Good) | 6.3 (Good) | 1.1 (Good) | 8.1 (Good) | 8 (Good) |
| so2 | 8.2 (Good) | 8.3 (Good) | 8.2 (Good) | 10 (Good) | 10 (Good) | 9.8 (Good) | 9.8 (Good) | 9.5 (Good) | 8.3 (Good) | 7.8 (Good) | 5 (Good) | 6.6 (Good) | 8 (Good) | 8.6 (Good) |
| co | 386 (Good) | 359 (Good) | 347 (Good) | 232 (Good) | 229 (Good) | 219 (Good) | 226 (Good) | 227 (Good) | 238 (Good) | 153 (Good) | 184 (Good) | 201 (Good) | 236 (Good) | 217 (Good) |
NO2 3.8 (God)
nitrogendioxid (NO2)SO2 4.7 (God)
svovldioxid (SO2)CO 1060 (God)
kulilte (CO)PM2,5 70 (Usunde)
partikler (PM2,5) støvPM10 62 (Usundt for følsomme grupper)
partikler (PM10) ophængt støvRatanpura, Rupnagar - Ambuja Cements
| index | 2022-10-31 |
|---|---|
| no2 | 4.5 |
| so2 | 4.7 |
| co | 1225 |
| pm25 | 73 |
| pm10 | 73 |
Ratanpura, Rupnagar - Ambuja Cements

| index | 2020-05 | 2020-04 | 2020-03 | 2020-02 | 2020-01 | 2019-12 | 2019-11 | 2019-10 | 2019-09 | 2019-08 | 2019-07 | 2019-06 | 2019-05 | 2019-04 |
|---|---|---|---|---|---|---|---|---|---|---|---|---|---|---|
| pm25 | 151 | 33 | 55 | 51 | 52 | 60 | 87 | 53 | 37 | 29 | 40 | 49 | 51 | 97 |
| pm10 | 78 | 51 | 83 | 109 | 100 | 106 | 158 | 97 | 80 | 63 | 72 | 108 | 75 | 173 |
| no2 | 7.3 | 9.7 | 9 | 4.1 | 5 | 5.2 | 3.6 | 6.4 | 8.5 | 11 | 6.3 | 1.1 | 8.1 | 8 |
| so2 | 8.2 | 8.3 | 8.2 | 10 | 10 | 9.8 | 9.8 | 9.5 | 8.3 | 7.8 | 5 | 6.6 | 8 | 8.6 |
| co | 386 | 359 | 347 | 232 | 229 | 219 | 226 | 227 | 238 | 153 | 184 | 201 | 236 | 217 |